. 2016 Aug 2;7(4):e00723-16.
doi: 10.1128/mBio.00723-16.

Ablation of STAT3 in the B Cell Compartment Restricts Gammaherpesvirus Latency In Vivo

Affiliations

Ablation of STAT3 in the B Cell Compartment Restricts Gammaherpesvirus Latency In Vivo

Sandeep Steven Reddy et al. mBio. .

Abstract

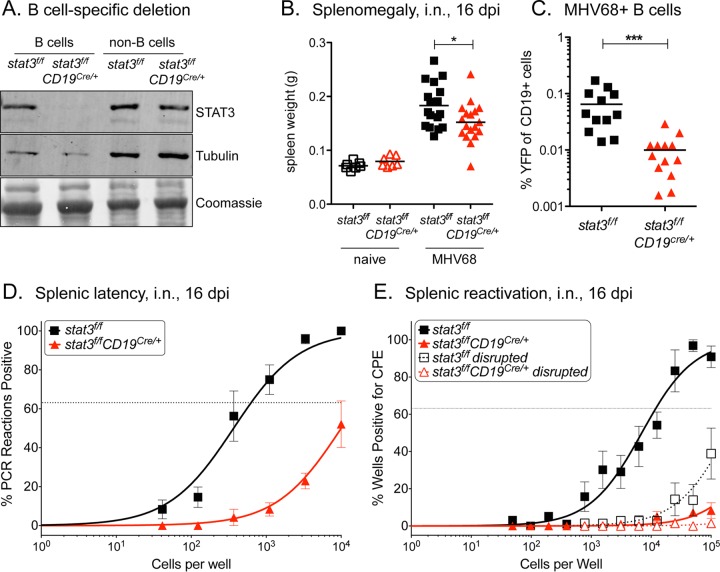
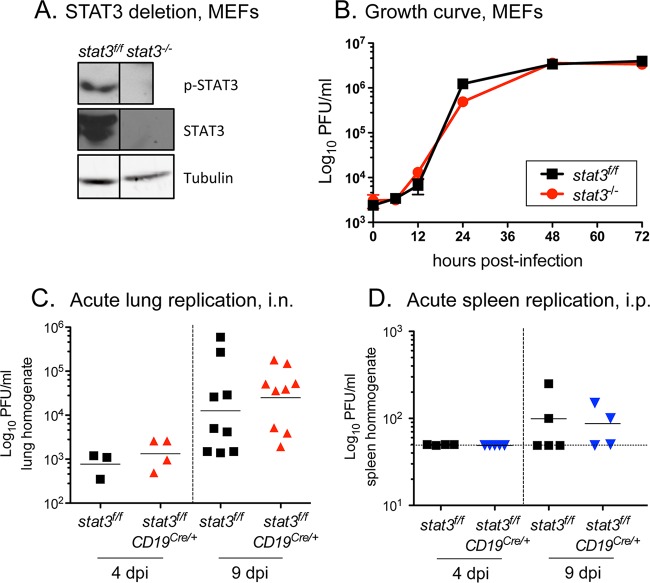
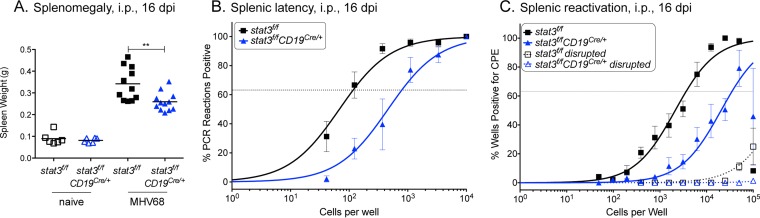
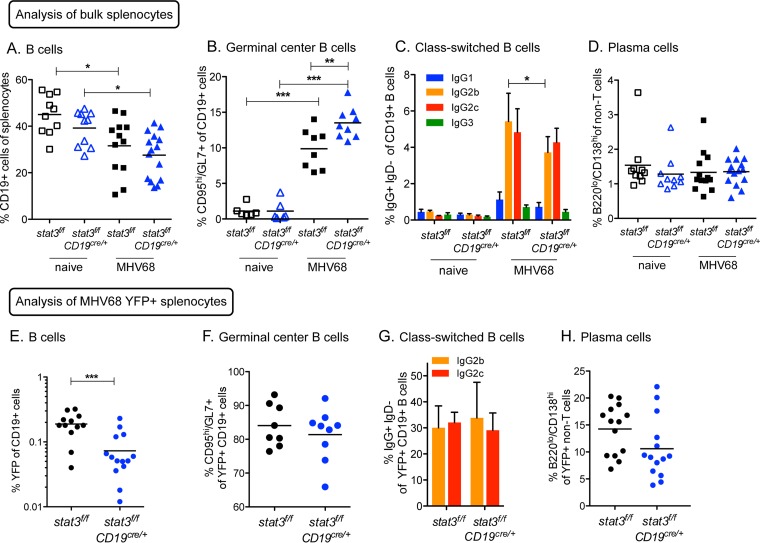
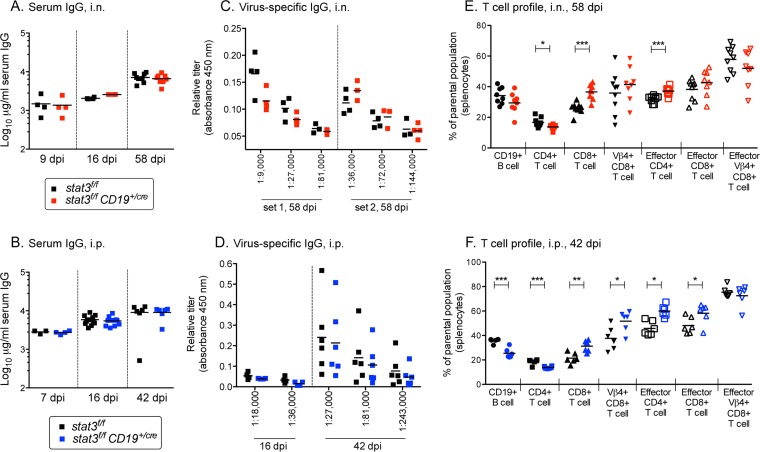
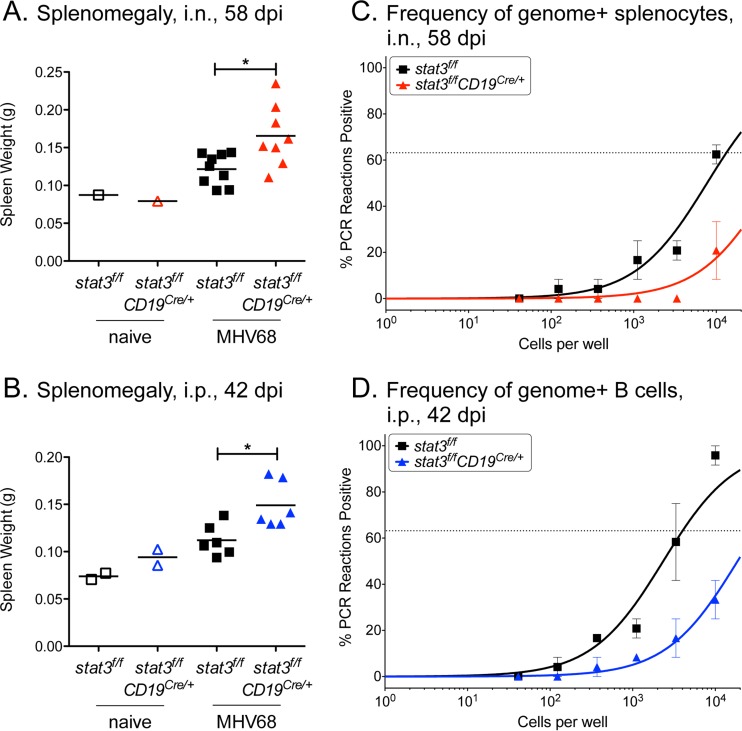
A challenging property of gammaherpesviruses is their ability to establish lifelong persistence. The establishment of latency in B cells is thought to involve active virus engagement of host signaling pathways. Pathogenic effects of these viruses during latency or following reactivation can be devastating to the host. Many cancers, including those associated with members of the gammaherpesvirus family, Kaposi's sarcoma-associated herpesvirus and Epstein-Barr virus, express elevated levels of active host signal transducer and activator of transcription-3 (STAT3). STAT3 is activated by tyrosine phosphorylation in response to many cytokines and can orchestrate effector responses that include proliferation, inflammation, metastasis, and developmental programming. However, the contribution of STAT3 to gammaherpesvirus pathogenesis remains to be completely understood. This is the first study to have identified STAT3 as a critical host determinant of the ability of gammaherpesvirus to establish long-term latency in an animal model of disease. Following an acute infection, murine gammaherpesvirus 68 (MHV68) established latency in resident B cells, but establishment of latency was dramatically reduced in animals with a B cell-specific STAT3 deletion. The lack of STAT3 in B cells did not impair germinal center responses for immunoglobulin (Ig) class switching in the spleen and did not reduce either total or virus-specific IgG titers. Although ablation of STAT3 in B cells did not have a global effect on these assays of B cell function, it had long-term consequences for the viral load of the host, since virus latency was reduced at 6 to 8 weeks postinfection. Our findings establish host STAT3 as a mediator of gammaherpesvirus persistence.

Importance: The insidious ability of gammaherpesviruses to establish latent infections can have detrimental consequences for the host. Identification of host factors that promote viral latency is essential for understanding latency mechanisms and for therapeutic interventions. We provide the first evidence that STAT3 expression is needed for murine gammaherpesvirus 68 to establish latency in primary B cells during an active immune response to infection. STAT3 deletion in B cells does not impair adaptive immune control of the virus, but loss of STAT3 in B cells has a long-lasting impact on viral persistence. These results indicate a potential therapeutic benefit of STAT3 inhibitors for combating gammaherpesvirus latency and, thereby, associated pathologies.


Figures

FIG 1
FIG 1
STAT3 is critical for the establishment of gammaherpesvirus latency in B cells. (A) Immunoblot of STAT3 from CD19+ B cell splenocytes of naive stat3f/f and stat3f/fCD19Cre/+ mice sorted by flow cytometry to 96% and 86% purity, respectively. (B to E) stat3f/f and stat3f/fCD19Cre/+ mice were infected with 1,000 PFU MHV68-YFP by intranasal (i.n.) inoculation and evaluated at 16 dpi. (B) Weights of spleens from uninfected and infected mice. Three independent experiments were performed with 3 to 7 mice per group. *, P < 0.05. (C) Evaluation of latency in B cells by flow cytometric evaluation of infected YFP+ CD19+ B cells. Two independent experiments were performed with 5 to 7 mice per group. ***, P ≤ 0.001. (D) Frequency of intact splenocytes harboring latent genomes. (E) Frequency of intact splenocytes that reactivated virus following explantation on fibroblasts. Dashed lines indicate disrupted splenocytes prior to quantification of preformed infectious virus. For panels B and C, each symbol represents an individual mouse. For the limiting dilution analyses whose results are shown in panels D and E, curve fit lines were determined by nonlinear regression analysis. Using Poisson distribution analysis, the intersection of the nonlinear regression curves with the dashed line at 63.2% was used to determine the frequency of cells that were positive for either the viral genome or the reactivating virus. Data are representative of the results of three independent experiments performed with 3 to 7 mice per group.
FIG 2
FIG 2
STAT3 is not essential for gammaherpesvirus replication. (A) Immunoblot of tyrosine-phosphorylated (p-STAT3) and total STAT3 protein in stat3f/f and stat3−/− murine embryonic fibroblasts (MEFs). Vertical lines indicate images joined together from the same blot to remove an independent clone. (B) Single-step growth curve in stat3f/f and stat3−/− MEFs at an MOI of 5.0 with WT MHV68-YFP. Symbols represent data from three independent wells ± standard deviations (SD). (C) Acute replication in the lungs of stat3f/f and stat3f/fCD19Cre/+ mice infected with 1,000 PFU MHV68-YFP by intranasal inoculation at the indicated dpi. (D) Acute replication in the spleens of stat3f/f and stat3f/fCD19Cre/+ mice infected with 1,000 PFU MHV68-YFP by intraperitoneal (i.p.) inoculation at the indicated dpi. Titers of lung and spleen homogenates were determined by plaque assay; the horizontal solid lines indicate the geometric mean titers. Each symbol represents an individual mouse. Dashed lines depict the limit of detection at 50 PFU/ml (log10 of 1.7).
FIG 3
FIG 3
STAT3 is critical for the establishment of latency in B cells by the more direct intraperitoneal route of inoculation. stat3f/f and stat3f/fCD19Cre/+ mice were infected with 1,000 PFU MHV68-YFP by intraperitoneal inoculation and evaluated 16 dpi. (A) Weights of spleens from uninfected and infected mice. Each symbol represents an individual mouse; 2 independent experiments were performed with three naive mice each, and three independent experiments were performed with 4 infected mice per group. **, P < 0.01. (B) Frequency of intact splenocytes harboring latent genomes. (C) Frequency of intact splenocytes undergoing reactivation from latency upon explantation. Dashed lines indicate splenocytes that were disrupted prior to plating to quantify preformed infectious virus. For the limiting dilution analyses whose results are shown in panels B and C, curve fit lines were determined by nonlinear regression analysis. Using Poisson distribution analysis, the intersection of the nonlinear regression curves with the dashed line at 63.2% was used to determine the frequency of cells that were positive for either the viral genome or the reactivating virus. Data represent compiled results from four independent experiments performed with 4 to 5 mice per group.
FIG 4
FIG 4
Loss of STAT3 in B cells does not impair virus colonization of germinal center and post-germinal-center B cells. stat3f/f and stat3f/fCD19Cre/+ mice were infected with 1,000 PFU MHV68-YFP by intraperitoneal inoculation, and splenocytes were evaluated by flow cytometry at 16 dpi. (A) Frequency of CD19+ B cells of splenocytes gated on live lymphocytes from naive and infected mice. (B to D) Frequency of B cells that bear surface markers of germinal center B cells (GL7+ CD95hi), immunoglobulin class switching (IgG2b+ or IgG2c+ and IgD), or plasma cells (B220hi CD138lo). Each symbol represents an individual mouse. *, P < 0.05, **, P < 0.01, ***, P ≤ 0.001. (E) Frequency of B cells infected with MHV68 determined by percentage of CD19+ B cells that express the YFP marker. (F to H) Frequency of infected YFP+ B cells that bear surface markers of germinal center B cells (GL7+ CD95hi) (F), immunoglobulin class switching (IgG2b+ or IgG2c+ and IgD) (G), or plasma cells (B220hi CD138lo) (H). For panels A, D, E, and H, data represent compiled results from three individual experiments performed with 3 to 6 mice per group. For panels B and F, data represent compiled results from two individual experiments performed with 3 naive mice or 4 or 5 infected mice per group. For panels C and G, columns represent means ± SD of results from 4 to 6 individual mice.
FIG 5
FIG 5
STAT3 is dispensable for adaptive immune responses to gammaherpesvirus infection. stat3f/f and stat3f/fCD19Cre/+ mice were infected with 1,000 PFU MHV68-YFP by intranasal inoculation (A, C, and E) or intraperitoneal inoculation (B, D, and F) at the indicated dpi. (A and B) Total IgG production in sera of individual mice. The bars represent the geometric mean titers. (C and D) Relative titers of MHV68-specific IgG production in sera of individual mice at the indicated dilutions. (E and F) The T cell profile was evaluated by flow cytometric analysis for the frequency of splenocytes gated on live lymphocytes that bear surface markers of CD4+ T cells (CD4+ CD8 CD19), CD8+ T cells (CD8+ CD4 CD19), Vβ4+ CD8+ T cells (Vβ4+ CD8+ CD4 CD19) or effector CD4+ or CD8+ T cells (CD44hi CD62Llo). Each symbol represents an individual mouse. *, P < 0.05, **, P < 0.01, ***, P < 0.001. For 42 and 58 dpi, data represent compiled results from two independent experiments performed with 3 to 5 mice per group.
FIG 6
FIG 6
STAT3 loss in B cells has a sustained impact on splenic latency late during chronic infection regardless of the route of infection. stat3f/f and stat3f/fCD19Cre/+ mice were infected with 1,000 PFU MHV68-YFP by intranasal inoculation and evaluated 58 dpi (A and C) or were infected by intraperitoneal inoculation and evaluated at 42 dpi (B and D). (A and B) Weights of spleens from uninfected and infected mice. Each symbol represents an individual mouse. *, P < 0.05. (C) Frequency of intact splenocytes harboring latent genomes by limiting dilution analyses. (D) Frequency of intact CD19+ B lymphocytes harboring latent genomes determined by limiting dilution analyses. B cells from stat3f/f mice and stat3f/fCD19Cre/+ mice were enriched to 91% to 92% purity and 86% to 89% purity, respectively, by the use of magnetic beads. Curve fit lines were determined by nonlinear regression. Using Poisson distribution analysis, the intersection of the nonlinear regression curves with the dashed line at 63.2% was used to determine the frequency of cells that were positive for the viral genome. For the stat3f/fCD19Cre/+ mice, the last data point falls below 63.2%. Data represent compiled results from two independent experiments performed with 3 to 4 mice per group.

Similar articles

Cited by

References

    1. Jha HC, Banerjee S, Robertson ES. 2016. The role of gammaherpesviruses in cancer pathogenesis. Pathogens 5:18. doi:10.3390/pathogens5010018. - DOI - PMC - PubMed
    1. Speck SH, Ganem D. 2010. Viral latency and its regulation: lessons from the gamma-herpesviruses. Cell Host Microbe 8:100–115. doi:10.1016/j.chom.2010.06.014. - DOI - PMC - PubMed
    1. Barton E, Mandal P, Speck SH. 2011. Pathogenesis and host control of gammaherpesviruses: lessons from the mouse. Annu Rev Immunol 29:351–397. doi:10.1146/annurev-immunol-072710-081639. - DOI - PubMed
    1. Stark GR, Darnell JE Jr.. 2012. The JAK-STAT pathway at twenty. Immunity 36:503–514. doi:10.1016/j.immuni.2012.03.013. - DOI - PMC - PubMed
    1. Levy DE, Darnell JE. 2002. Stats: transcriptional control and biological impact. Nat Rev Mol Cell Biol 3:651–662. doi:10.1038/nrm909. - DOI - PubMed

Publication types

Substances