. 2016 Aug 2;7(4):e00978-16.
doi: 10.1128/mBio.00978-16.

The Double-Stranded DNA Virosphere as a Modular Hierarchical Network of Gene Sharing

Affiliations

The Double-Stranded DNA Virosphere as a Modular Hierarchical Network of Gene Sharing

Jaime Iranzo et al. mBio. .

Abstract

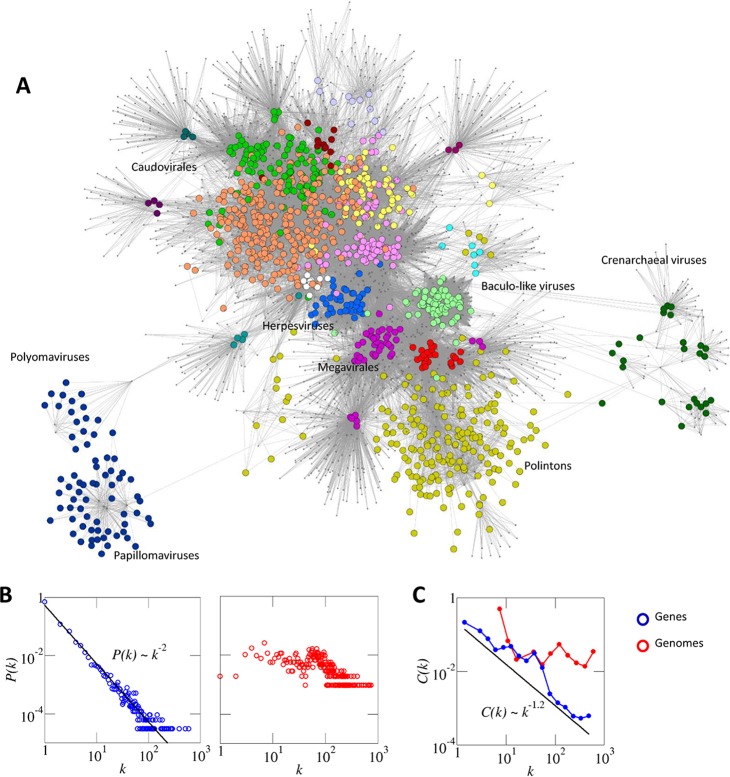
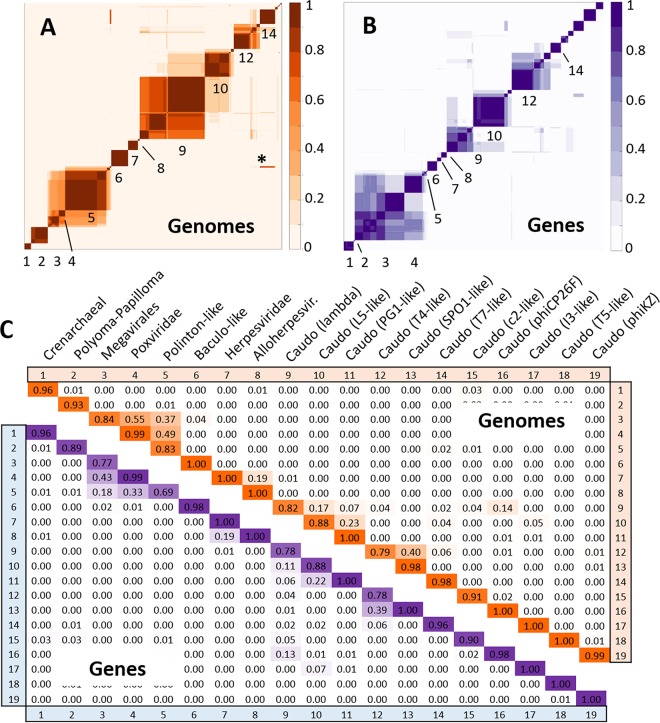
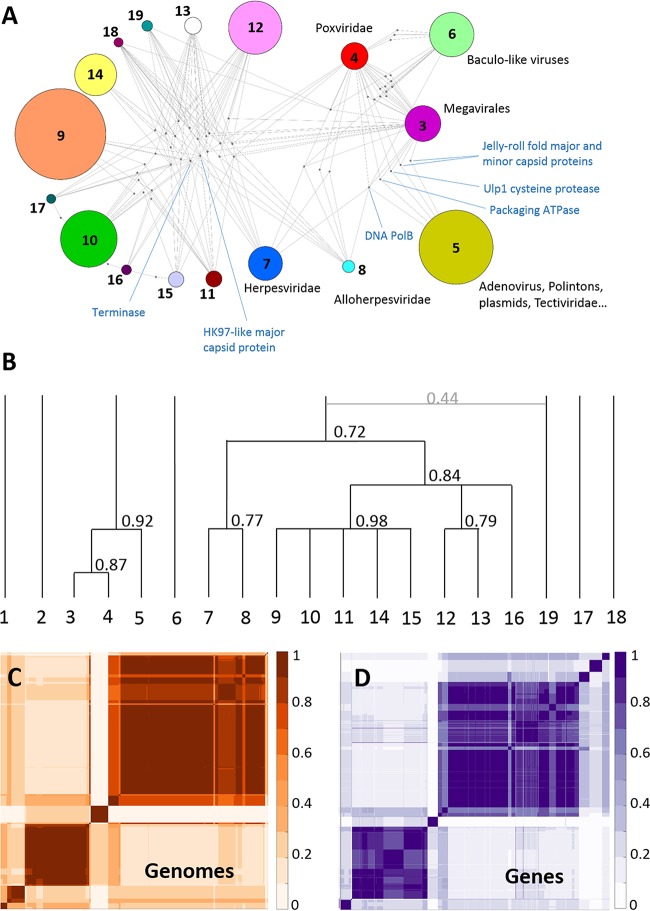
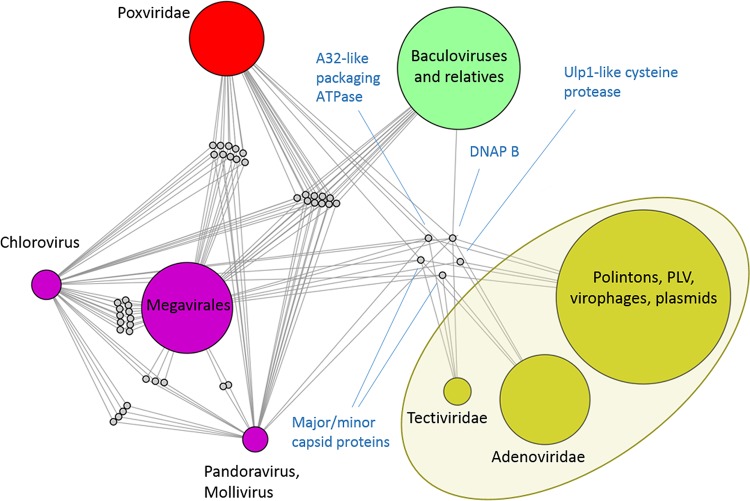
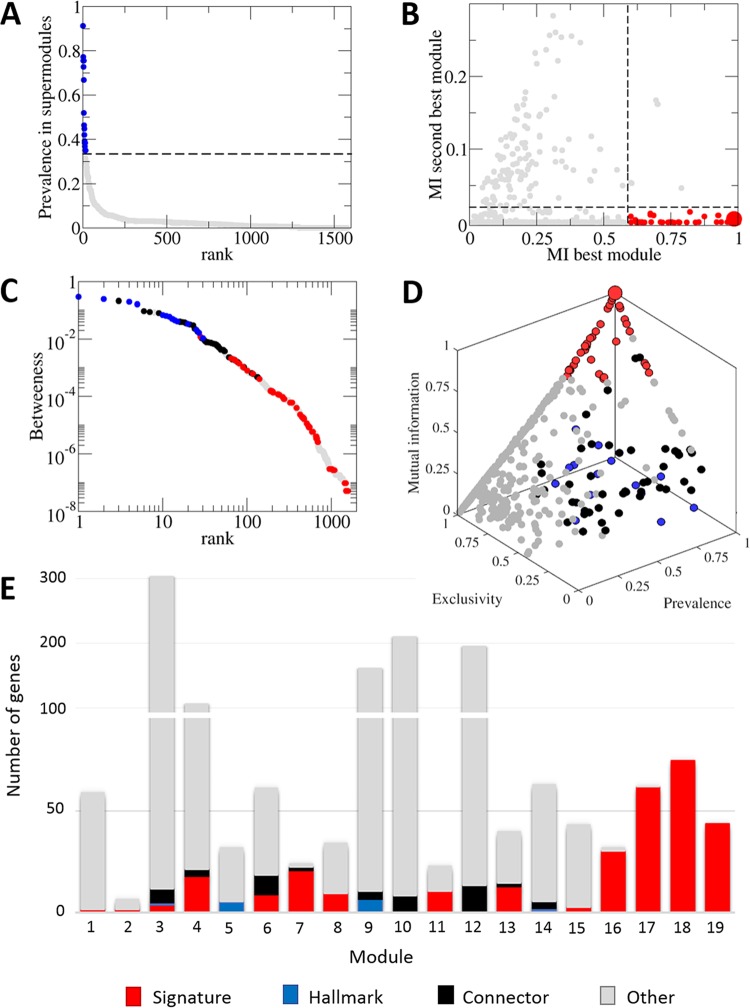
Virus genomes are prone to extensive gene loss, gain, and exchange and share no universal genes. Therefore, in a broad-scale study of virus evolution, gene and genome network analyses can complement traditional phylogenetics. We performed an exhaustive comparative analysis of the genomes of double-stranded DNA (dsDNA) viruses by using the bipartite network approach and found a robust hierarchical modularity in the dsDNA virosphere. Bipartite networks consist of two classes of nodes, with nodes in one class, in this case genomes, being connected via nodes of the second class, in this case genes. Such a network can be partitioned into modules that combine nodes from both classes. The bipartite network of dsDNA viruses includes 19 modules that form 5 major and 3 minor supermodules. Of these modules, 11 include tailed bacteriophages, reflecting the diversity of this largest group of viruses. The module analysis quantitatively validates and refines previously proposed nontrivial evolutionary relationships. An expansive supermodule combines the large and giant viruses of the putative order "Megavirales" with diverse moderate-sized viruses and related mobile elements. All viruses in this supermodule share a distinct morphogenetic tool kit with a double jelly roll major capsid protein. Herpesviruses and tailed bacteriophages comprise another supermodule, held together by a distinct set of morphogenetic proteins centered on the HK97-like major capsid protein. Together, these two supermodules cover the great majority of currently known dsDNA viruses. We formally identify a set of 14 viral hallmark genes that comprise the hubs of the network and account for most of the intermodule connections.

Importance: Viruses and related mobile genetic elements are the dominant biological entities on earth, but their evolution is not sufficiently understood and their classification is not adequately developed. The key reason is the characteristic high rate of virus evolution that involves not only sequence change but also extensive gene loss, gain, and exchange. Therefore, in the study of virus evolution on a large scale, traditional phylogenetic approaches have limited applicability and have to be complemented by gene and genome network analyses. We applied state-of-the art methods of such analysis to reveal robust hierarchical modularity in the genomes of double-stranded DNA viruses. Some of the identified modules combine highly diverse viruses infecting bacteria, archaea, and eukaryotes, in support of previous hypotheses on direct evolutionary relationships between viruses from the three domains of cellular life. We formally identify a set of 14 viral hallmark genes that hold together the genomic network.


Figures

FIG 1
FIG 1
The dsDNA virus world as a bipartite network. Nodes corresponding to genomes are depicted as larger circles, and nodes corresponding to core gene families are depicted as dots. An edge is drawn whenever a genome harbors a representative of a core gene family. (A) The modular structure of the network is highlighted by coloring genome nodes according to the module to which they belong (color coding is as described for Fig. 4 to 6). The location of some major viral groups is indicated for illustrative purposes. (B) The degree distributions of genes (left) and genomes (right). In the case of genes, the best fit to a power law distribution is also shown. (C) The scaling of the clustering coefficient, C(k), with respect to the degree k (genes and genomes) suggests a hierarchical modular structure organized around high-level hallmark genes [large k and small C(k)] and low-level signature genes [small k and large C(k)].
FIG 2
FIG 2
Core-shell-cloud structure of viral gene families. For each bin, the bar indicates the number of gene families with a retention probability in the range defined by the x axis. The blue dots indicate the median abundance of such families in the whole set of genomes (error bars correspond to the 25th and 75th percentiles). Family abundances were normalized so that an abundance equal to 1 means that the given family is present in each genome (the contributions of highly similar genomes were downweighted to compensate for sampling bias [see Materials and Methods]). The gene families with the highest retention probability (right-most bin) are typically restricted to a small number of genomes (median abundance, approximately 0.06). In contrast, many of the “core” genes according to the intuitive definition (i.e., those present in a large number of genomes) belong to the bin with a retention probability in the range of 0.7 to 0.8. For the purpose of this work, gene families to the right of the dashed, vertical line (i.e., those with a retention probability greater than 1/e) were considered core genes.
FIG 3
FIG 3
Robustness and cross-similarity of modules in the virus bipartite network. (A and B) Heat map representations of the module robustness matrices for genomes (A) and gene families (B). To generate these matrices, nodes of one class (genomes or gene families) were sorted according to the module they belong to in the optimal partition of the network. For each pair of nodes, the matrix contains the fraction of 100 replicates in which both nodes were placed in the same module. Robust modules appear as blocks in the module robustness matrix; deviations from the block structure correspond to modules that are sometimes merged or nodes without a clear module assignation. The asterisk shows the case of mitochondrial plasmids which belong to module 5 in the best partition but are often assigned to module 14. (C) Quantitative summary of the average robustness of modules at the genome and gene level (elements on the diagonal) and the cross-similarity between pairs of modules (fraction of replicates in which nodes of both modules appear together; off-diagonal elements). See Table 4 for the list of the taxa assigned to each module.
FIG 4
FIG 4
Higher-order structure of the virus network. (A) Bipartite network defined by modules (numbered as for Table 4) and connector genes. A module is linked to a connector gene if the prevalence (relative abundance) of the gene in that module is greater than exp(−1). Modules 1 (crenarcheal viruses) and 2 (polyomaviruses and papillomaviruses) that are only weakly connected to other modules are not represented. Modules are represented as colored circles, with the node size proportional to the number of genomes in the module. Connector genes are represented as dots. The position of some hallmark genes discussed in the text is shown. (B) Tree representation of the hierarchical supermodule structure of the network. At each iteration, two (super)modules were merged if their members clustered together in at least 50 of 100 replicates of the module detection algorithm. Branch lengths are proportional to the number of iterations required for two modules to merge. The number associated to each branch indicates the robustness of the respective supermodule. (C and D) Heat map representations of the supermodule robustness matrices for genomes (C) and gene families (D) after the last iteration of the higher-order supermodule search. To generate these matrices, nodes of one class (genomes or gene families) were sorted according to the supermodule they belong to in the optimal partition of the network. For each pair of nodes, the matrix contains the fraction of 100 replicates in which both nodes were placed in the same supermodule. Robust supermodules appear as blocks in the module robustness matrix.
FIG 5
FIG 5
The internal structure of the PL-“Megavirales” supermodule. A module is linked to a connector gene if the prevalence of the gene in that module is greater than exp(−1). Modules are represented as larger circles, with sizes proportional to the number of genomes in the module; colors coding is the same as in Fig. 4. Connector genes are represented as smaller gray nodes. The PL elements, which originally formed a single module (shaded oval), were further dissected to produce the submodule structure shown. The hallmark genes are labeled.
FIG 6
FIG 6
Internal structure of the Caudovirales supermodule. A module is linked to a connector gene if the prevalence of the gene in that module is greater than exp(−1). Modules are represented as larger circles, with sizes proportional to the number of genomes in the module; color coding is as shown in Fig. 4. Module 15 contains Siphoviridae from the Lactococcus phage 936 sensu lato and c2-like groups. Module 16 conatins Clostridium phage phiCP26F and related strains. Connector genes are represented as smaller gray nodes. Hallmark genes are labeled.
FIG 7
FIG 7
Characterization of viral hallmark genes and module-specific signature genes. (A) All core gene families sorted by their relative prevalence in the major supermodules are shown in gray. Hallmark genes are those that, besides belonging to the set of connector genes, have a relative prevalence greater than 0.35 in at least one of the two major supermodules. (B) Signature genes are those genes with mutual information greater than 0.6 to their best-matching module (x axis) and less than 0.02 to their second match (y axis). The rest of the gene families are represented in gray for comparison. (C) Betweenness-rank distribution for genes in the bipartite network. The nodes with the highest betweenness correspond to hallmark and other connector genes. Signature genes are represented in red. (D) Three-dimensional representation of core genes based on mutual information, relative prevalence, and exclusivity with respect to their assigned module (same color coding as in panel C). (E) A histogram with the number of signature, hallmark, connector (nonhallmark), and other (gray) genes per module. Reanalysis of the Caudovirales subnetwork detected 13 signature genes for module 12, which are not shown in the figure. In panels B and D, a large red point indicates the existence of 205 signature genes whose presence-absence patterns perfectly match their assigned modules.

Comment in

  • A network perspective on the virus world.
    Iranzo J, Krupovic M, Koonin EV. Iranzo J, et al. Commun Integr Biol. 2017 Feb 23;10(2):e1296614. doi: 10.1080/19420889.2017.1296614. eCollection 2017. Commun Integr Biol. 2017. PMID: 28451057 Free PMC article.

References

    1. Edwards RA, Rohwer F. 2005. Viral metagenomics. Nat Rev Microbiol 3:504–510. doi: 10.1038/nrmicro1163. - DOI - PubMed
    1. Rohwer F. 2003. Global phage diversity. Cell 113:141. doi: 10.1016/S0092-8674(03)00276-9. - DOI - PubMed
    1. Rohwer F, Thurber RV. 2009. Viruses manipulate the marine environment. Nature 459:207–212. doi: 10.1038/nature08060. - DOI - PubMed
    1. Suttle CA. 2005. Viruses in the sea. Nature 437:356–361. doi: 10.1038/nature04160. - DOI - PubMed
    1. Suttle CA. 2007. Marine viruses—major players in the global ecosystem. Nat Rev Microbiol 5:801–812. doi: 10.1038/nrmicro1750. - DOI - PubMed

Publication types

LinkOut - more resources