. 2016 Aug 2;7(4):e01144-16.
doi: 10.1128/mBio.01144-16.

Obesity Outweighs Protection Conferred by Adjuvanted Influenza Vaccination

Affiliations

Obesity Outweighs Protection Conferred by Adjuvanted Influenza Vaccination

Erik A Karlsson et al. mBio. .

Abstract

Obesity is a risk factor for developing severe influenza virus infection, making vaccination of utmost importance for this high-risk population. However, vaccinated obese animals and adults have decreased neutralizing antibody responses. In these studies, we tested the hypothesis that the addition of either alum or a squalene-based adjuvant (AS03) to an influenza vaccine would improve neutralizing antibody responses and protect obese mice from challenge. Our studies demonstrate that adjuvanted vaccine does increase both neutralizing and nonneutralizing antibody levels compared to vaccine alone. Although obese mice mount significantly decreased virus-specific antibody responses, both the breadth and the magnitude of the responses against hemagglutinin (HA) and neuraminidase (NA) are decreased compared to the responses in lean mice. Importantly, even with a greater than fourfold increase in neutralizing antibody levels, obese mice are not protected against influenza virus challenge and viral loads remain elevated in the respiratory tract. Increasing the antigen dose affords no added protection, and a decreasing viral dose did not fully mitigate the increased mortality seen in obese mice. Overall, these studies highlight that, while the use of an adjuvant does improve seroconversion, vaccination does not fully protect obese mice from influenza virus challenge, possibly due to the increased sensitivity of obese animals to infection. Given the continued increase in the global obesity epidemic, our findings have important implications for public health.

Importance: Vaccination is the most effective strategy for preventing influenza virus infection and is a key component for pandemic preparedness. However, vaccines may fail to provide optimal protection in high-risk groups, including overweight and obese individuals. Given the worldwide obesity epidemic, it is imperative that we understand and improve vaccine efficacy. No work to date has investigated whether adjuvants increase the protective capacity of influenza vaccines in the obese host. In these studies, we show that adjuvants increased the neutralizing and nonneutralizing antibody responses during vaccination of lean and obese mice to levels considered "protective," and yet, obese mice still succumbed to infection. This vulnerability is likely due to a combination of factors, including the increased susceptibility of obese animals to develop severe and even lethal disease when infected with very low viral titers. Our studies highlight the critical public health need to translate these findings and better understand vaccination in this increasing population.


Figures

FIG 1
FIG 1
H7 postboost serology data. Eight groups of lean (solid symbols) or obese (open symbols) mice (n = 10 or 11/type/group) were vaccinated with PBS (circles), vaccine alone (squares), vaccine plus alum adjuvant (octahedrons), or vaccine plus squalene adjuvant (triangles). Three weeks postvaccination, mice were boosted, and serum was collected 3 weeks postboost. Postboost serum was analyzed for hemagglutination inhibition (HAI) (a), microneutralization (MN) (b), stalk antibody (c), and neuraminidase inhibition (NAI) (d) against influenza virus A/Anhui/1/2013 (H7N9). For HAI, MN, and NAI, data are presented as individual data points plus mean values ± standard errors. For stalk antibody, data are presented as mean absorbance values ± standard errors for mock-treated and vaccine-plus-adjuvant groups. Statistical significance was determined using ANOVA, with vaccine strategy and mouse type as the main effects. Tukey’s test was used for post hoc comparison. Differences were considered significant at a P value of <0.05. *, P < 0.05; **, P < 0.005; ***, P < 0.0005; ****, P < 0.00005. Solid lines indicate significance within vaccine strategies, and dashed lines indicate significance between lean and obese groups.
FIG 2
FIG 2
H1 postboost serology data. Eight groups of lean (solid symbols) or obese (open symbols) mice (n = 10 or 11/type/group) were vaccinated with PBS (circles), vaccine alone (squares), vaccine plus alum adjuvant (octahedrons), or vaccine plus squalene adjuvant (triangles). Three weeks postvaccination, mice were boosted, and serum was collected 3 weeks postboost. Postboost serum was analyzed for hemagglutination inhibition (HAI) (a), microneutralization (MN) (b), stalk antibody (c), and neuraminidase inhibition (NAI) (d) against influenza virus A/California/04/2009 (pdmH1N1). For HAI, MN, and NAI, data are presented as individual data points plus mean values ± standard errors. For stalk antibody, data are presented as mean absorbance values ± standard errors. Statistical significance was determined using ANOVA, with vaccine strategy and mouse type as the main effects. Tukey’s test was used for post hoc comparison. Differences were considered significant at a P value of <0.05. *, P < 0.05; **, P < 0.005; ***, P < 0.0005; ****, P < 0.00005. Solid lines indicate significance within vaccine strategies, and dashed lines indicate significance between lean and obese groups.
FIG 3
FIG 3
Obesity impacts the magnitude and breadth of antibody response to influenza vaccination. Antigen microarrays were used to examine the differences in the magnitude and breadth of antibodies specific for influenza virus A(H7N9) HA (a, b) or NA (c, d) protein between lean and obese groups. Data from individual lean and obese mice (red dots) from different vaccine strategies are presented as the breadth (a, c) or magnitude (b, d) of the overall response. The top and bottom edges of the boxplots represent the 1st and 3rd data quartiles, and whiskers denote 1.5 times the interquartile range (IQR). The median response of each group is represented as a horizontal line within each boxplot. Dots represent the actual responses of individual animals. Statistical comparisons were computed using the Wilcoxon rank sum test, and adjustments for multiplicity were computed using the Bonferroni correction. Differences were considered significant at a P value of <0.05. *, P < 0.05; **, P < 0.005; ***, P < 0.0005; ****, P < 0.00005. Solid lines indicate significance within vaccine strategies, and dashed lines indicate significance between lean and obese groups.
FIG 4
FIG 4
The magnitudes and breadth of responses directly correspond to the serological data. The data for magnitude (a, b) and breadth (c, d) of antibodies specific for influenza virus A(H7N9) HA, derived from antigen microarrays (AM), were correlated with hemagglutination inhibition (HAI) (a, c) and microneutralization (MN) (b, d) data from individual mice. Associations between AM data and HAI and MN assay results were analyzed for statistical significance using Spearman’s rank-order correlation.
FIG 5
FIG 5
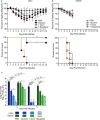
Survival, weight loss, and lung viral titers in vaccinated lean and obese mice following H7N9 virus challenge. (a, b) Three weeks postboost, lean (solid symbols) (a) and obese (open symbols) (b) mice (n = 5 or 6/type/group) were challenged with 100× MLD50 of influenza virus A/Anhui/1/2013. The mice were monitored for weight and survival daily for 14 days postinfection. Weight data are presented as mean values ± standard errors. Statistical significance was determined using ANOVA, with a P value of <0.05 deemed significant compared to the PBS controls. Survival data are presented as the percentages of animals surviving among the total number monitored. Statistical significance was determined by log rank (Mantel-Cox) test, with a P value of <0.05 deemed significant compared to the PBS control group. *, P < 0.05; **, P < 0.005. (c) Viral titers were determined in lungs from vaccinated lean (blue) and obese (green) mice at day 3 and day 5 postinfection with influenza virus A/Anhui/1/2013 (H7N9). Data are presented as mean log10 TCID50/ml ± standard error. Statistical significance was determined using ANOVA, with vaccine strategy, mouse type, and day postinfection as the main effects. Tukey’s test was used for post hoc comparison between days postinfection, mouse types, and vaccine strategies. Differences were considered significant at a P value of <0.05. *, P < 0.05; **, P < 0.005; ***, P < 0.0005; ****, P < 0.00005. Solid lines indicate significance within vaccine strategies, and dashed lines indicate significance between lean and obese groups. The dashed red line indicates the limit of detection for the assay.
FIG 6
FIG 6
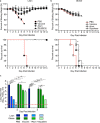
Survival, weight loss, and lung viral titers in vaccinated lean and obese mice following H1N1 virus challenge. (a, b) Three weeks postboost, lean (solid symbols) (a) and obese (open symbols) (b) mice (n = 5 or 6/type/group) were challenged with 100× MLD50 of influenza virus A/California/04/2009. Mice were monitored for weight and survival daily for 14 days postinfection. Weight data are presented as mean values ± standard errors. Statistical significance was determined using ANOVA, with a P value of <0.05 deemed significant compared to the PBS controls. Survival data are presented as the percentages of animals surviving among the total number monitored. Statistical significance was determined by log rank (Mantel-Cox) test, with a P value of <0.05 deemed significant compared to the PBS control group. *, P < 0.05; **, P < 0.005. (c) Viral titers were determined in lungs from vaccinated lean (blue) and obese (green) mice at day 3 and day 5 postinfection with influenza virus A/California/04/2009. Data are presented as the mean log10 TCID50/ml ± standard error. Statistical significance was determined using ANOVA, with vaccine strategy, mouse type, and day postinfection as the main effects. Tukey’s test was used for post hoc comparison between days postinfection, mouse types, and vaccine strategies. Differences were considered significant at a P value of <0.05. *, P < 0.05; **, P < 0.005; ***, P < 0.0005; ****, P < 0.00005. Solid lines indicate significance within vaccine strategies, and dashed lines indicate significance between lean and obese groups. The dashed red line indicates the limit of detection for the assay.
FIG 7
FIG 7
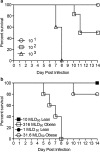
Increasing the vaccine dose does not confer protection in obese mice. (a) Obese mice were vaccinated with a 4× increased dose of vaccine and bled for serological analyses. (b) Mice were then challenged with influenza virus A/Anhui/1/2013 and monitored for survival daily for 14 days postinfection. Statistical significance was determined by log rank (Mantel-Cox) test, with a P value of <0.05 deemed significant compared to the PBS control group. *, P < 0.05. (c) Days of survival are presented as the number of days mice survived after influenza virus challenge ± standard error. Statistical significance was determined using ANOVA, with vaccine strategy and mouse type as the main effects. A P value of <0.05 compared to the PBS control group was deemed significant. *, P < 0.05; **, P < 0.005; ***, P < 0.0005; ****, P < 0.00005. Asterisks alone indicate significance compared to the PBS control group, and dashed lines indicate significance between vaccine strategies.
FIG 8
FIG 8
Survival in obese mice following passive serum transfer and H7N9 virus challenge. Sera containing equivalent antibody titers from either naive (solid symbols) or vaccine-plus-adjuvant-vaccinated (open symbols) lean (circles) or obese (squares) mice were passively transferred to 8-week-old obese mice (n = 3/group) intraperitoneally, and then the passively immunized mice were challenged with influenza virus A/Anhui/1/2013. Mice were monitored for survival daily for 14 days postinfection. Survival data are presented as the percentages of animals surviving among the total number monitored. Statistical significance was determined by the log rank (Mantel-Cox) test, with a P value of <0.05 deemed significant compared to the unvaccinated serum control group. The data shown are representative of two separate experiments.
FIG 9
FIG 9
Obese mice are more susceptible to severe influenza virus infection and not fully protected from decreased viral dose. (a) Obese mice were challenged with decreasing amounts of influenza virus A/Anhui/1/2013 (H7N9) to calculate the MLD50. (b) Three weeks after being boosted with a standard vaccine, lean (solid symbols) and obese (open symbols) mice (n = 5/type/group) were challenged with influenza virus A/Anhui/1/2013 (H7N9) at 10× MLD50 for lean mice/316× MLD50 for obese mice or 1× MLD50/31.6× MLD50 for obese mice. Survival was monitored for 14 days postinfection.

Similar articles

Cited by

References

    1. Morgan OW, Bramley A, Fowlkes A, Freedman DS, Taylor TH, Gargiullo P, Belay B, Jain S, Cox C, Kamimoto L, Fiore A, Finelli L, Olsen SJ, Fry AM. 2010. Morbid obesity as a risk factor for hospitalization and death due to 2009 pandemic influenza A(H1N1) disease. PLoS One 5:e9694. doi:10.1371/journal.pone.0009694. - DOI - PMC - PubMed
    1. Louie JK, Acosta M, Winter K, Jean C, Gavali S, Schechter R, Vugia D, Harriman K, Matyas B, Glaser CA, Samuel MC, Rosenberg J, Talarico J, Hatch D, California Pandemic (H1N1) Working Group . 2009. Factors associated with death or hospitalization due to pandemic 2009 influenza A(H1N1) infection in California. JAMA 302:1896–1902. doi:10.1001/jama.2009.1583. - DOI - PubMed
    1. Liu B, Havers F, Chen E, Yuan Z, Yuan H, Ou J, Shang M, Kang K, Liao K, Liu F, Li D, Ding H, Zhou L, Zhu W, Ding F, Zhang P, Wang X, Yao J, Xiang N, Zhou S, Liu X, Song Y, Su H, Wang R, Cai J, Cao Y, Wang X, Bai T, Wang J, Feng Z, Zhang Y, Widdowson M-A, Li Q. 2014. Risk factors for influenza A(H7N9) disease—China, 2013. Clin Infect Dis 59:787–794. doi:10.1093/cid/ciu423. - DOI - PubMed
    1. World Health Organization 2015. Obesity and overweight. Fact sheet 311. WHO, Geneva, Switzerland: Accessed 20 February 2016 http://www.who.int/mediacentre/factsheets/fs311/en/. Accessed 20 February 2015.
    1. Fiore AE, Bridges CB, Cox NJ. 2009. Seasonal influenza vaccines. Curr Top Microbiol Immunol 333:43–82. doi:10.1007/978-3-540-92165-3_3. - DOI - PubMed

MeSH terms

LinkOut - more resources