Intratumoral oxygen gradients mediate sarcoma cell invasion
- PMID: 27486245
- PMCID: PMC4995943
- DOI: 10.1073/pnas.1605317113
Intratumoral oxygen gradients mediate sarcoma cell invasion
Abstract
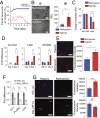
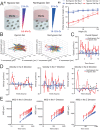
Hypoxia is a critical factor in the progression and metastasis of many cancers, including soft tissue sarcomas. Frequently, oxygen (O2) gradients develop in tumors as they grow beyond their vascular supply, leading to heterogeneous areas of O2 depletion. Here, we report the impact of hypoxic O2 gradients on sarcoma cell invasion and migration. O2 gradient measurements showed that large sarcoma mouse tumors (>300 mm(3)) contain a severely hypoxic core [≤0.1% partial pressure of O2 (pO2)] whereas smaller tumors possessed hypoxic gradients throughout the tumor mass (0.1-6% pO2). To analyze tumor invasion, we used O2-controllable hydrogels to recreate the physiopathological O2 levels in vitro. Small tumor grafts encapsulated in the hydrogels revealed increased invasion that was both faster and extended over a longer distance in the hypoxic hydrogels compared with nonhypoxic hydrogels. To model the effect of the O2 gradient accurately, we examined individual sarcoma cells embedded in the O2-controllable hydrogel. We observed that hypoxic gradients guide sarcoma cell motility and matrix remodeling through hypoxia-inducible factor-1α (HIF-1α) activation. We further found that in the hypoxic gradient, individual cells migrate more quickly, across longer distances, and in the direction of increasing O2 tension. Treatment with minoxidil, an inhibitor of hypoxia-induced sarcoma metastasis, abrogated cell migration and matrix remodeling in the hypoxic gradient. Overall, we show that O2 acts as a 3D physicotactic agent during sarcoma tumor invasion and propose the O2-controllable hydrogels as a predictive system to study early stages of the metastatic process and therapeutic targets.
Keywords: gradients; hydrogel; hypoxia; migration; sarcoma.
Conflict of interest statement
The authors declare no conflict of interest.
Figures


Similar articles
-
O2-controllable hydrogels for studying cellular responses to hypoxic gradients in three dimensions in vitro and in vivo.Nat Protoc. 2017 Aug;12(8):1620-1638. doi: 10.1038/nprot.2017.059. Epub 2017 Jul 20. Nat Protoc. 2017. PMID: 28726849 Free PMC article.
-
A Feedback Loop between Hypoxia and Matrix Stress Relaxation Increases Oxygen-Axis Migration and Metastasis in Sarcoma.Cancer Res. 2019 Apr 15;79(8):1981-1995. doi: 10.1158/0008-5472.CAN-18-1984. Epub 2019 Feb 18. Cancer Res. 2019. PMID: 30777851 Free PMC article.
-
Hypoxia-dependent modification of collagen networks promotes sarcoma metastasis.Cancer Discov. 2013 Oct;3(10):1190-205. doi: 10.1158/2159-8290.CD-13-0118. Epub 2013 Aug 1. Cancer Discov. 2013. PMID: 23906982 Free PMC article.
-
Detection of Hypoxia in Cancer Models: Significance, Challenges, and Advances.Cells. 2022 Feb 16;11(4):686. doi: 10.3390/cells11040686. Cells. 2022. PMID: 35203334 Free PMC article. Review.
-
Oxygen gradients in tumor tissues implications for breast cancer metastasis - a narrative review.Ann Med Surg (Lond). 2025 May 12;87(6):3372-3380. doi: 10.1097/MS9.0000000000003121. eCollection 2025 Jun. Ann Med Surg (Lond). 2025. PMID: 40486631 Free PMC article. Review.
Cited by
-
Immunometabolism in early and late stages of rheumatoid arthritis.Nat Rev Rheumatol. 2017 May;13(5):291-301. doi: 10.1038/nrrheum.2017.49. Epub 2017 Mar 31. Nat Rev Rheumatol. 2017. PMID: 28360422 Free PMC article. Review.
-
Oxygen-controllable injectable hydrogel alleviates intervertebral disc degeneration by balancing extracellular matrix metabolism.Mater Today Bio. 2024 Sep 14;29:101252. doi: 10.1016/j.mtbio.2024.101252. eCollection 2024 Dec. Mater Today Bio. 2024. PMID: 39624048 Free PMC article.
-
Measuring hypoxia in chronic limb-threatening ischemia using 18F-FAZA kinetic modelling - a pilot study.EJNMMI Res. 2025 Apr 26;15(1):48. doi: 10.1186/s13550-025-01243-5. EJNMMI Res. 2025. PMID: 40287606 Free PMC article.
-
A persistent invasive phenotype in post-hypoxic tumor cells is revealed by fate mapping and computational modeling.iScience. 2021 Aug 4;24(9):102935. doi: 10.1016/j.isci.2021.102935. eCollection 2021 Sep 24. iScience. 2021. PMID: 34568781 Free PMC article.
-
Developing Cures: Targeting Ontogenesis in Cancer.Trends Cancer. 2017 Feb;3(2):126-136. doi: 10.1016/j.trecan.2016.12.007. Epub 2017 Jan 27. Trends Cancer. 2017. PMID: 28718443 Free PMC article. Review.
References
-
- Yoon SS, et al. Angiogenic profile of soft tissue sarcomas based on analysis of circulating factors and microarray gene expression. J Surg Res. 2006;135(2):282–290. - PubMed
-
- Singer S, Demetri GD, Baldini EH, Fletcher CD. Management of soft-tissue sarcomas: An overview and update. Lancet Oncol. 2000;1:75–85. - PubMed
-
- Jemal A, Siegel R, Xu J, Ward E. Cancer statistics, 2010. CA Cancer J Clin. 2010;60(5):277–300. - PubMed
-
- Wasif N, et al. Influence of specialty and clinical experience on treatment sequencing in the multimodal management of soft tissue extremity sarcoma. Ann Surg Oncol. 2012;19(2):504–510. - PubMed
-
- Italiano A, et al. Trends in survival for patients with metastatic soft-tissue sarcoma. Cancer. 2011;117(5):1049–1054. - PubMed
Publication types
MeSH terms
Substances
Grants and funding
LinkOut - more resources
Full Text Sources
Other Literature Sources
Medical

