. 2016 Aug 23;113(34):9545-50.
doi: 10.1073/pnas.1610259113. Epub 2016 Aug 2.

Erasure of DNA methylation, genomic imprints, and epimutations in a primordial germ-cell model derived from mouse pluripotent stem cells

Affiliations

Erasure of DNA methylation, genomic imprints, and epimutations in a primordial germ-cell model derived from mouse pluripotent stem cells

Norikatsu Miyoshi et al. Proc Natl Acad Sci U S A. .

Erratum in

Abstract

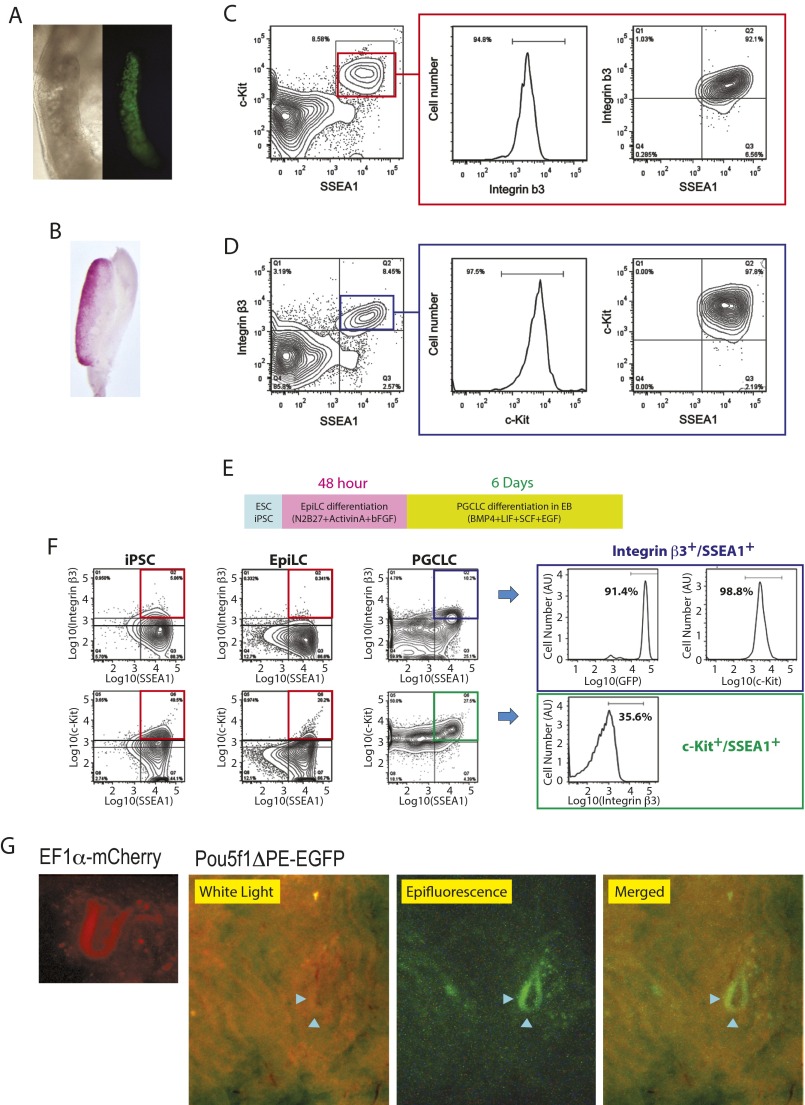
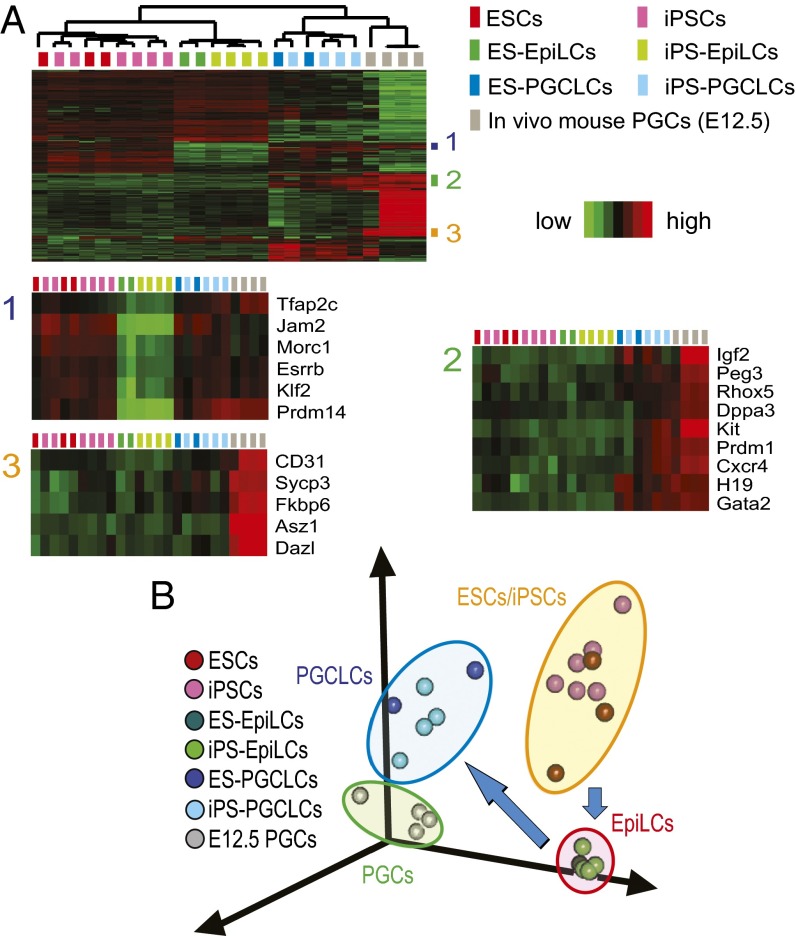
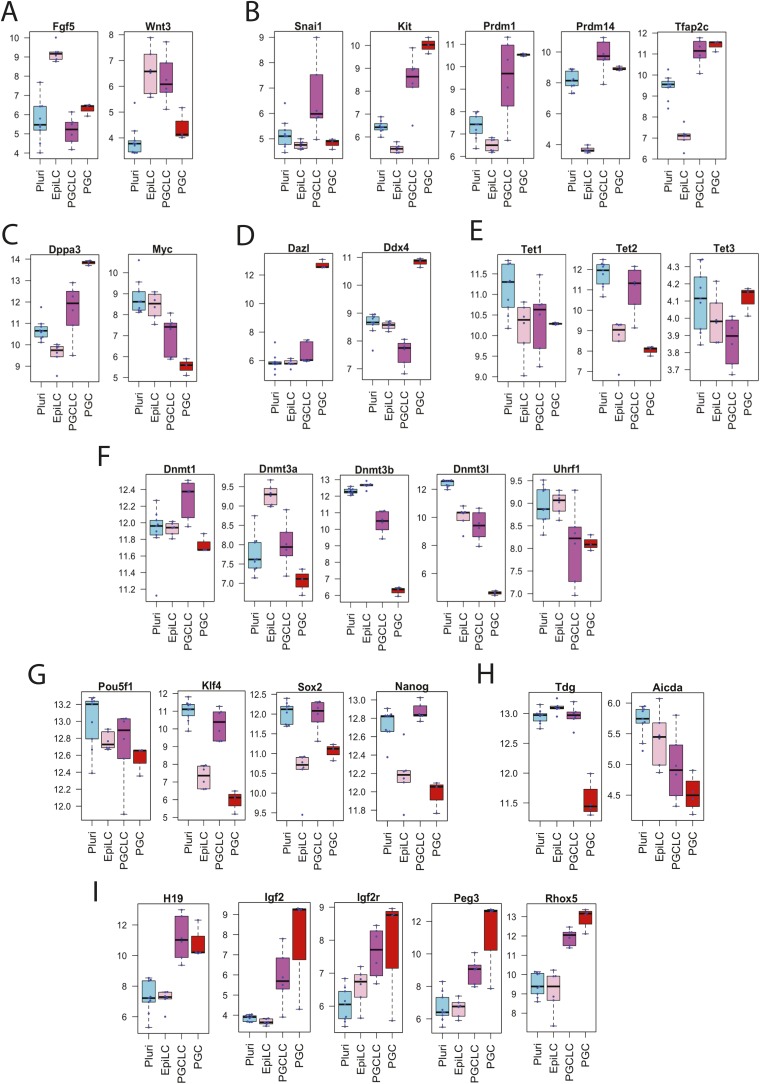
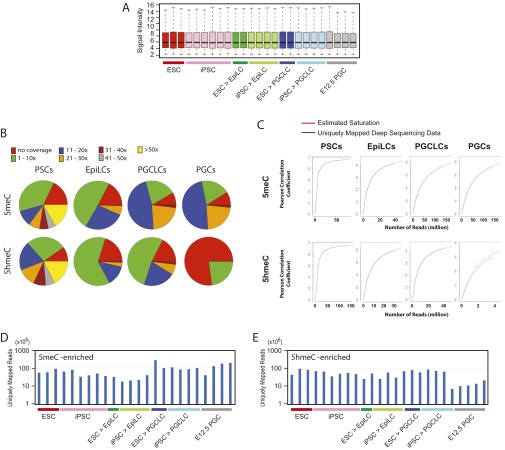
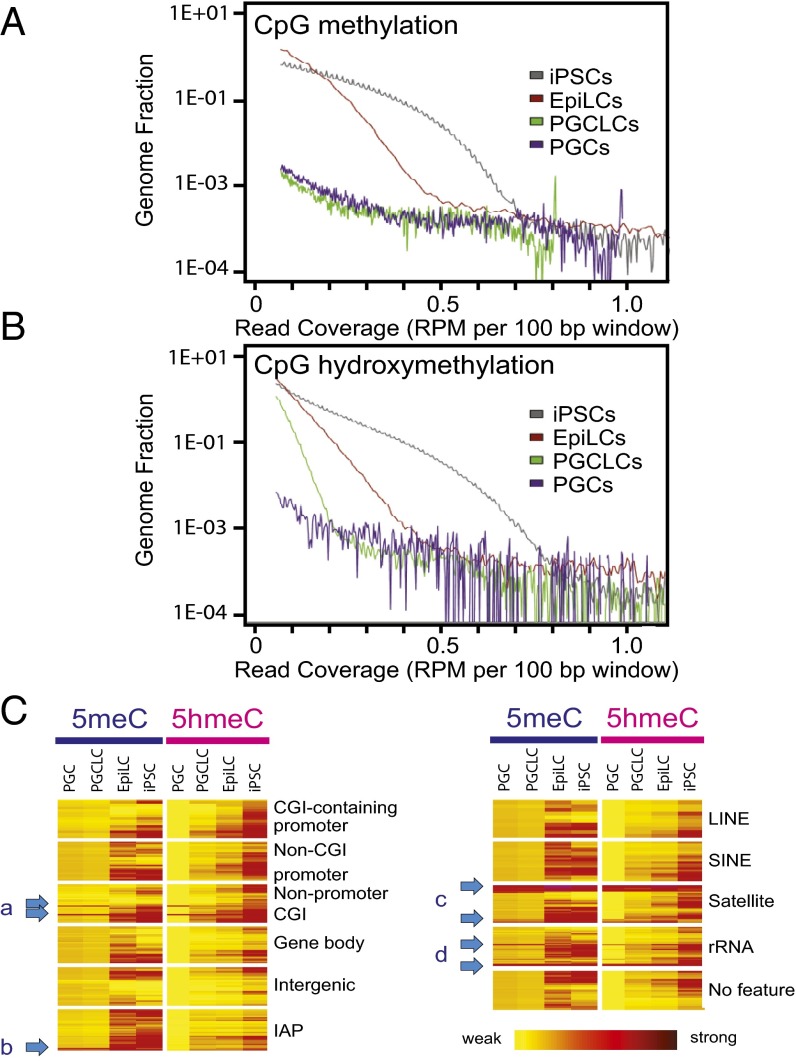
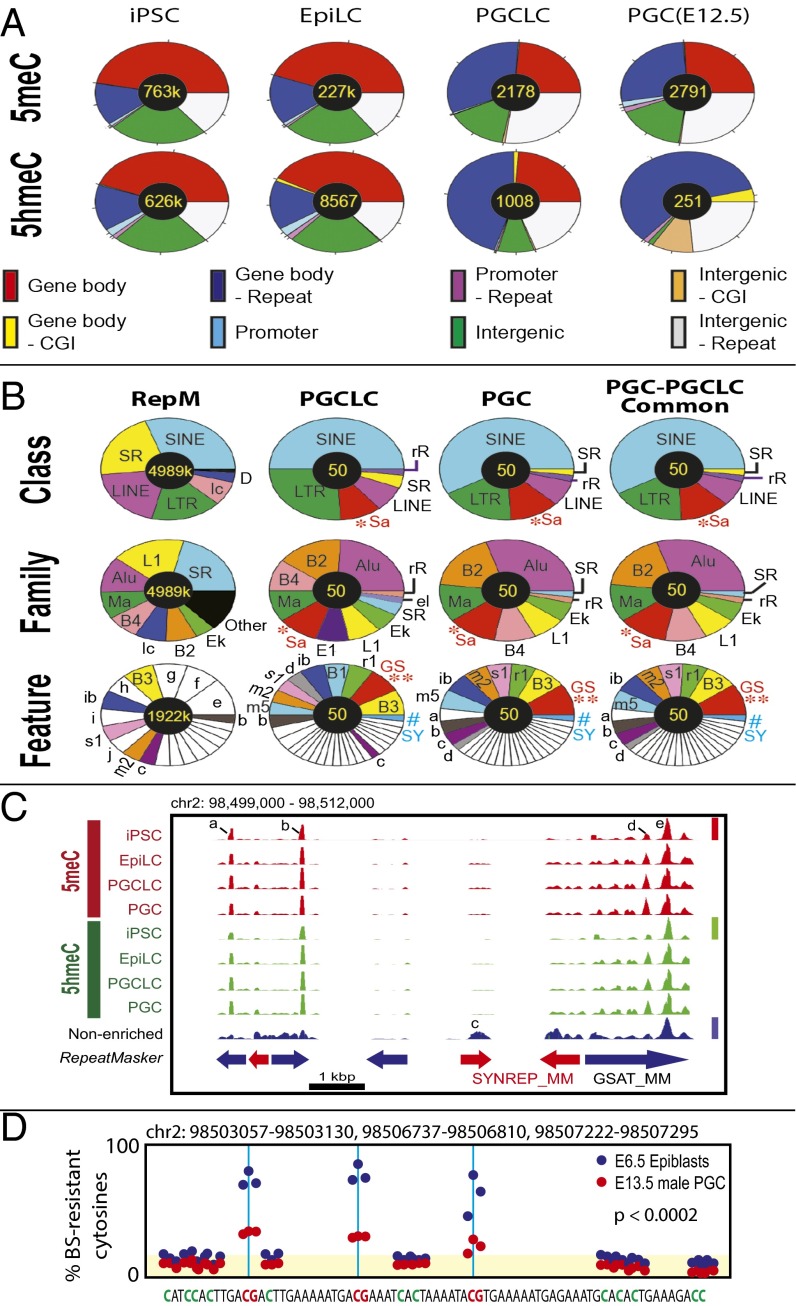
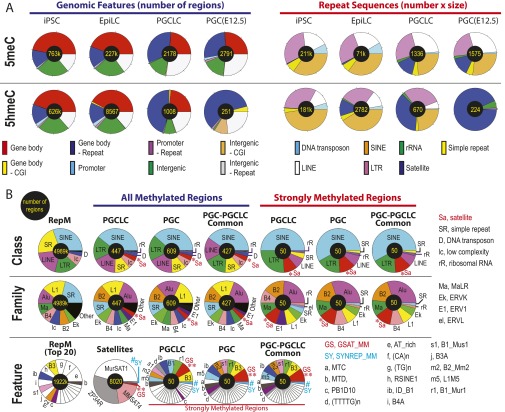
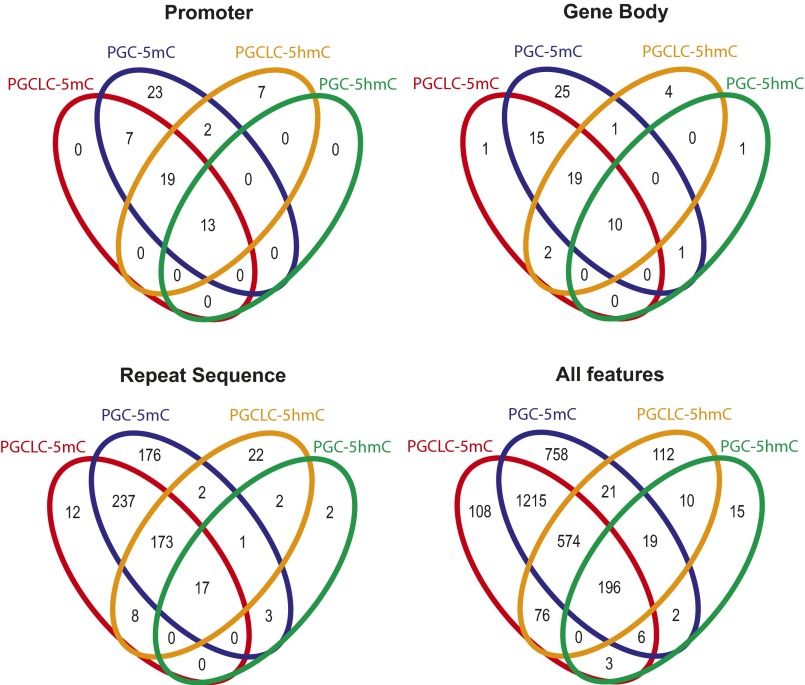
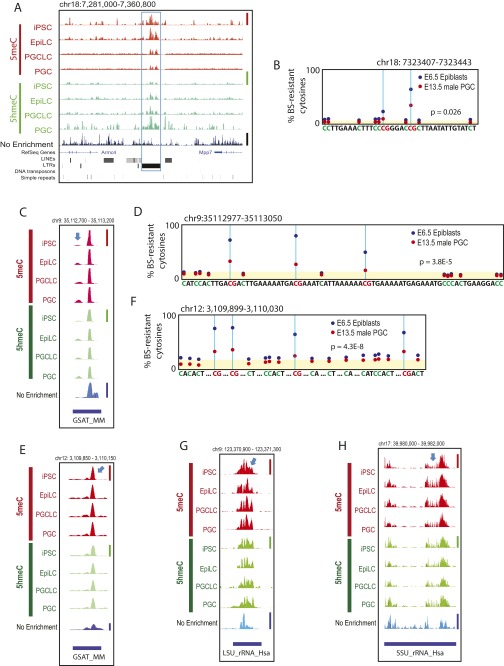
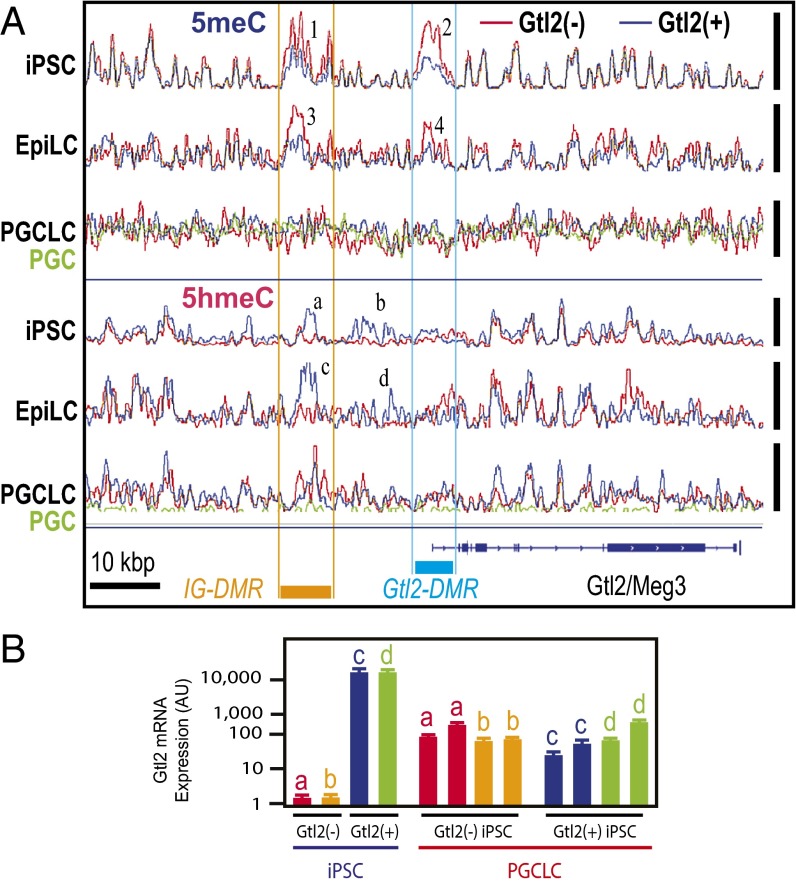
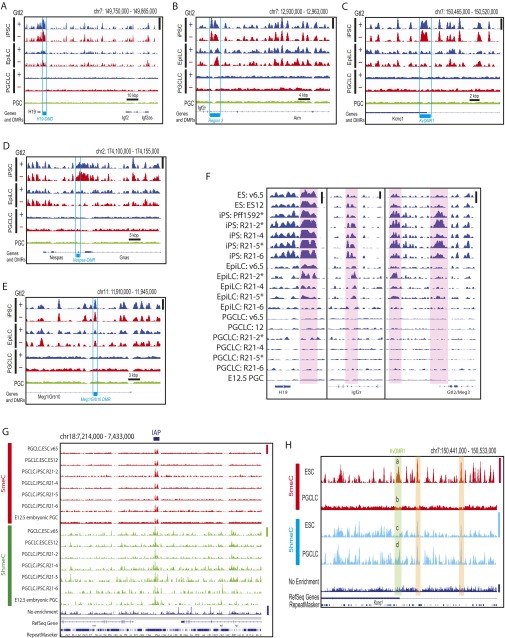
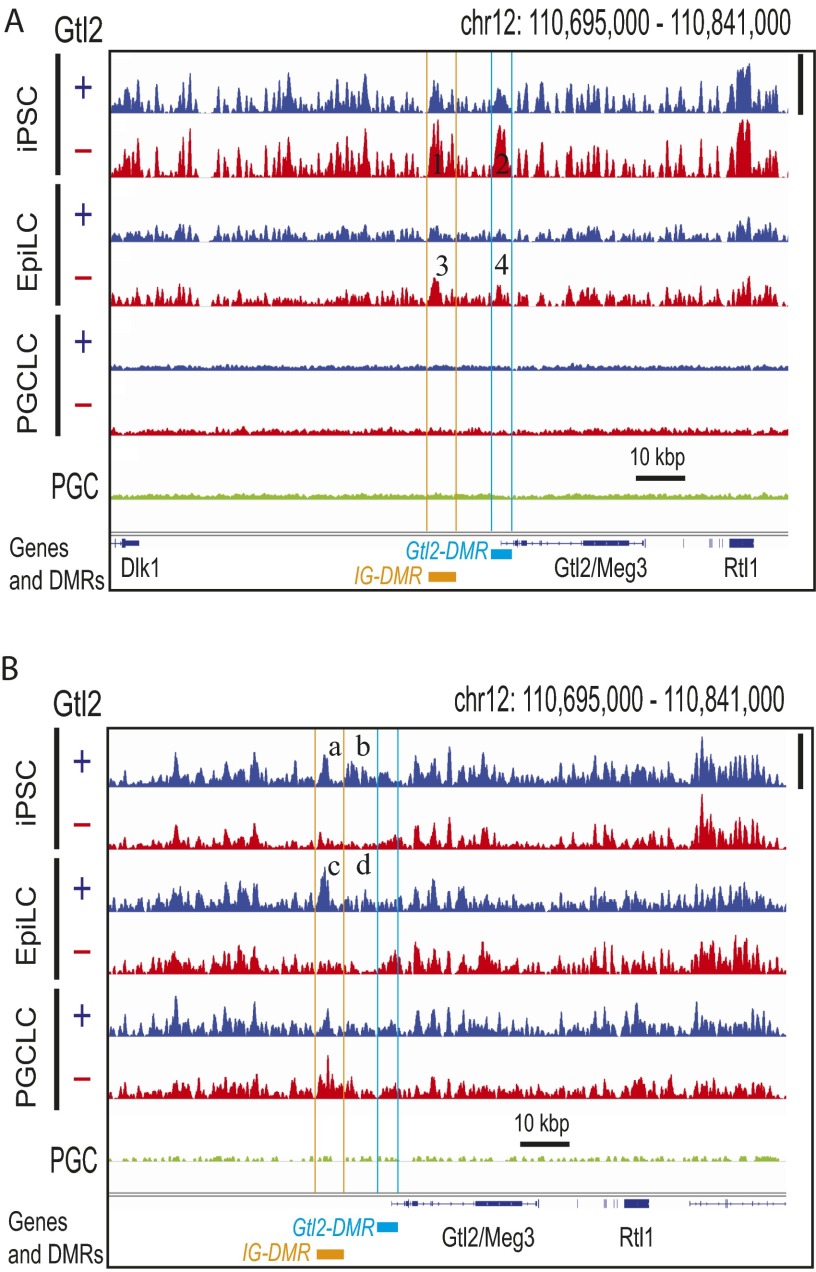
The genome-wide depletion of 5-methylcytosines (5meCs) caused by passive dilution through DNA synthesis without daughter strand methylation and active enzymatic processes resulting in replacement of 5meCs with unmethylated cytosines is a hallmark of primordial germ cells (PGCs). Although recent studies have shown that in vitro differentiation of pluripotent stem cells (PSCs) to PGC-like cells (PGCLCs) mimics the in vivo differentiation of epiblast cells to PGCs, how DNA methylation status of PGCLCs resembles the dynamics of 5meC erasure in embryonic PGCs remains controversial. Here, by differential detection of genome-wide 5meC and 5-hydroxymethylcytosine (5hmeC) distributions by deep sequencing, we show that PGCLCs derived from mouse PSCs recapitulated the process of genome-wide DNA demethylation in embryonic PGCs, including significant demethylation of imprint control regions (ICRs) associated with increased mRNA expression of the corresponding imprinted genes. Although 5hmeCs were also significantly diminished in PGCLCs, they retained greater amounts of 5hmeCs than intragonadal PGCs. The genomes of both PGCLCs and PGCs selectively retained both 5meCs and 5hmeCs at a small number of repeat sequences such as GSAT_MM, of which the significant retention of bisulfite-resistant cytosines was corroborated by reanalysis of previously published whole-genome bisulfite sequencing data for intragonadal PGCs. PSCs harboring abnormal hypermethylation at ICRs of the Dlk1-Gtl2-Dio3 imprinting cluster diminished these 5meCs upon differentiation to PGCLCs, resulting in transcriptional reactivation of the Gtl2 gene. These observations support the usefulness of PGCLCs in studying the germline epigenetic erasure including imprinted genes, epimutations, and erasure-resistant loci, which may be involved in transgenerational epigenetic inheritance.

Keywords: PGCLC; epigenetic reprogramming; epimutation; genetic imprinting.


Conflict of interest statement

The authors declare no conflict of interest.

Figures

Fig. S1.
Fig. S1.
Characterization of PGCs and PGCLCs. (A–D) PGC isolation from E12.5 fetal male mouse gonads. (A) Microscopic images of PGCs expressing EGFP driven by the Pou5f1 promoter/distal enhancer (Left, phase contrast; Right, fluorescence). (B) Alkaline phosphatase staining of intragonadal PGCs. (C and D) FACS profiling of PGCs for cell-surface expression of SSEA1, Integrin β3, and c-Kit. (C) Expression of Integrin β3 in SSEA1+/c-Kit+ PGCs. (D) Expression of c-Kit in SSEA1+/Integrin β3+ PGCs. (E–G) PGCLC production from mouse PSCs. (E) Overall protocol. PSCs were first differentiated to EpiLCs as adherent cell culture for 48 h and then to PGCLCs in EBs for 6 d. (F) FACS profiling of mouse iPSCs, EpiLCs, and PGCLCs for expression of SSEA1, Integrin β3, and c-Kit. iPSCs express EGFP driven by the germline-active Pou5f1 distal enhancer/promoter. Boxes on the Right show expression of EGFP and c-Kit in Integrin β3+/SSEA1+ PGCLCs (Top) and Integrin β3 expression in c-Kit+/SSEA1+ PGCLCs (Bottom). (G) Colonization of PGCLCs in mouse testes. Mouse PGCLCs were labeled with germline-active human EF1α promoter (mCherry) or Pou5f1 distal enhancer/promoter (Pou5f1ΔPE-EGFP). The white light image shows seminiferous tubules, and the epifluorescence image shows an EGFP-positive segment of the tubules (pointed by arrowheads).
Fig. 1.
Fig. 1.
Transcriptomes of mouse PSCs, EpiLCs, PGCLCs, and in vivo PGCs. (A) Hierarchical clustering heatmap of differentially expressed genes. EpiLCs and PGCLCs are indicated with their precursor PSCs (e.g., ES-EpiLCs are EpiLCs derived from ESCs). The three gene clusters indicated in the Top heatmap are enlarged in the Bottom heatmaps. (B) PCA of transcriptomal changes during differentiation of PSCs to PGCLCs via EpiLCs.
Fig. S2.
Fig. S2.
mRNA expression of marker genes in mouse PSCs, EpiLCs, PGCLCs, and E12.5 in vivo PGCs. Box plots represent median, first and third quartile, and 95% confidence intervals of mRNA expression (normalized intensity values) determined using Affymetrix microarray (n > 3). (A) Epiblast markers. (B–D) PGC markers for (B) early, (C) mid, and (D) late stages. (E) Tet enzymes. (F) DNA methyltransferases and the Uhrf1 cofactor of DNMT1. (G) Pluripotency genes. (H) Enzymes involved in active demethylation of DNA. (I) Imprinted genes.
Fig. S3.
Fig. S3.
Microarray and deep-sequencing quality control data. (A) RMA-normalized signal intensities of Affymetrix microarray data shown in Fig. 1. Box plots are shown with the same color codes as in Fig. 1. The evenly distributed signal intensities across samples do not show signs of batch effects. The degrees of transcriptomal heterogeneity shown in the PCA analysis (Fig. 1B) are not directly explained by different intensities of normalized microarray data. (B) Coverage of CpG sites in the mouse mm9 reference genome sequences by deep-sequencing data for DNA methylation and hydroxymethylation (the seqCoverage function of the MEDIPS Bioconductor package). (C) Saturation analysis of deep-sequencing data (the saturation function of MEDIPS). Sufficient CpG coverage and saturation by deep-sequencing reads ensures appropriate interrogation of DNA methylation and hydroxymethylation. Note that strong CpG coverage and saturation do not immediately result in detection of DNA methylation and hydroxymethylation, which are dependent on formation of peaks over the background. The low CpG coverage or saturation of deep-sequencing reads for DNA hydroxymethylation in PGCs was due to the strong depletion of 5hmerCs in this type of cells. (D and E) Numbers of uniquely mapped deep-sequencing reads obtained for different types of cells for (D) DNA methylation and (E) DNA hydroxymethylation.
Fig. S4.
Fig. S4.
Distributions of aligned deep-sequencing quality scores along the read positions for (A) DNA methylation and (B) DNA hydroxymethylation (outputs of the FastQC quality control tool). The dark green areas were automatically truncated by the analytical software.
Fig. 2.
Fig. 2.
Global reduction in gDNA 5meCs and 5hmeCs during mouse iPSC differentiation to PGCLCs. (A and B) Density distributions of (A) 5meCs and (B) 5hmeCs. The x axes represent densities of 5meCs or 5hmeCs in 100-bp windows, and the y axes indicate genome-wide frequencies. (C) Heatmaps of 5meC and 5hmeC densities across genomic features. Arrows a-d point to elements retaining 5meCs and/or 5hmeCs in PGCLCs/PGCs.
Fig. 3.
Fig. 3.
Genomic feature distributions of 5meCs and 5hmeCs in the genomic DNA of mouse iPSCs, EpiLCs, PGCLCs, and in vivo PGCs. (A) 5meC and 5hmeC distributions across genomic features. (B) Distributions of 5meCs across repeat sequences. RepM, genome-wide RepeatMasker-registered elements. Small elements (<5%) are left blank in pie charts. *Sa, satellite repeats; **GS, GSAT_MM; #SY, SYNREP_MM. Other keys of pie charts are defined in Fig. S5. (C) An example of deep-sequencing tracks showing 5meC and 5hmeC peaks at GSAT_MM and SYNREP_MM satellite repeats. Height of peaks reflects relative strength of DNA methylation across the four 5meC tracks (linearly scaled 0–1 between the baseline and the maximal methylation, red bar), DNA hydroxymethylation (four 5hmeC tracks, green bar), or nonenriched genome resequencing (blue bar); note that scaled value 1 is not equal to 100% methylation. Peaks a, b, and d are “informative” based on their enrichment over the nonenriched mouse genome resequencing track or changes between different types of cells. Peaks c and e are present in the nonenriched track and so are uninformative. (D) Reanalysis of the whole-genome bisulfite sequencing data generated by Seisenberger et al. (9) for a 74-nt sequence repeated three times in the GSAT_MM regions shown in C. Blue and red dots show percentage of bisulfite-resistant cytosines in E6.5 epiblasts and E13.5 PGCs, respectively. Yellow shade indicates the background levels of bisulfite-resistant cytosines in CpA, CpT, and CpC dinucleotides. The P values represent statistical significance between the CpG-context bisulfite-resistant cytosines over the background (t test).
Fig. S5.
Fig. S5.
Distributions of 5meCs and 5hmeCs across genomic features in mouse PSCs, PGCLCs, and in vivo PGCs. Numbers of total features are shown at the center of each pie chart. (A) 5meC and 5hmeC distributions in all genomic features (Left; reflecting numbers of regions only) and in repeat sequences (Right; reflecting products of numbers and sizes of regions). (B) Detailed distributions of 5meC in repeat sequences based on numbers of regions. RepM, profiles of the entire RpeatMasker elements. RepeatMasker features are integrated into families, which are further integrated into classes. Some of the small RepeatMasker features (<5%) are shown as blanks without labels.
Fig. S6.
Fig. S6.
Venn diagrams representing overlapping locations of 5meCs and 5hmeCs between mouse PGCLCs and in vivo PGCs at distinct genomic features.
Fig. S7.
Fig. S7.
Examples of 5meC and 5hmeC retention in PGCLCs and PGCs. A, C, E, G, and H show deep-sequencing tracks at (A) an IAP, (C and E) GSAT_MM, (G) LSU_rRNA_Hsa, and (H) SSU_rRNA_Hsa. Informative peaks are indicated by blue arrows. Height of peaks reflects relative strength of DNA methylation across the four 5meC tracks (linearly scaled 0–1 between the baseline and the maximal methylation in the displayed area indicated by a red vertical bar at the right), DNA hydroxymethylation (four 5hmeC tracks, green vertical bar), or nonenriched genome resequencing coverage (nonenriched track, blue vertical bar); note that scaled value 1 is not equal to 100% methylation. (B, D, and F) Reanalysis of the whole-genome bisulfite sequencing data generated by Seisenberger et al. (9) for E6.5 mouse epiblasts and E13.5 male PGCs corresponding to sequencres shown in A, C, and E, respectively. Yellow shading indicates the background levels of bisulfite-resistant cytosines in CpA, CpT, and CpC dinucleotides. The P values represent statistical significance between the CpG-context bisulfite-resistant cytosines over the background (t test).
Fig. 4.
Fig. 4.
Erasure of DNA hypermethylation at the IG-DMR and Gtl2-DMR of Gtl2(−) iPSCs during differentiation to PGCLCs. (A) Superimposed deep-sequencing tracks of 5meCs (Top three tracks) and 5hmeCs (Bottom three tracks). Blue, red, and green traces represent Gtl2(+), Gtl2(−), and in vivo PGC, respectively, and all traces in each track are adjusted in a track-specific linear scale between the minimal and maximal methylation or hydroxymethylation in the displayed area shown with vertical bars at the right. The same data are displayed with fixed scales across tracks in Fig. S9. Orange and cyan bars indicate locations of IG-DMR and Gtl2-DMR, respectively. Numbers 1–4 show differential methylation between Gtl2(+) and Gtl2(−) iPSCs and EpiLCs at the DMRs. (a–d) Differential hydroxymethylation. (B) Expression of Gtl2 mRNA in independent clones of mouse Gtl2(−) iPSCs (a and b), Gtl2(+) iPSCs (c and d), and PGCLCs produced from them. Bars indicate qPCR data for Gtl2 mRNA expression normalized with Gapdh mRNA expression (n = 3, mean ± SEM).
Fig. S8.
Fig. S8.
Demethylation at the ICRs in PGCLCs. Deep-sequencing tracks of 5meCs at the ICRs in the genomes of Gtl2(+) and Gtl2(−) mouse iPS cells and their EpiLC and PGCLC derivatives are shown. (A) Igf2-H19, (B) Igf2r, (C) Kcnq1, (D) Gnas, and (E) Meg1/Grb10. (F) 5meC deep-sequencing tracks of the individual cell clones at the H19, Igf2r, and Gtl2/Meg3 ICRs (shaded in red). Asterisks indicate the Gtl2(×) iPSC clones, which show abnormal hypermethylation of the Gtl2/Meg3 ICRs, and their derivatives. Height of peaks in A–F reflects relative strength of DNA methylation across all of the tracks in each panel (or each subpanel of F), linearly scaled between the baseline and the maximal methylation in the displayed area shown with vertical bars at right. (G) Retention of DNA methylation and hydroxymethylation at an IAP location in PGCLCs and PGCs. Height of peaks reflects relative strength of DNA methylation across the seven 5meC tracks (linearly scaled between the baseline and the maximal methylation in the displayed area indicated with red vertical bar at right), seven DNA hydroxymethylation (5hmeC tracks, green vertical bar), or nonenriched genome resequencing coverage (Nonenriched track, blue vertical bar). IAP location is shown by horizontal bar at the top. (H) DNA methylation and hydroxymethylation profiles of the v6.5 mouse ESCs and their PGCLC derivatives at the ICR of the Kcnq1 imprinting cluster. Height of peaks reflects relative strength of DNA methylation across the two 5meC tracks (linearly scaled between the baseline and the maximal methylation in the displayed area indicated with red vertical bar at right), two 5hmeC tracks (cyan bar), or nonenriched genome resequencing track (blue bar). The ICR (KvDMR1) is shown with green shading, in which strong DNA methylation in the ESCs (a) was lost in PGCLCs (b) whereas DNA hydroxymethylation was enhanced upon ESC differentiation to PGCLC (compare peaks c and d). Two regions shaded with orange show loss of DNA methylation upon ESC differentiation to PGCLC without significant changes in DNA hydroxymethylation.
Fig. S9.
Fig. S9.
Erasure of DNA hypermethylation at the IG-DMR and Gtl2-DMR of Gtl2(−) iPSCs during differentiation to PGCLCs. Deep-sequencing tracks of 5meCs (A) and 5hmeCs (B) in the genomes of Gtl2(+) and Gtl2(−) mouse iPS cells and their EpiLC and PGCLC derivatives are shown. Height of peaks reflects relative strength of DNA methylation (A) or hydroxymethylation (B) across all seven tracks in each panel, linearly scaled between the baseline and the maximal methylation in the displayed area shown with vertical bars at right. Orange and cyan lines indicate locations of IG-DMR and Gtl2-DMR, respectively. Numbers 1–4 show differential methylation between Gtl2(+) and Gtl2(−) iPSCs and EpiLCs at the DMRs. (a–d) Differential hydroxymethylation. Note that regions b and d locate between the two DMRs.

Similar articles

Cited by

References

    1. Prokopuk L, Western PS, Stringer JM. Transgenerational epigenetic inheritance: Adaptation through the germline epigenome? Epigenomics. 2015;7(5):829–846. - PubMed
    1. Szyf M. Nongenetic inheritance and transgenerational epigenetics. Trends Mol Med. 2015;21(2):134–144. - PubMed
    1. Alvarado S, et al. An epigenetic hypothesis for the genomic memory of pain. Front Cell Neurosci. 2015;9:88. - PMC - PubMed
    1. Nilsson EE, Skinner MK. Environmentally induced epigenetic transgenerational inheritance of reproductive disease. Biol Reprod. 2015;93(6):145. - PMC - PubMed
    1. Bohacek J, Mansuy IM. Molecular insights into transgenerational non-genetic inheritance of acquired behaviours. Nat Rev Genet. 2015;16(11):641–652. - PubMed

Publication types

MeSH terms