

Human serum albumin homeostasis: a new look at the roles of synthesis, catabolism, renal and gastrointestinal excretion, and the clinical value of serum albumin measurements
- PMID: 27486341
- PMCID: PMC4956071
- DOI: 10.2147/IJGM.S102819
Human serum albumin homeostasis: a new look at the roles of synthesis, catabolism, renal and gastrointestinal excretion, and the clinical value of serum albumin measurements
Abstract
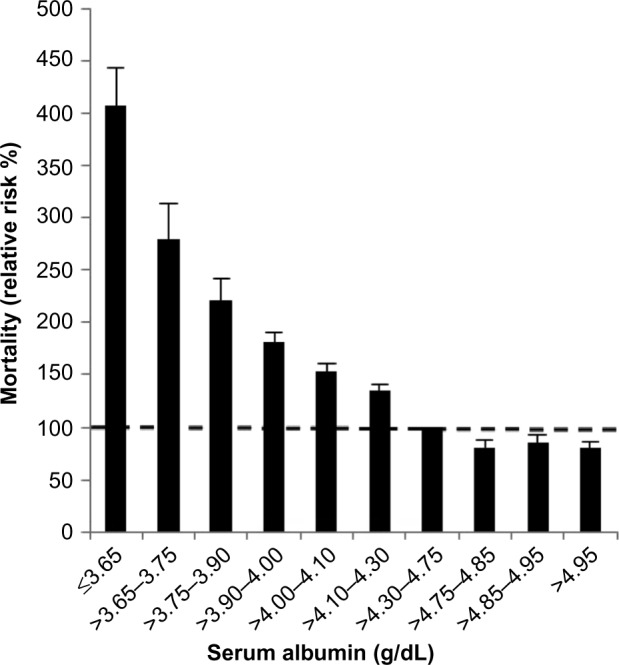
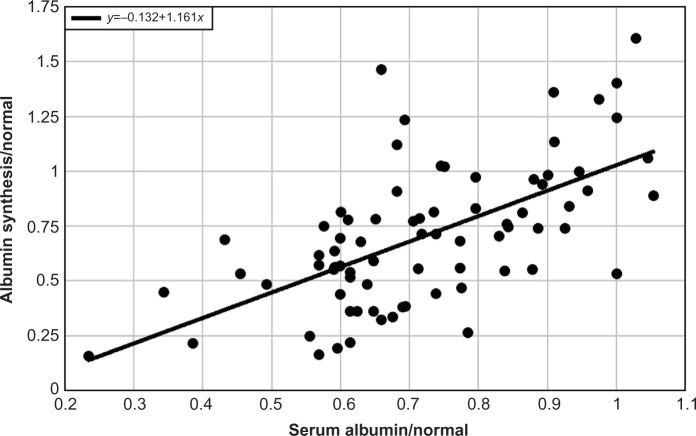
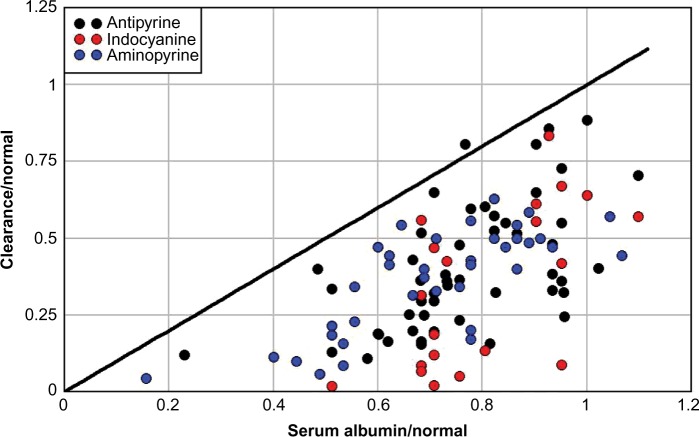
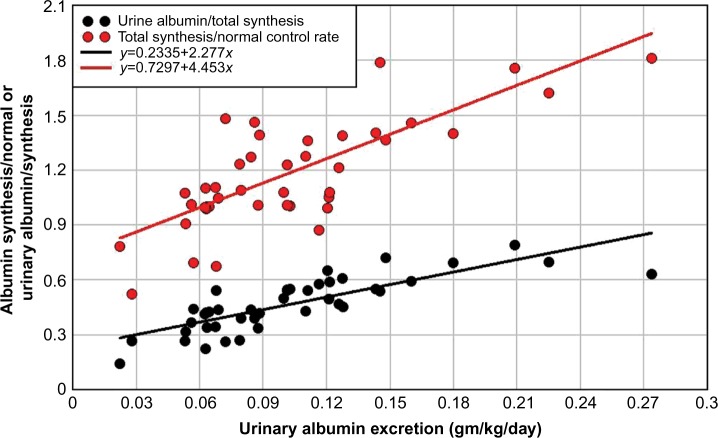
Serum albumin concentration (CP) is a remarkably strong prognostic indicator of morbidity and mortality in both sick and seemingly healthy subjects. Surprisingly, the specifics of the pathophysiology underlying the relationship between CP and ill-health are poorly understood. This review provides a summary that is not previously available in the literature, concerning how synthesis, catabolism, and renal and gastrointestinal clearance of albumin interact to bring about albumin homeostasis, with a focus on the clinical factors that influence this homeostasis. In normal humans, the albumin turnover time of about 25 days reflects a liver albumin synthesis rate of about 10.5 g/day balanced by renal (≈6%), gastrointestinal (≈10%), and catabolic (≈84%) clearances. The acute development of hypoalbuminemia with sepsis or trauma results from increased albumin capillary permeability leading to redistribution of albumin from the vascular to interstitial space. The best understood mechanism of chronic hypoalbuminemia is the decreased albumin synthesis observed in liver disease. Decreased albumin production also accounts for hypoalbuminemia observed with a low-protein and normal caloric diet. However, a calorie- and protein-deficient diet does not reduce albumin synthesis and is not associated with hypoalbuminemia, and CP is not a useful marker of malnutrition. In most disease states other than liver disease, albumin synthesis is normal or increased, and hypoalbuminemia reflects an enhanced rate of albumin turnover resulting either from an increased rate of catabolism (a poorly understood phenomenon) or enhanced loss of albumin into the urine (nephrosis) or intestine (protein-losing enteropathy). The latter may occur with subtle intestinal pathology and hence may be more prevalent than commonly appreciated. Clinically, reduced CP appears to be a result rather than a cause of ill-health, and therapy designed to increase CP has limited benefit. The ubiquitous occurrence of hypoalbuminemia in disease states limits the diagnostic utility of the CP measurement.
Keywords: albumin; cirrhosis; clearance; enteropathy; malnutrition; nephrosis; synthesis.
Figures
References
-
- Takeda Y, Reeve EB. Studies of the metabolism and distribution of albumin with autologous I131-albumin in healthy men. J Lab Clin Med. 1963;61:183–202. - PubMed
-
- Meier P, Zierler KL. On the theory of the indicator-dilution method for measurement of blood flow and volume. J Appl Physiol. 1954;6(12):731–744. - PubMed
-
- Nakashima E, Benet LZ. An integrated approach to pharmacokinetic analysis for linear mammillary systems in which input and exit may occur in/from any compartment. J Pharmacokinet Biopharm. 1989;17(6):673–686. - PubMed
-
- Ballmer PE, McNurlan MA, Milne E, Heys SD, Buchan V, Calder AG, Garlick PJ. Measurement of albumin synthesis in humans: a new approach employing stable isotopes. Am J Physiol. 1990;259(6 Pt 1):E797–E803. - PubMed
Publication types
LinkOut - more resources
Full Text Sources
Other Literature Sources
Medical
Miscellaneous
