. 2016 Jul 19:7:1027.
doi: 10.3389/fpls.2016.01027. eCollection 2016.

Remodeling of Leaf Cellular Glycerolipid Composition under Drought and Re-hydration Conditions in Grasses from the Lolium-Festuca Complex

Affiliations

Remodeling of Leaf Cellular Glycerolipid Composition under Drought and Re-hydration Conditions in Grasses from the Lolium-Festuca Complex

Dawid Perlikowski et al. Front Plant Sci. .

Abstract

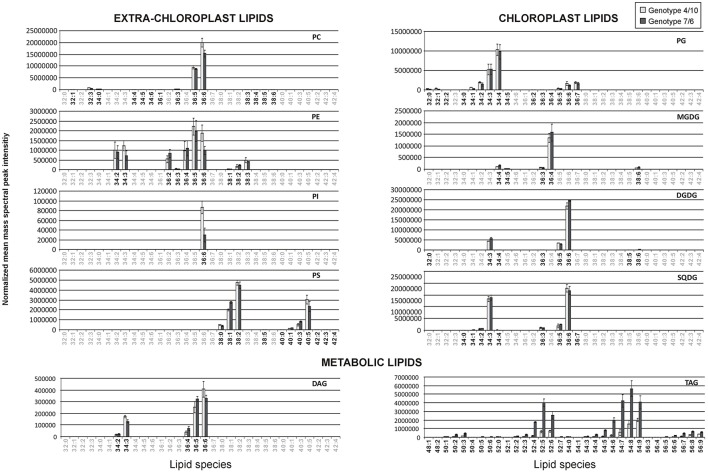
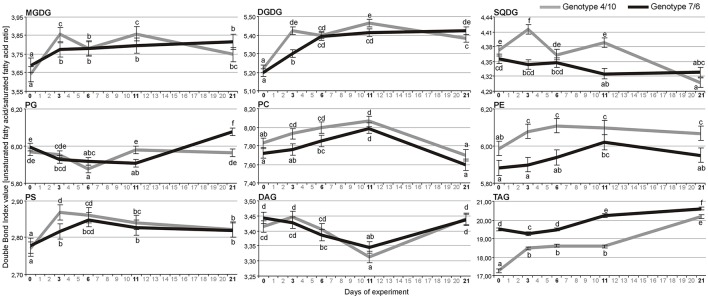
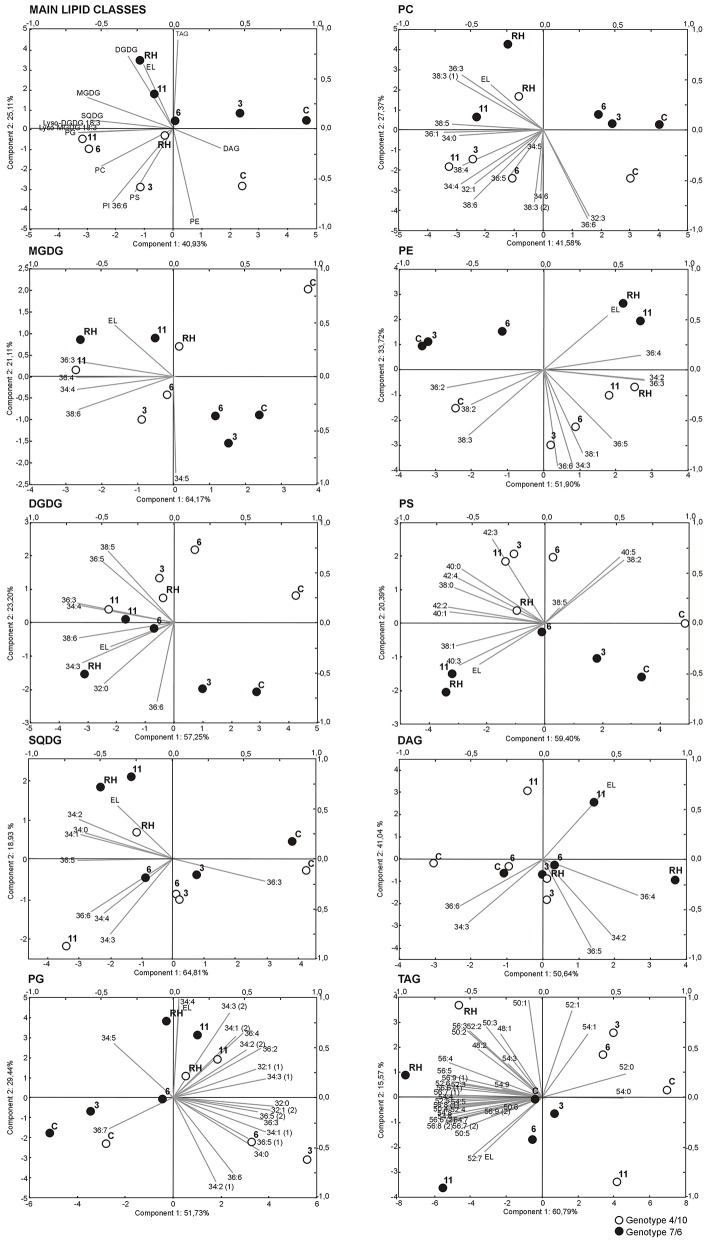
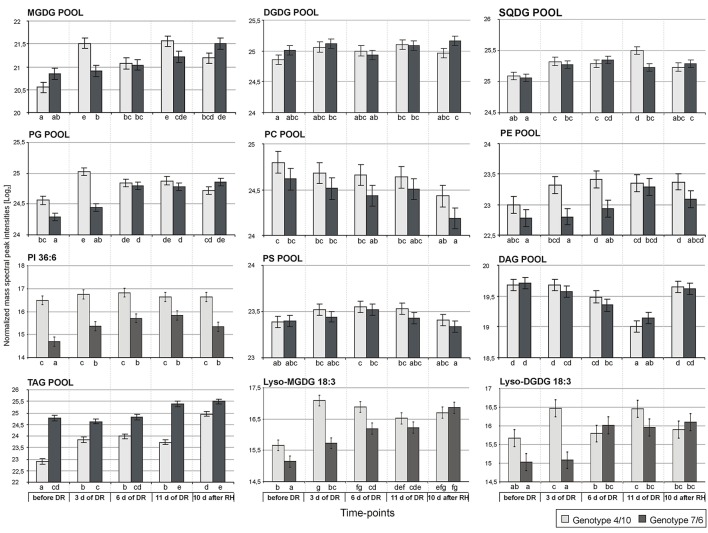
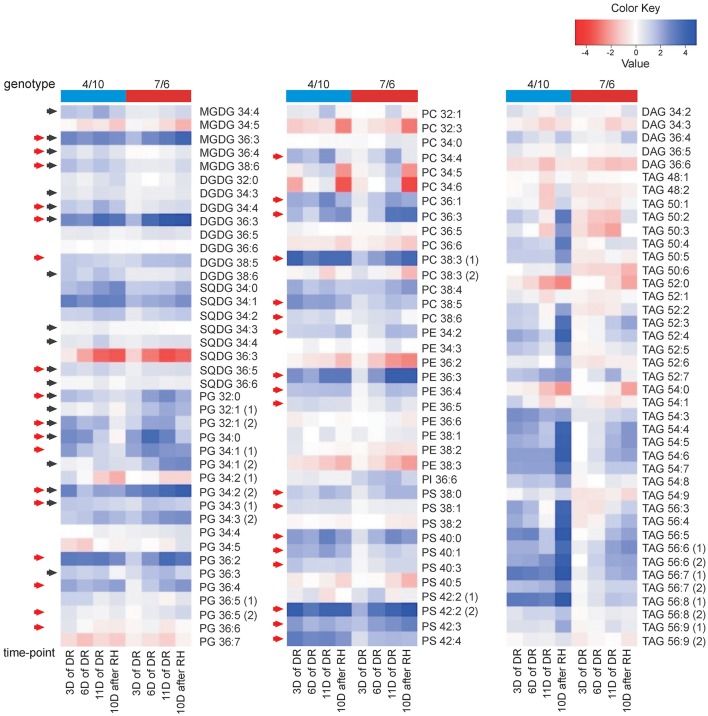
Drought tolerant plant genotypes are able to maintain stability and integrity of cellular membranes in unfavorable conditions, and to regenerate damaged membranes after stress cessation. The profiling of cellular glycerolipids during drought stress performed on model species such as Arabidopsis thaliana does not fully cover the picture of lipidome in monocots, including grasses. Herein, two closely related introgression genotypes of Lolium multiflorum (Italian ryegrass) × Festuca arundinacea (tall fescue) were used as a model for other grass species to describe lipid rearrangements during drought and re-hydration. The genotypes differed in their level of photosynthetic capacity during drought, and in their capacity for membrane regeneration after stress cessation. A total of 120 lipids, comprising the classes of monogalactosyldiacyloglycerol, digalactosyldiacyloglycerol, sulfoquinovosyldiacylglycerol, phosphatidylglycerol, phosphatidylcholine, phosphatidylethanolamine, phosphatidylserine, phosphatidylinositol, diacylglicerol, and triacylglicerol, were analyzed. The results clearly showed that water deficit had a significant impact on lipid metabolism in studied forage grasses. It was revealed that structural and metabolic lipid species changed their abundance during drought and re-watering periods and some crucial genotype-dependent differences were also observed. The introgression genotype characterized by an ability to regenerate membranes after re-hydration demonstrated a higher accumulation level of most chloroplast and numerous extra-chloroplast membrane lipid species at the beginning of drought. Furthermore, this genotype also revealed a significant reduction in the accumulation of most chloroplast lipids after re-hydration, compared with the other introgression genotype without the capacity for membrane regeneration. The potential influence of observed lipidomic alterations on a cellular membrane stability and photosynthetic capacity, are discussed. HIGHLIGHTS A higher drought tolerance of grasses could be associated with an earlier lipidome response to a stress signal and with a membrane regeneration after stress cessation accompanied by a turnover of chloroplast lipids.

Keywords: Festuca arundinacea; Lolium multiflorum; cell membranes; drought tolerance; grasses; lipidome profiling.


Figures

Figure 1
Figure 1
The relative accumulation levels of analyzed lipid species within 10 main lipid classes. The normalized mean mass spectral peak intensities with standard deviations are shown. Black numbers indicate the lipid species analyzed in the 4/10 and 7/6 genotypes, and gray numbers the species not analyzed. Lipid classes: DAG, diacylglycerol; DGDG, digalactosyldiacyloglycerol; MGDG, monogalactosyldiacyloglycerol; PC, phosphatidylcholine; PE, phosphatidylethanolamine; PG, phosphatidylglycerol; PI, phosphatidylinositol; PS, phosphatidylserine; SQDG, sulfoquinovosyldiacylglycerol; TAG, triacylglycerol.
Figure 2
Figure 2
The Double Bond Index (DBI) calculated for the pools of nine lipid classes with more than one identified individual lipid species. Calculations were performed based on means of log-transformed mass spectra peak intensities measured for a particular lipid species within a lipid class at four time-points of experiment: after 3, 6, and 11 days of drought, and after 10 days of re-hydration (the 21st day of experiment) in the 4/10 and 7/6 genotypes. Error bars represent standard errors of the means. The letters indicate groups of means that do not differ significantly at a significance level of 0.05 (Fisher's LSD-test). Lipid classes denoted as in Figure 1.
Figure 3
Figure 3
Biplots of intensities of main lipid classes and particular analyzed lipid species, and electrolyte leakage values (EL), drawn using two principal components with the highest variance. Black circles represent genotype 7/6, white circles - genotype 4/10. Time points are labeled by: C, control values; 3, the third day of drought; 6, the sixth day of drought; 11, the 11th day of drought; RH, 10 days after re-hydration. Gray lines represent analyzed variables (lipid intensity, lipid class intensity, EL). Lipid classes denoted as in Figure 1.
Figure 4
Figure 4
The accumulation levels of analyzed lipid classes at five time-points of experiment: before drought, after 3, 6, and 11 days of drought (DR), and 10 days of re-hydration (RH) in the 4/10 and 7/6 genotypes. The bars represent a mean value (over replications) for Log2 transformed sum of all the lipid species mass spectra peak intensities within a particular lipid class. Error bars represent standard errors of the means. The letters indicate groups of means that do not differ significantly at a significance level of 0.05 (Fisher's LSD-test). Lipid classes denoted as in Figure 1.
Figure 5
Figure 5
The accumulation of lipid species at four time-points of experiment: after 3, 6, and 11 days (D) of drought (DR), and after 10 days of re-hydration (RH) in the 4/10 and 7/6 introgression forms. The values shown are differences between mean Log2 transformed mass spectral peak intensities of particular lipid species at four time-points and control values; the values lower than the control are shown in shades of red and the values higher than the control are shown in shades of blue. The black arrows indicate chloroplast lipids exhibiting a return of accumulation between 11th day of drought and re-hydration to the levels observed before drought application in the 4/10 genotype, red arrows - lipids with a significantly higher accumulation level on the third day of drought in the genotype 4/10. Lipid classes denoted as in Figure 1.

References

    1. Awai K., Maréchal E., Block M. A., Brun D., Masuda T., Shimada H., et al. . (2001). Two types of MGDG synthase genes found widely in both 16:3 and 18:3 plants differentially mediate galactolipid syntheses in photosynthetic and nonphotosynthetic tissues in Arabidopsis thaliana. Proc. Natl. Acad. Sci. U.S.A. 98, 10960–10965. 10.1073/pnas.181331498 - DOI - PMC - PubMed
    1. Bray E. A., Bailey-Serres J., Weretilnyk E. (2000). Responses to abiotic stresses, in Biochemistry and Molecular Biology of Plants, eds Buchanan B. B., Gruissem W., Jones R. L. (Wiley; Blackwell; ), 1158–1249.
    1. Bromke M. A., Hochmuth A., Tohge T., Fernie A. R., Giavalisco P., Burgos A., et al. . (2015). Liquid chromatography high-resolution mass spectrometry for fatty acid profiling. Plant J. 81, 529–536. 10.1111/tpj.12739 - DOI - PubMed
    1. Burgos A., Szymanski J., Seiwert B., Degenkolbe T., Hannah M. A., Giavalisco P., et al. (2011). Analysis of short-term changes in the Arabidopsis thaliana glycerolipidome in response to temperature and light. Plant J. 66, 656–668. 10.1111/j.1365-313X.2011.04531.x - DOI - PubMed
    1. Cagliari A., Margis R., dos Santos Maraschin F., Turchetto-Zolet A. C., Loss G., Margis-Pinheiro M. (2011). Biosynthesis of Triacylglycerols (TAGs) in plants and alga. Int. J. Plant Biol. 2, 40–52. 10.4081/pb.2011.e10 - DOI

LinkOut - more resources