

doi: 10.1364/BOE.7.001183.
eCollection 2016 Apr 1.
Improvement of sensitivity in continuous wave near infra-red spectroscopy systems by using silicon photomultipliers
Affiliations
- PMID: 27486551
- PMCID: PMC4929631
- DOI: 10.1364/BOE.7.001183
Item in Clipboard
Improvement of sensitivity in continuous wave near infra-red spectroscopy systems by using silicon photomultipliers
Biomed Opt Express.
.
Abstract
We experimentally analyze the signal-to-noise ratio of continuous wave (CW) near infrared spectroscopy (NIRS) reflectance systems based on light emitting diodes and silicon photomultipliers for high performance low cost NIRS biomedical systems. We show that under suitable experimental conditions such systems exhibit a high SNR, which allows an SDS of 7 cm, to our knowledge the largest ever demonstrated in a CW-NIRs system.
Keywords: (040.6040) Silicon; (110.0113) Imaging through turbid media; (120.3890) Medical optics instrumentation; (230.5160) Photodetectors; (290.1350) Backscattering; (300.6340) Spectroscopy, infrared.
Figures
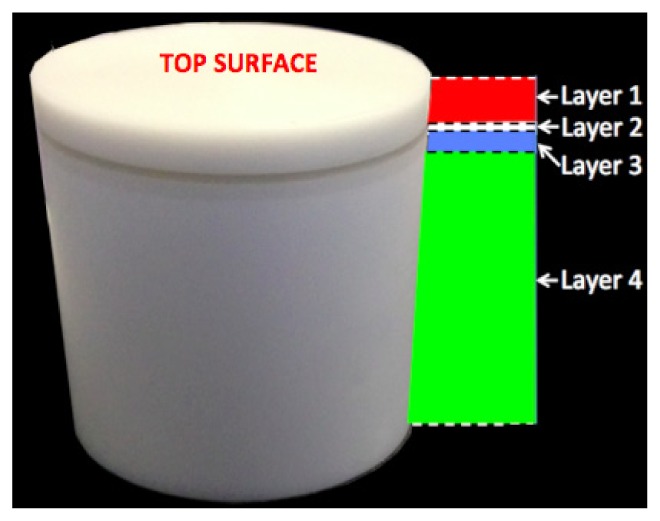
Image of the Phantom.
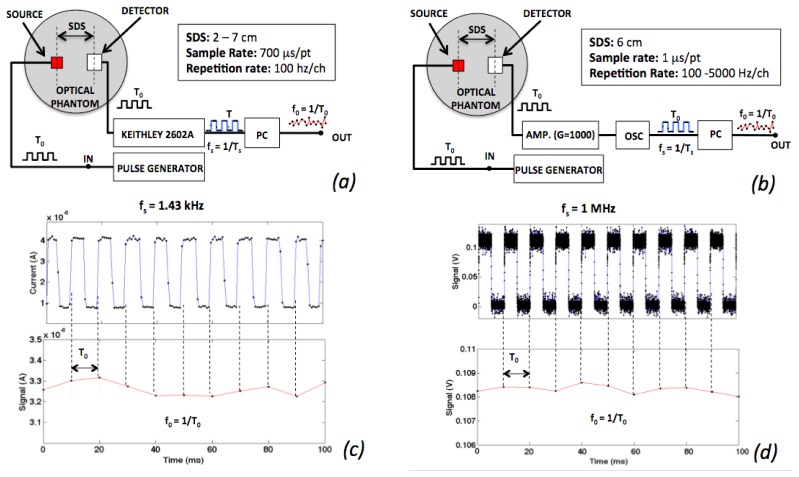
SNR experimental setup: (a) SNR vs. SDS setup at constant repetition rate (f0 = 100Hz); (b) SNR vs. repetition rate (f0) setup at constant SDS (6 cm).
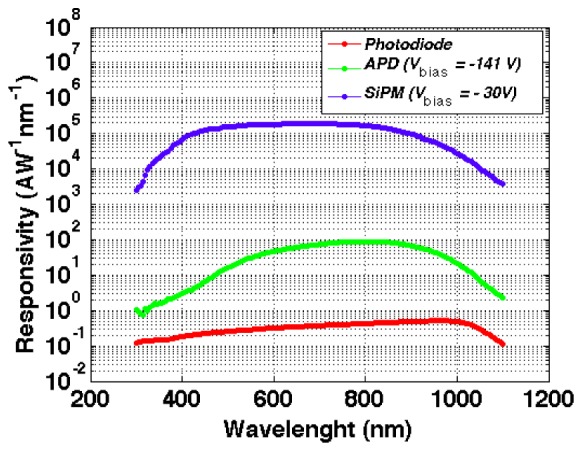
Comparisons of the responsivity vs. wavelength at −27°C of some silicon detectors (blue line STMicroelrctronics SiPM, green line Hamamtsu S3884 APD, red line Hamamatsu S1337–1010BQ Photodiode).
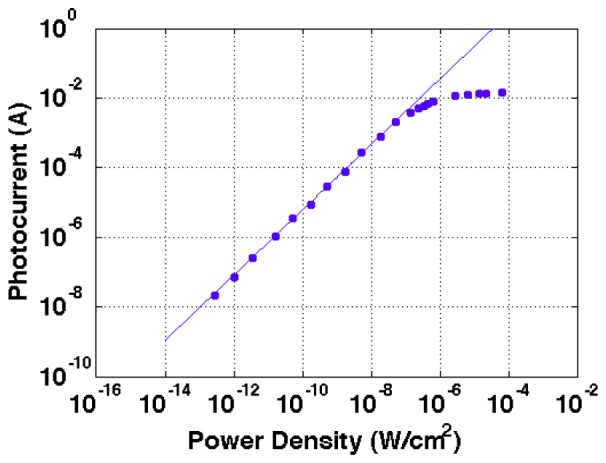
Photocurrent vs Power Density of the STMicroelectronics SiPM biased at −30V and at −27°C in response to a laser source with 660 nm wavelength.
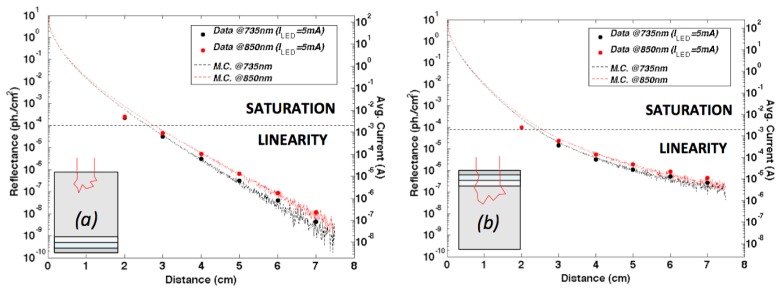
Comparisons between the expected optical signal and the measured average signal ms for (a) the 1st and (b) the 2nd phantom configuration as shown in the inset.
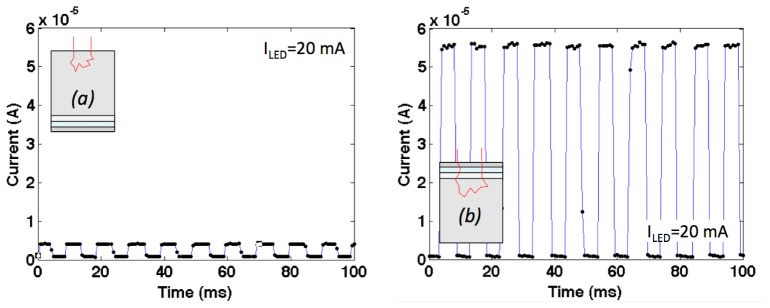
Raw signal s measured at a SDS of 6 cm in response to a source 735nm LED pumped at 20 mA for (a) the 1st and (b) the 2nd phantom configuration.
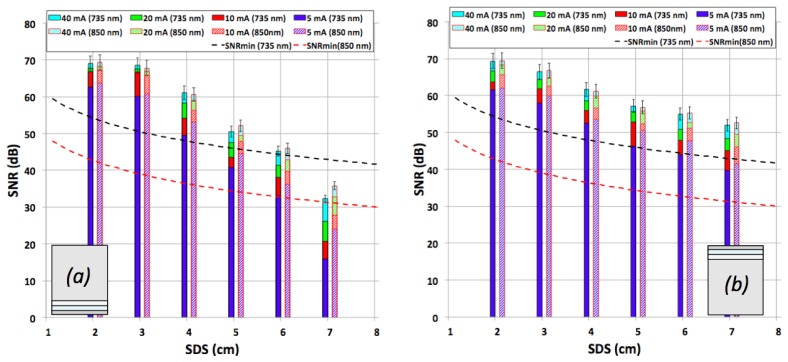
SNR vs. SDS for a repetition rate of 100 Hz per channel measured for (a) the 1st and (b) the 2nd phantom configuration as shown in the inset.
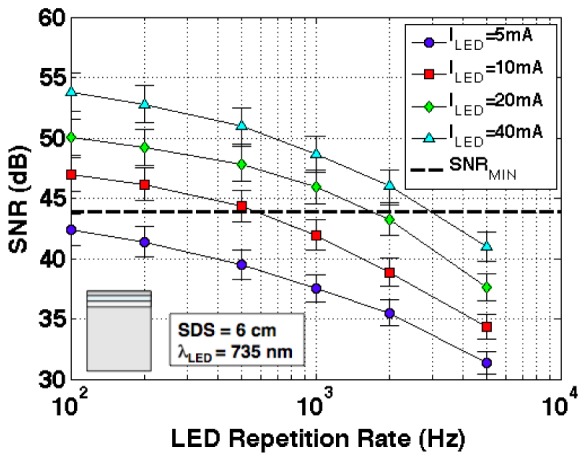
SNR vs. repetition rate (f0), at different LED pump currents, measured for the 2nd phantom configuration, as shown in the inset, at a SDS of 6 cm and for the 735 nm LED.
References
-
- Wolf M., Wolf U., Toronov V., Michalos A., Paunescu L. A., Choi J. H., Gratton E., “Different time evolution of oxyhemoglobin and deoxyhemoglobin concentration changes in the visual and motor cortices during functional stimulation: a near-infrared spectroscopy study,” Neuroimage 16(3), 704–712 (2002).10.1006/nimg.2002.1128 - DOI - PubMed
LinkOut - more resources
Full Text Sources
Other Literature Sources