. 2016 May 19:8:ecurrents.outbreaks.322427f4c3cc2b9c1a5b3395e7d20894.
doi: 10.1371/currents.outbreaks.322427f4c3cc2b9c1a5b3395e7d20894.

Beyond Contact Tracing: Community-Based Early Detection for Ebola Response

Affiliations

Beyond Contact Tracing: Community-Based Early Detection for Ebola Response

Vincent Wong et al. PLoS Curr. .

Abstract

Introduction: The 2014 Ebola outbreak in West Africa raised many questions about the control of infectious disease in an increasingly connected global society. Limited availability of contact information made contact tracing diffcult or impractical in combating the outbreak.

Methods: We consider the development of multi-scale public health strategies that act on individual and community levels. We simulate policies for community-level response aimed at early screening all members of a community, as well as travel restrictions to prevent inter-community transmission.

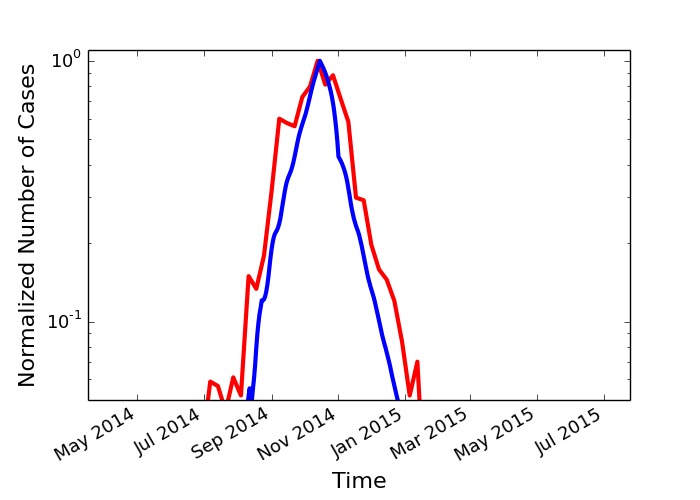
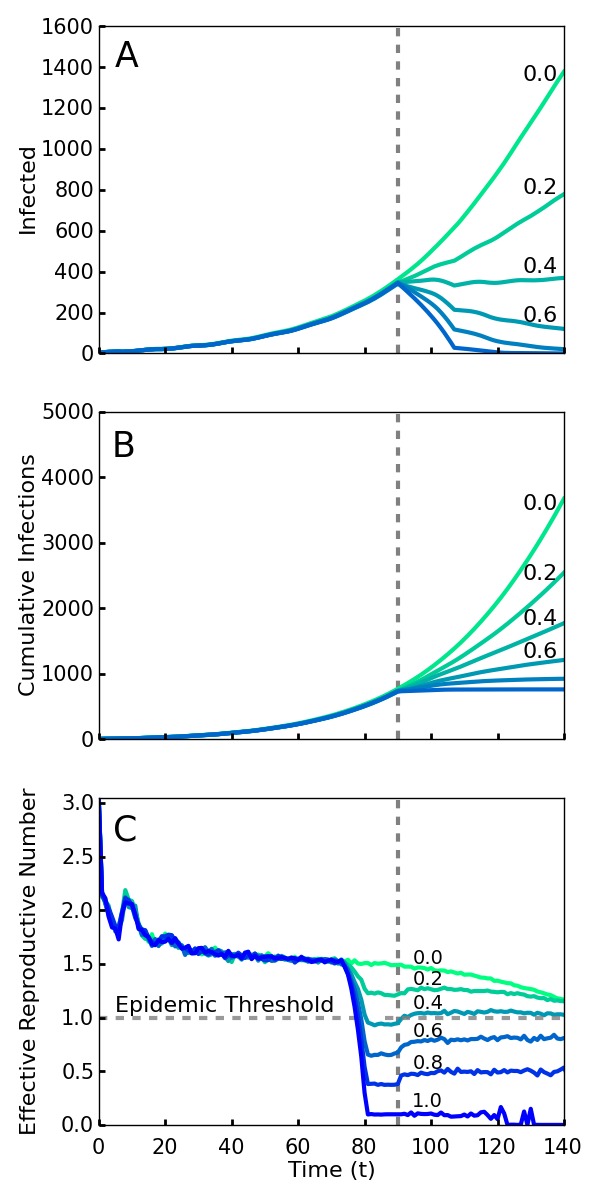
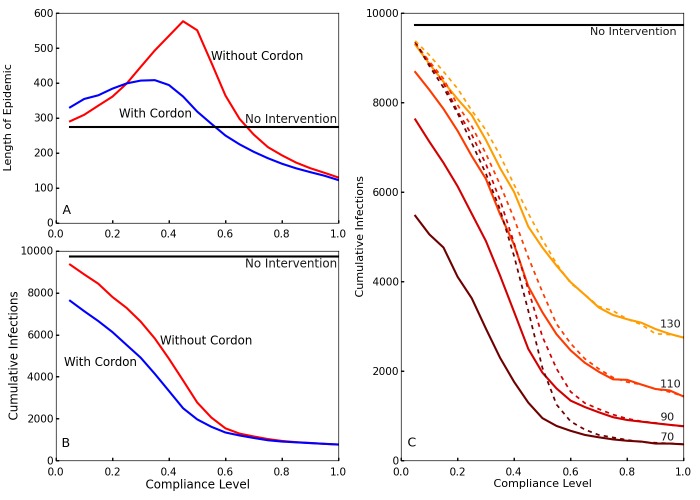
Results: Our analysis shows the policies to be effective even at a relatively low level of compliance and for a variety of local and long range contact transmission networks. In our simulations, 40% of individuals conforming to these policies is enough to stop the outbreak. Simulations with a 50% compliance rate are consistent with the case counts in Liberia during the period of rapid decline after mid September, 2014. We also find the travel restriction to be effective at reducing the risks associated with compliance substantially below the 40% level, shortening the outbreak and enabling efforts to be focused on affected areas.

Discussion: Our results suggest that the multi-scale approach can be used to further evolve public health strategy for defeating emerging epidemics.


Figures

Simulations of an outbreak with a community-level screening intervention
Screening begins at the vertical dotted line, with a level of compliance indicated by label and color (green 0 to blue 1.0). A. Number of cases with or without symptoms. Note that even 40% compliance (0.4) results in decrease in cases. B. Cumulative cases. C. Rt, the effective reproductive number---the average number of individuals infected by an index case at time t. For an epidemic to continue to grow, Rt must exceed 1. For 40% compliance (0.4) and greater, Rt decreases below one, corresponding with a decrease in active cases. Rt drops before t = 70 because policies affect the contagion of individuals that are initially infected prior to the intervention.
Schematic of different types of transmissions
Black squares indicate individuals of a spatially structured population, blue lines denote partitions between communities. A. Neighbor infection within a neighborhood. B. Cross-partition neighbor infection to another community. C. Long-range transmission within a community. D. Long-range transmission across a partition.
Effect of compliance on epidemic length and cumulative infections with and without travel restrictions
A and B: Blue shows the case with travel restrictions, and red shows the case without such restrictions. Differentiation between the two occurs because the travel restrictions compensate for low levels of compliance. This decreases the length of the epidemic A and reduces the cumulative number of infections B in cases of low compliance. C. The cumulative number of infections over the entire epidemic, as a function of compliance levels and intervention times. Colors from brown to yellow signify intervention times (50, 70, 90, 110). Without enforced travel restrictions (dotted lines), a low compliance results in little differentiation between early and late policy implementation. The travel restrictions (solid lines) dramatically reduce infection number for earlier interventions at low compliance.
Contraction of the epidemic areas using cordons and labeled neighborhoods
A simulated epidemic run on a 300×300 lattice with neighborhoods of size 10×10, with 70% compliance (0.7) and a delay of T0 = 50 days. Colored squares represent neighborhoods of types A (red, known infection), B (green, neighboring known infection), and C (blue, neither A nor B). Top (left to right) 60, 70, and 80 days, bottom 90, 100, and 110 days. Type C neighborhoods remain free from infection due to the protection provided by travel restrictions.
Comparison of empirical data with simulations
Normalized, linear-log plot of Liberia empirical values (red) compared with simulation data (blue) with T0 = 50 and 50% compliance (0.5).
Simulations for different types of networks
Screening at the dotted lines. Results are normalized to the number of infected individuals at the time of the intervention. The intervention is robust against variation in network structure. A. Von Neumann neighborhood of four nearest neighbors. B. Moore neighborhood of eight nearest neighbors. C. Kleinberg small world network, with four nearest neighbors and longrange neighbors with probability of connection decreasing as inverse distance squared.
Comparison of simulated time-series
The value of Rt measured from the average number of secondary infections caused by an individual infected at time t, averaged over 1,000 simulations, is shown in blue. Rt calculated by Eq. 5 is shown in red. The values of zt and St, the average number of susceptible neighbors for an individual infected at time t and the average number of susceptibles in the population at time $t$, are also obtained from an average over 1,000 simulations.
Simulations of an outbreak with a community-level screening intervention
Screening begins at the vertical dotted line, with a level of compliance indicated by label and color (green 0 to blue 1.0). A. Number of cases with or without symptoms. Note that, compared to the simulations in the main paper, 40% compliance (0.4) is no longer sufficient to end this more virulent outbreak. B. Cumulative cases. C. For greater than 40% compliance (0.4), Rt decreases below one, corresponding to a rapid decrease in active cases. Despite this change, the overall results are robust as a compliance value of 0.6 is sufficient to end the outbreak.
Effect of compliance on epidemic length and cumulative infections with and without travel restrictions for the second set of parameter values (Δ = 10, Γ = 7)
A,B. Simulations with (blue) and without (red) travel restrictions. The travel restrictions compensate for low levels of compliance, and their differences are comparable to Fig. 3 in the main paper. C. The cumulative number of infections over the entire epidemic, as a function of compliance levels and intervention times. Colors from brown to yellow signify intervention times (70, 90, 110, 130). Without enforced travel restrictions (dotted lines), a low compliance results in minimal differences between early and late policy implementation. Travel restrictions (solid lines) dramatically reduce infection numbers for earlier interventions at low compliance. We chose a slightly later set of intervention times T0 for this set of parameters because the mean generation length (Δ + Γ) , is about 50% longer, 17 days, compared to the 11 days for the Δ = 5, Γ = 6 case, so the exponential growth phase begins at a later time.

Similar articles

Cited by

References

    1. World Health Organization (WHO). Contact tracing during an outbreak of ebola virus disease. WHO. Published September 2015. Accessed February 1, 2016.
    1. World Health Organization (WHO). Frequently asked questions on ebola virus disease. WHO. Published August 2014.
    1. Browne C, Huo X, Magal P, Seydi M, Seydi O, et al. A Model of the 2014 Ebola Epidemic in West Africa with Contact Tracing. arXiv:1410.3817 2015. - PMC - PubMed
    1. Eames KT, Keeling MJ. Contact tracing and disease control. Proceedings of the Royal Society of London. Series B: Biological Sciences. 2003;270(1533):2565-71. - PMC - PubMed
    1. Tsimring LS, Huerta R. Modeling of contact tracing in social networks. Physica A: Statistical Mechanics and its Applications. 2003;325(1-2):33-39.

LinkOut - more resources