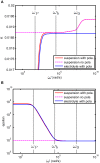
Compensating for Electrode Polarization in Dielectric Spectroscopy Studies of Colloidal Suspensions: Theoretical Assessment of Existing Methods
- PMID: 27486575
- PMCID: PMC4949231
- DOI: 10.3389/fchem.2016.00030
Compensating for Electrode Polarization in Dielectric Spectroscopy Studies of Colloidal Suspensions: Theoretical Assessment of Existing Methods
Abstract
Dielectric spectroscopy can be used to determine the dipole moment of colloidal particles from which important interfacial electrokinetic properties, for instance their zeta potential, can be deduced. Unfortunately, dielectric spectroscopy measurements are hampered by electrode polarization (EP). In this article, we review several procedures to compensate for this effect. First EP in electrolyte solutions is described: the complex conductivity is derived as function of frequency, for two cell geometries (planar and cylindrical) with blocking electrodes. The corresponding equivalent circuit for the electrolyte solution is given for each geometry. This equivalent circuit model is extended to suspensions. The complex conductivity of a suspension, in the presence of EP, is then calculated from the impedance. Different methods for compensating for EP are critically assessed, with the help of the theoretical findings. Their limit of validity is given in terms of characteristic frequencies. We can identify with one of these frequencies the frequency range within which data uncorrected for EP may be used to assess the dipole moment of colloidal particles. In order to extract this dipole moment from the measured data, two methods are reviewed: one is based on the use of existing models for the complex conductivity of suspensions, the other is the logarithmic derivative method. An extension to multiple relaxations of the logarithmic derivative method is proposed.
Keywords: colloidal suspension; complex conductivity and permittivity; electrode polarization.
Figures


Similar articles
-
Analysis of the dielectric permittivity of suspensions by means of the logarithmic derivative of its real part.J Colloid Interface Sci. 2002 May 15;249(2):327-35. doi: 10.1006/jcis.2001.8141. J Colloid Interface Sci. 2002. PMID: 16290605
-
Dielectric relaxation in concentrated nonaqueous colloidal suspensions.J Colloid Interface Sci. 2014 Dec 15;436:132-7. doi: 10.1016/j.jcis.2014.09.008. Epub 2014 Sep 16. J Colloid Interface Sci. 2014. PMID: 25268816
-
Electric permittivity of concentrated suspensions of elongated goethite particles.J Colloid Interface Sci. 2010 Mar 15;343(2):564-73. doi: 10.1016/j.jcis.2009.11.063. Epub 2009 Dec 4. J Colloid Interface Sci. 2010. PMID: 20044095
-
A broad frequency range dielectric spectrometer for colloidal suspensions: cell design, calibration, and validation.J Colloid Interface Sci. 2003 Jan 1;257(1):65-76. doi: 10.1016/s0021-9797(02)00029-2. J Colloid Interface Sci. 2003. PMID: 16256457
-
Dielectric spectroscopy and electrophoretic mobility measurements interpreted with the standard electrokinetic model.J Colloid Interface Sci. 2004 Apr 1;272(1):235-45. doi: 10.1016/j.jcis.2003.08.032. J Colloid Interface Sci. 2004. PMID: 14985042
Cited by
-
Impedance Spectroscopy as a Tool for Monitoring Performance in 3D Models of Epithelial Tissues.Front Bioeng Biotechnol. 2020 Jan 24;7:474. doi: 10.3389/fbioe.2019.00474. eCollection 2019. Front Bioeng Biotechnol. 2020. PMID: 32039179 Free PMC article. Review.
-
Fractional Calculus as a Tool for Modeling Electrical Relaxation Phenomena in Polymers.Polymers (Basel). 2025 Jun 20;17(13):1726. doi: 10.3390/polym17131726. Polymers (Basel). 2025. PMID: 40647737 Free PMC article.
-
AC Electrokinetics of Salt-Free Multilayered Polymer-Grafted Particles.Polymers (Basel). 2020 Sep 15;12(9):2097. doi: 10.3390/polym12092097. Polymers (Basel). 2020. PMID: 32942664 Free PMC article.
-
Impedance of nanocapacitors from molecular simulations to understand the dynamics of confined electrolytes.Proc Natl Acad Sci U S A. 2024 Apr 30;121(18):e2318157121. doi: 10.1073/pnas.2318157121. Epub 2024 Apr 25. Proc Natl Acad Sci U S A. 2024. PMID: 38662549 Free PMC article.
-
A New Analytical Formulation for the Electrophoretic Mobility of a Colloidal Sphere.Entropy (Basel). 2025 Mar 24;27(4):336. doi: 10.3390/e27040336. Entropy (Basel). 2025. PMID: 40282571 Free PMC article.
References
-
- Barsoukov E., Macdonald J. R. (2005). Impedance Spectroscopy Theory, Experiments and Applications, 2nd Edn. NewYork, NY: Wiley; 10.1002/0471716243 - DOI
-
- Beltramo P. J., Furst E. M. (2012). A simple, single-measurement methodology to account for electrode polarization in the dielectric spectra of colloidal dispersions. Chem. Lett. 41, 1116–1118. 10.1246/cl.2012.1116 - DOI
-
- Buck R. P. (1969). Diffuse layer charge relaxation at the ideally polarized electrode. J. Electroanal. Chem. 23, 219–240. 10.1016/S0022-0728(69)80212-3 - DOI
Publication types
LinkOut - more resources
Full Text Sources
Other Literature Sources

