

Tourniquet Test for Dengue Diagnosis: Systematic Review and Meta-analysis of Diagnostic Test Accuracy
- PMID: 27486661
- PMCID: PMC4972435
- DOI: 10.1371/journal.pntd.0004888
Tourniquet Test for Dengue Diagnosis: Systematic Review and Meta-analysis of Diagnostic Test Accuracy
Abstract
Background: Dengue fever is a ubiquitous arboviral infection in tropical and sub-tropical regions, whose incidence has increased over recent decades. In the absence of a rapid point of care test, the clinical diagnosis of dengue is complex. The World Health Organisation has outlined diagnostic criteria for making the diagnosis of dengue infection, which includes the use of the tourniquet test (TT).
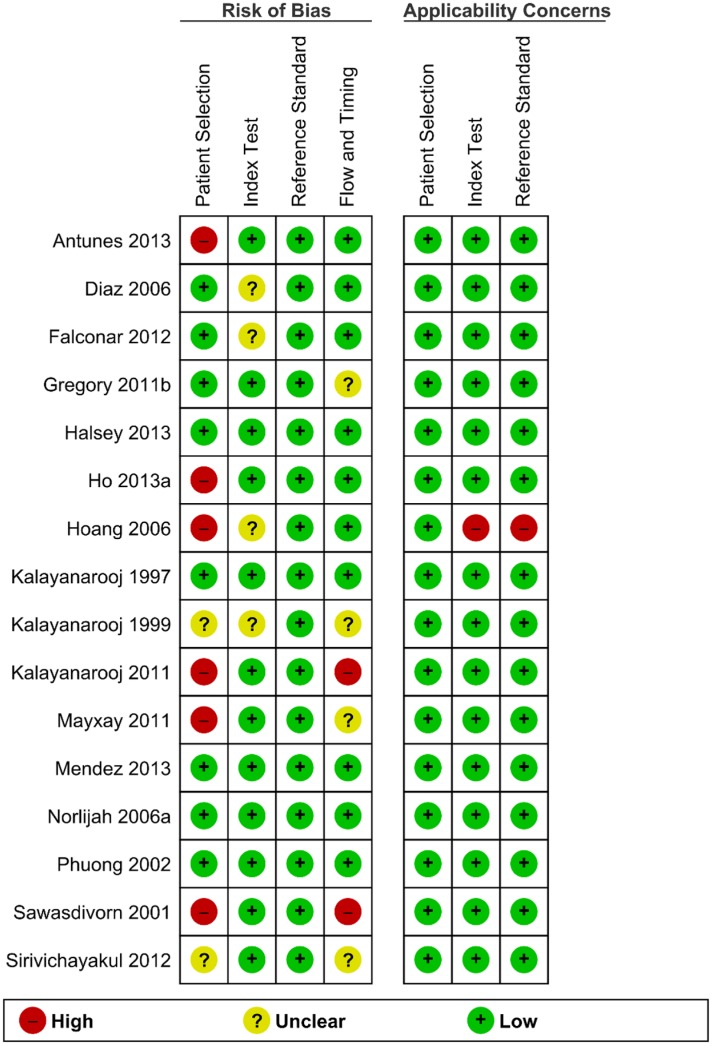
Purpose: To assess the quality of the evidence supporting the use of the TT and perform a diagnostic accuracy meta-analysis comparing the TT to antibody response measured by ELISA.
Data sources: A comprehensive literature search was conducted in the following databases to April, 2016: MEDLINE (PubMed), EMBASE, Cochrane Central Register of Controlled Trials, BIOSIS, Web of Science, SCOPUS.
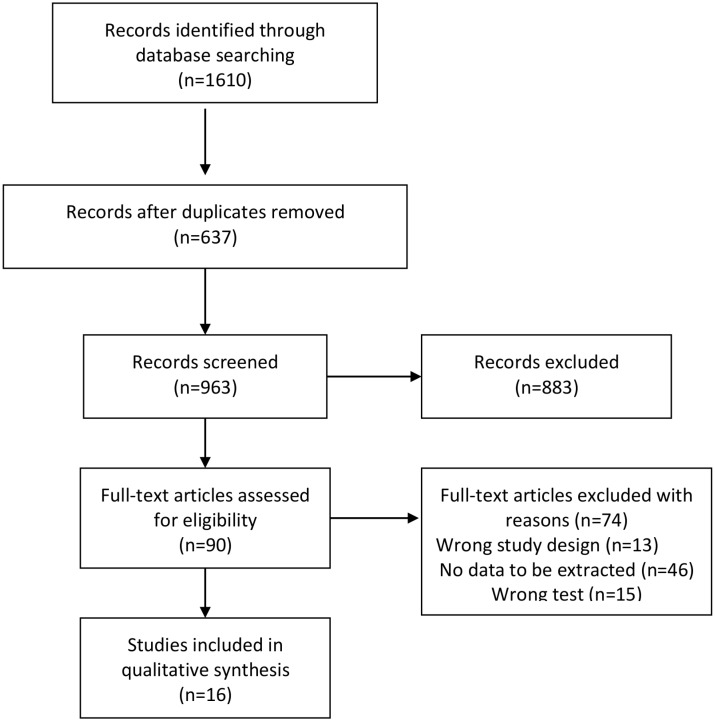
Study selection: Studies comparing the diagnostic accuracy of the tourniquet test with ELISA for the diagnosis of dengue were included.
Data extraction: Two independent authors extracted data using a standardized form.
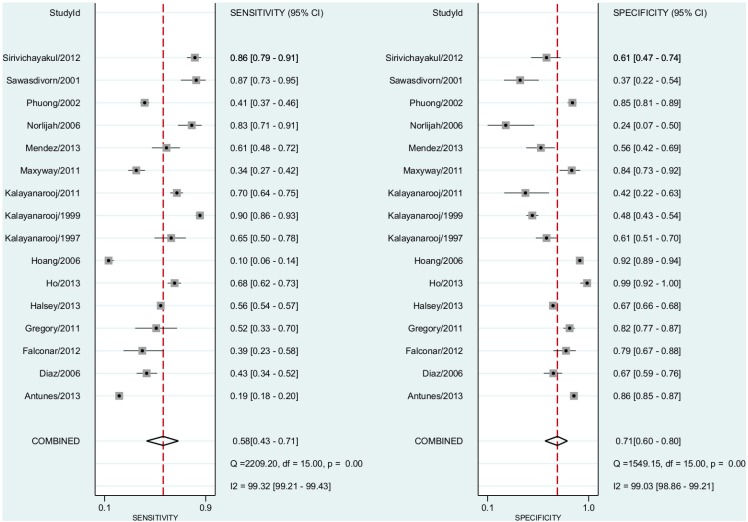
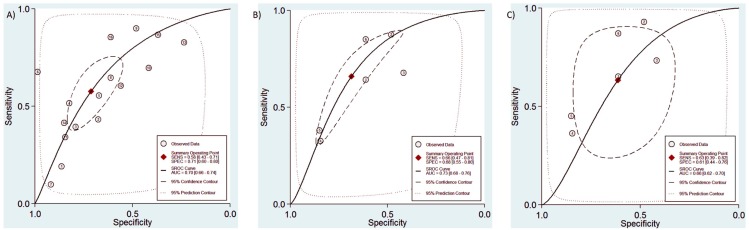
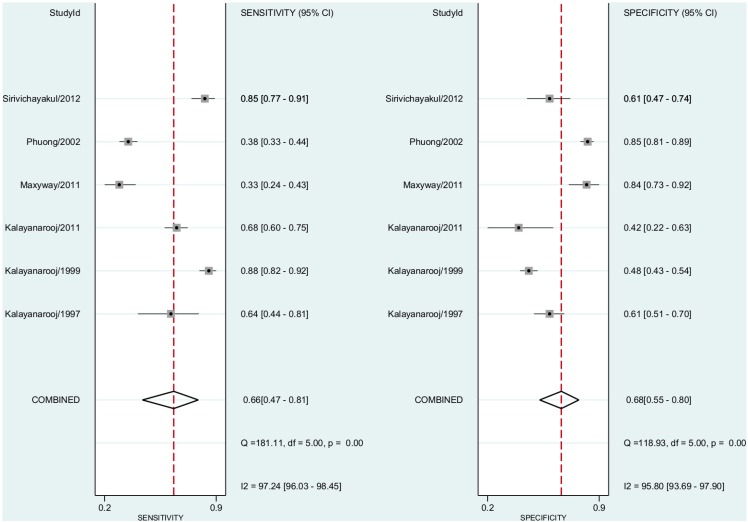
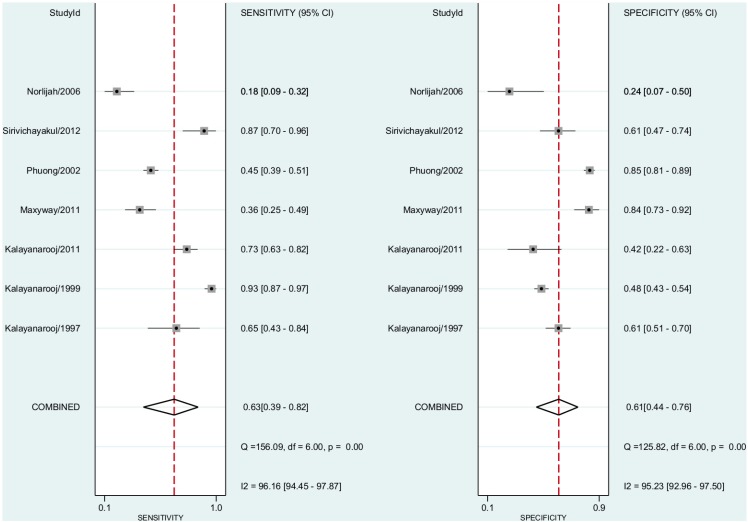
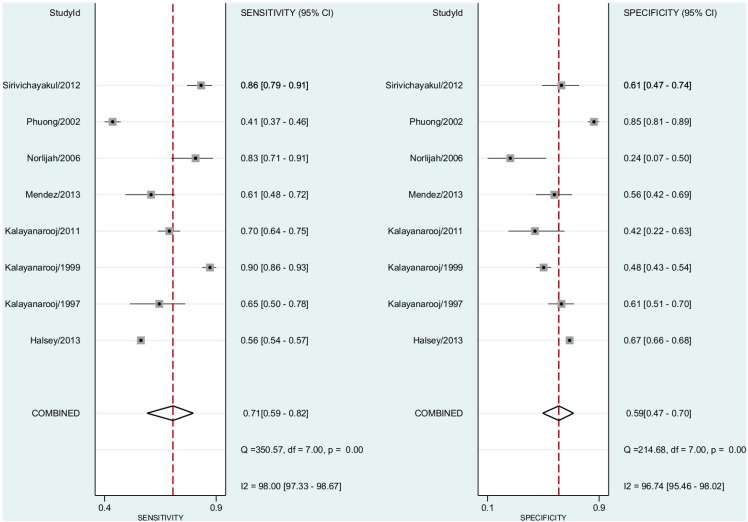
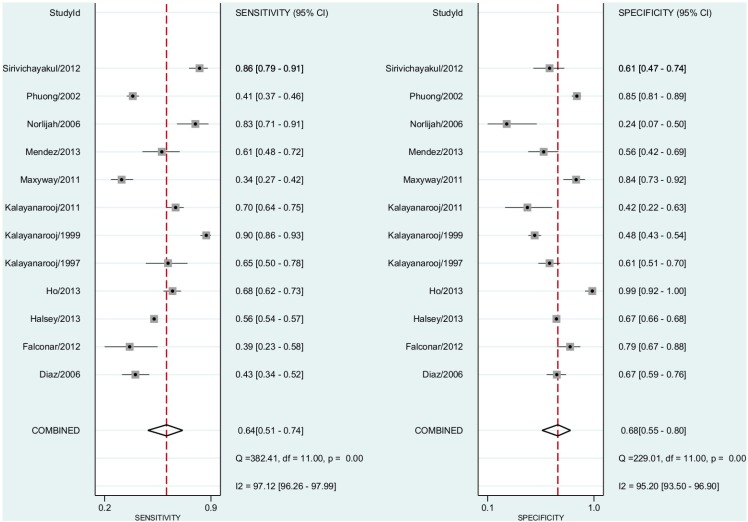
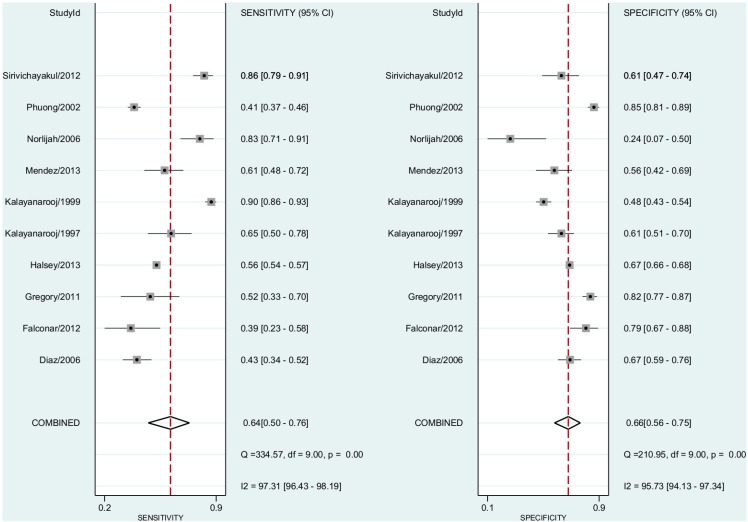
Data synthesis: A total of 16 studies with 28,739 participants were included in the meta-analysis. Pooled sensitivity for dengue diagnosis by TT was 58% (95% Confidence Interval (CI), 43%-71%) and the specificity was 71% (95% CI, 60%-80%). In the subgroup analysis sensitivity for non-severe dengue diagnosis was 55% (95% CI, 52%-59%) and the specificity was 63% (95% CI, 60%-66%), whilst sensitivity for dengue hemorrhagic fever diagnosis was 62% (95% CI, 53%-71%) and the specificity was 60% (95% CI, 48%-70%). Receiver-operator characteristics demonstrated a test accuracy (AUC) of 0.70 (95% CI, 0.66-0.74).
Conclusion: The tourniquet test is widely used in resource poor settings despite currently available evidence demonstrating only a marginal benefit in making a diagnosis of dengue infection alone.
Registration: The protocol for this systematic review was registered at
Prospero: CRD42015020323.
Conflict of interest statement
The authors have declared that no competing interests exist.
Figures
References
-
- Deen JL, Harris E, Wills B, Balmaseda A, Hammond SN, et al. (2006) The WHO dengue classification and case definitions: time for a reassessment. Lancet 368: 170–173. - PubMed
-
- Kabra S, Jain Y, Pandey R, Madhulika, Singhal T, et al. (1999) Dengue haemorrhagic fever in children in the 1996 Delhi epidemic. Transactions of the Royal Society of Tropical Medicine and Hygiene 93: 294–298. - PubMed
-
- Manjith N, Aravind MA, Thilothammal N, Prema R, Sargunam CSR, et al. (2002) Dengue fever epidemic in Chennai—a study of clinical profile and outcome. Indian Pediatrics 39: 1027–1033. - PubMed
Publication types
MeSH terms
LinkOut - more resources
Full Text Sources
Other Literature Sources
Medical
Miscellaneous
