

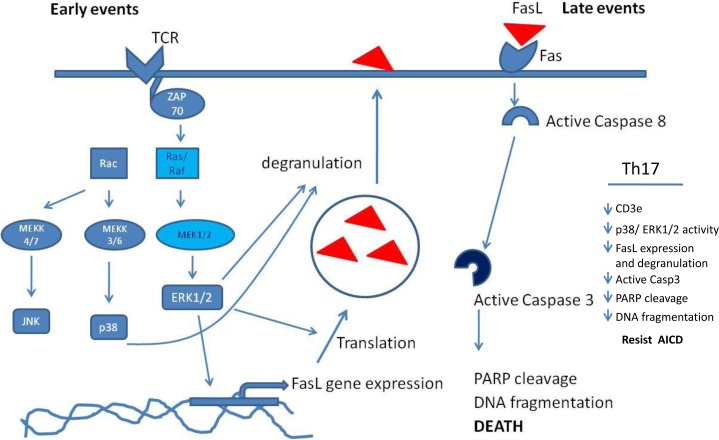
Inherent low Erk and p38 activity reduce Fas Ligand expression and degranulation in T helper 17 cells leading to activation induced cell death resistance
- PMID: 27486885
- PMCID: PMC5342346
- DOI: 10.18632/oncotarget.10913
Inherent low Erk and p38 activity reduce Fas Ligand expression and degranulation in T helper 17 cells leading to activation induced cell death resistance
Abstract
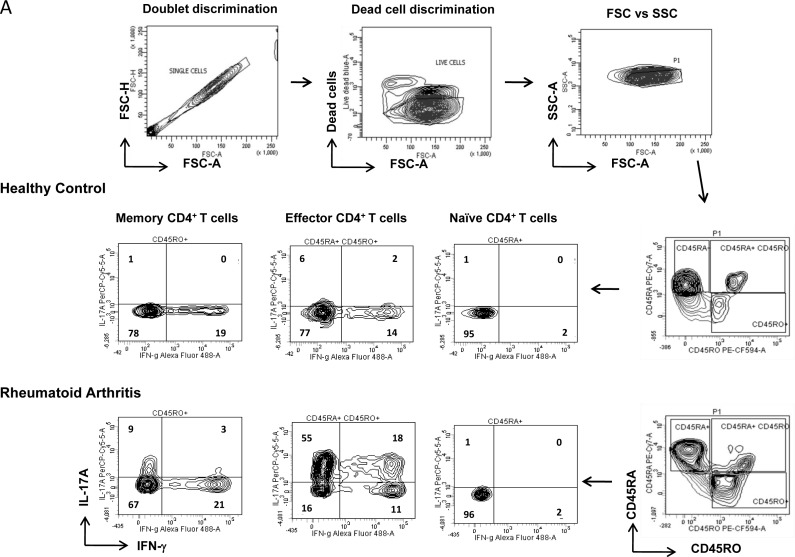
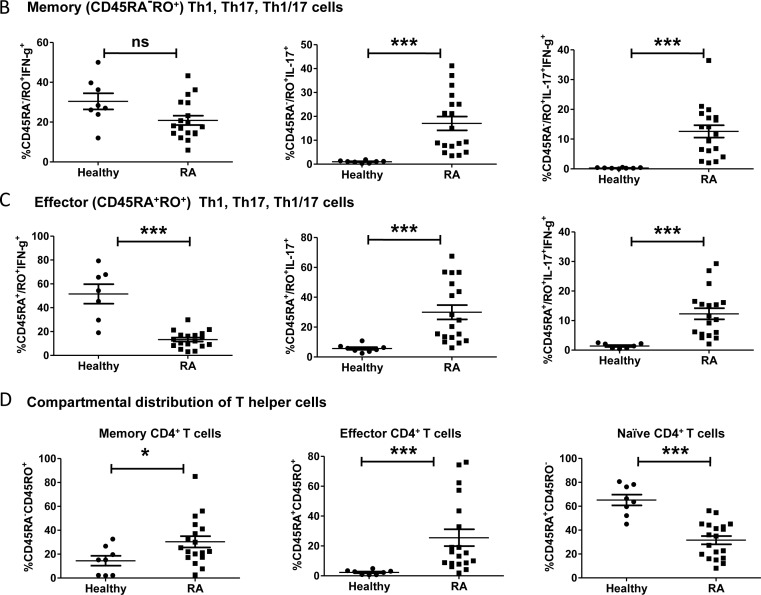
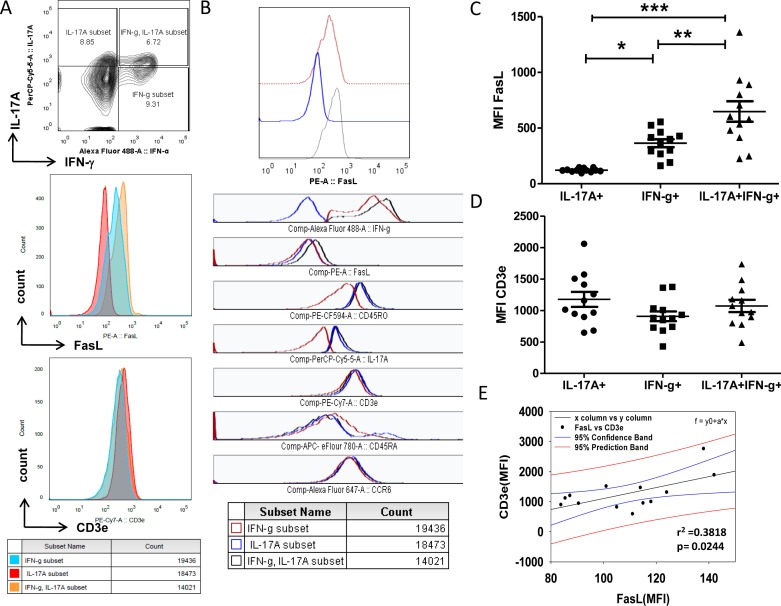
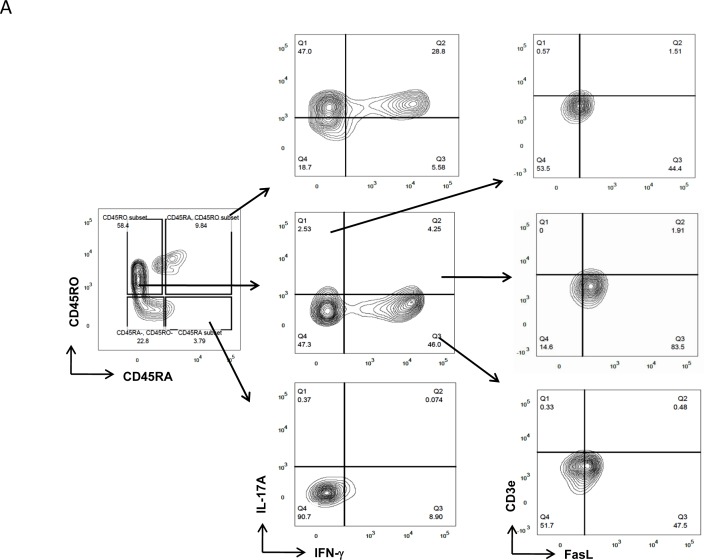
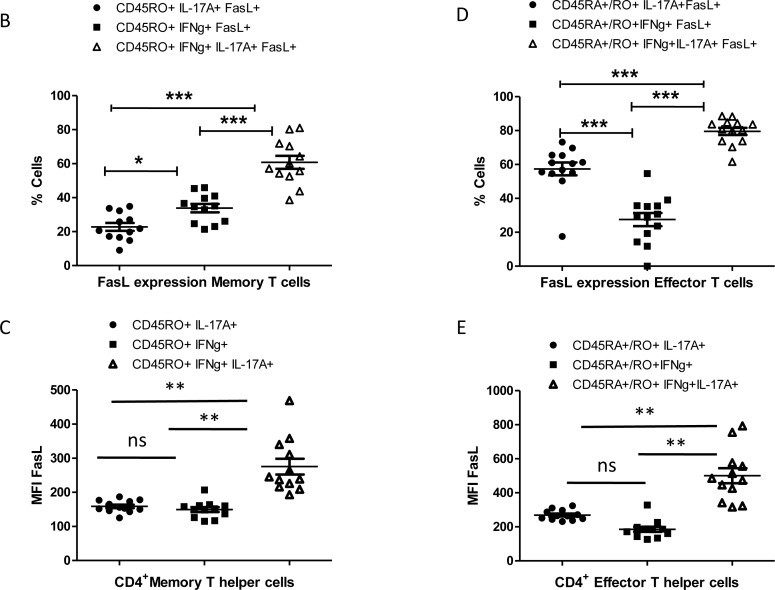
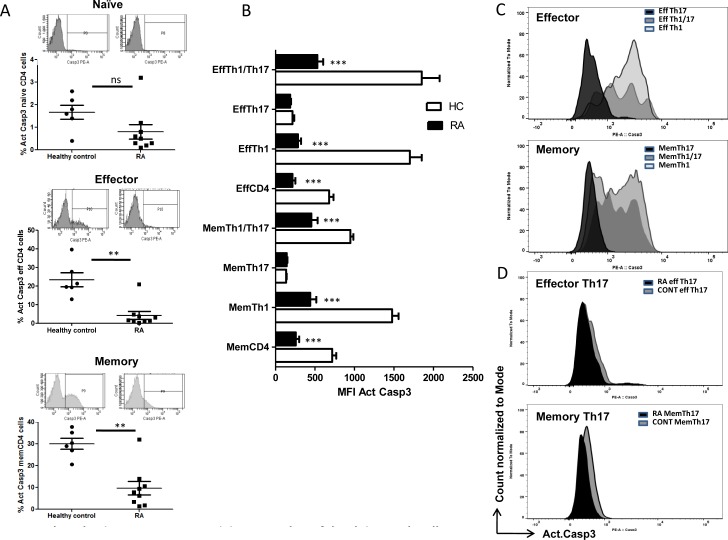
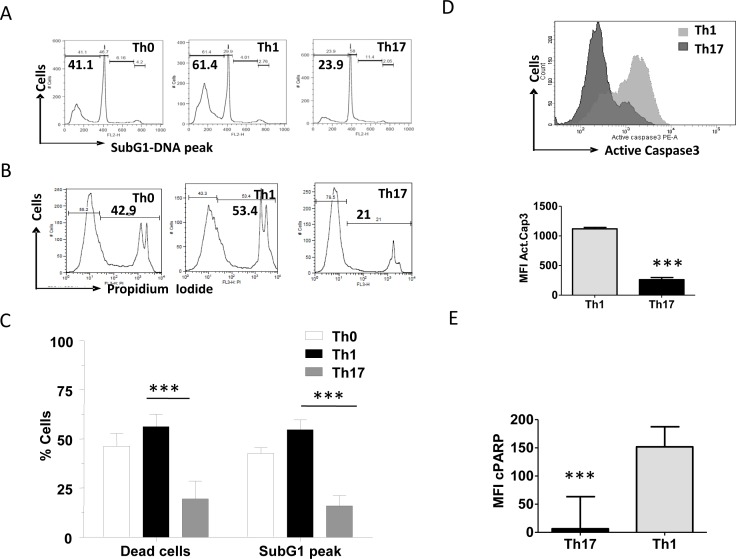
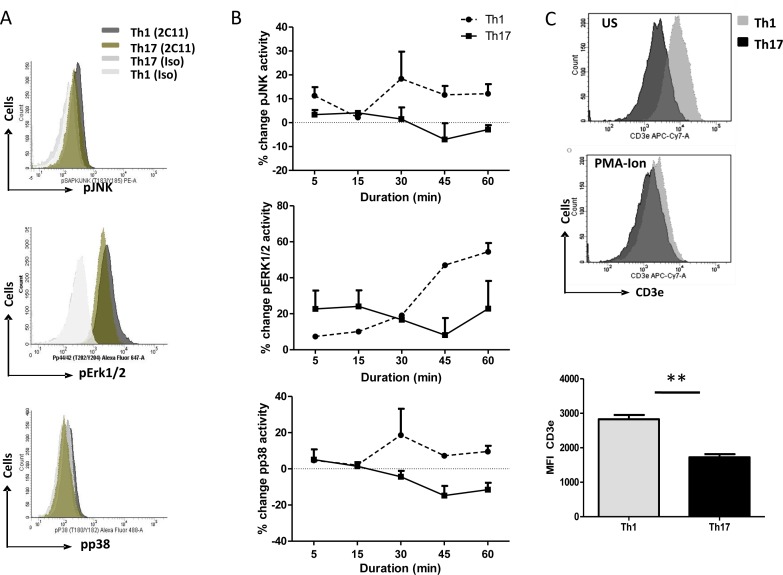
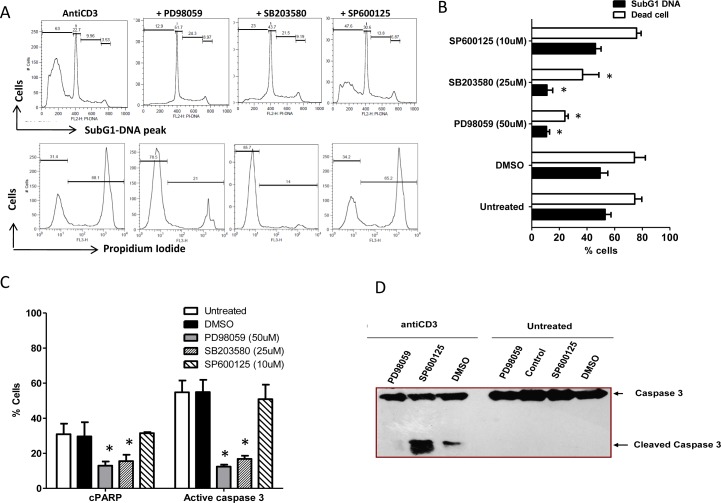
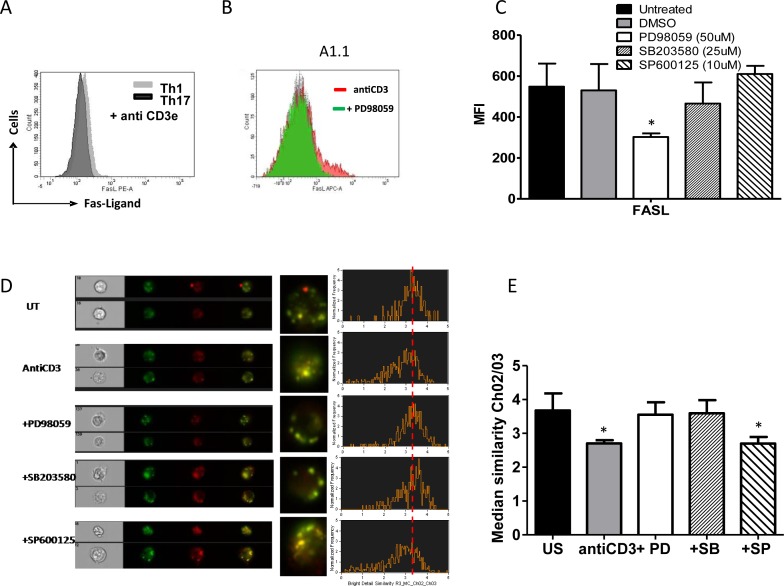
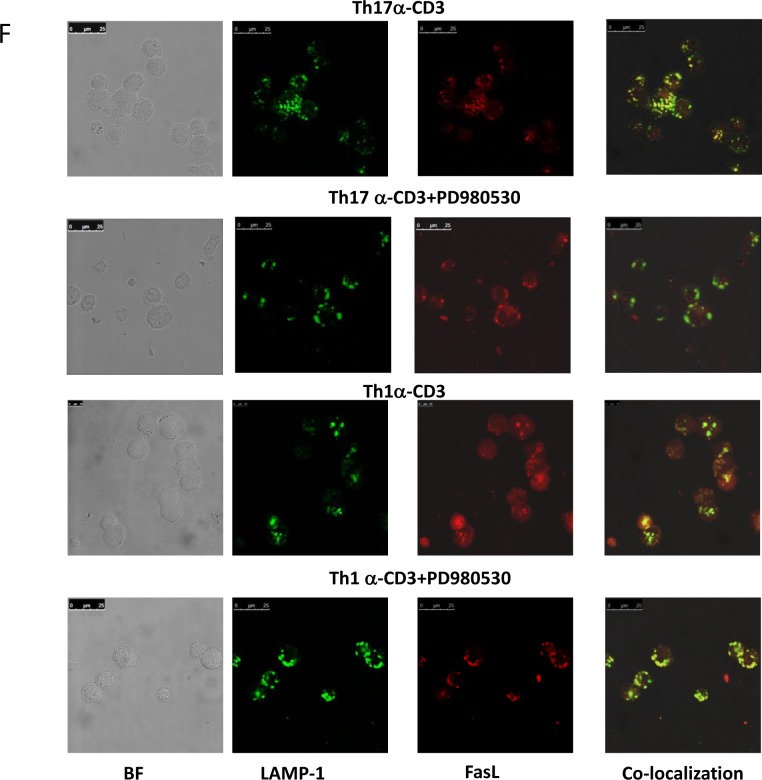
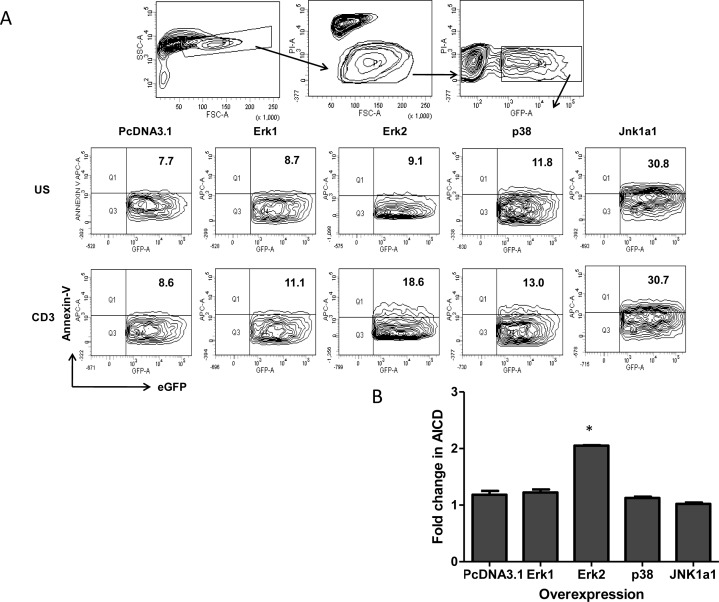
Activation Induced Cell Death of T helper cells is central to maintaining immune homeostasis and a perturbation often manifests in aberrant T helper cells that is associated with immunopathologies. Significant presence of T cells positive for IL-17A (Th17) and dual positive for IFN-γ/IL-17A (Th1/Th17) in both effector (CD45RA+RO+) and memory (CD45RA-RO+) compartments with differential FasL protein in RA peripheral blood suggested their differential TCR AICD sensitivity. Lowered active caspase-3 in Th17 and Th1/Th17 over Th1 cells confirmed their capability to resist AICD and pointed to early upstream events. Differential MAPK activities, FasL protein and downstream caspase-3 activities in murine Th1 and Th17 cells established distinct TCR mediated signaling pathways and suggested low Erk and p38 activity as pivotal for AICD sensitivity. We extrapolated our mouse and human data and report that Fas-FasL is the preferred death pathway for both Th1 and Th17 and that inherently low Erk2 activity protected Th17 cells from TCR AICD. The presence of significantly higher numbers of aberrant T helper cells in RA also suggest an inflammatory cytokine milieu and AICD insensitive T cell link to sustained inflammation. Re sensitization to apoptosis by targeting MAPK activity especially Erk2 in RA might be of therapeutic value.
Keywords: AICD; FasL; Immune response; Immunity; Immunology and Microbiology Section; MAPK; T helper cells; rheumatoid arthritis.
Conflict of interest statement
The authors have no conflict of interest.
Figures
References
-
- Gibofsky A. Overview of epidemiology, pathophysiology, and diagnosis of rheumatoid arthritis. The American journal of managed care. 2012;18(13 Suppl):S295–302. - PubMed
-
- McInnes IB, Schett G. The pathogenesis of rheumatoid arthritis. The New England journal of medicine. 2011;365(23):2205–2219. - PubMed
-
- Dolhain RJ, ter Haar NT, Hoefakker S, Tak PP, de Ley M, Claassen E, Breedveld FC, Miltenburg AM. Increased expression of interferon (IFN)-gamma together with IFN-gamma receptor in the rheumatoid synovial membrane compared with synovium of patients with osteoarthritis. British journal of rheumatology. 1996;35(1):24–32. - PubMed
-
- Cua DJ, Sherlock J, Chen Y, Murphy CA, Joyce B, Seymour B, Lucian L, To W, Kwan S, Churakova T, Zurawski S, Wiekowski M, Lira SA, Gorman D, Kastelein RA, Sedgwick JD. Interleukin-23 rather than interleukin-12 is the critical cytokine for autoimmune inflammation of the brain. Nature. 2003;421(6924):744–748. - PubMed
MeSH terms
Substances
LinkOut - more resources
Full Text Sources
Other Literature Sources
Research Materials
Miscellaneous
