. 2016 Aug 3;11(8):e0160374.
doi: 10.1371/journal.pone.0160374. eCollection 2016.

Outer Membrane Vesicles from the Probiotic Escherichia coli Nissle 1917 and the Commensal ECOR12 Enter Intestinal Epithelial Cells via Clathrin-Dependent Endocytosis and Elicit Differential Effects on DNA Damage

Affiliations

Outer Membrane Vesicles from the Probiotic Escherichia coli Nissle 1917 and the Commensal ECOR12 Enter Intestinal Epithelial Cells via Clathrin-Dependent Endocytosis and Elicit Differential Effects on DNA Damage

María-Alexandra Cañas et al. PLoS One. .

Abstract

Interactions between intestinal microbiota and the human host are complex. The gut mucosal surface is covered by a mucin layer that prevents bacteria from accessing the epithelial cells. Thus, the crosstalk between microbiota and the host mainly rely on secreted factors that can go through the mucus layer and reach the epithelium. In this context, vesicles released by commensal strains are seen as key players in signaling processes in the intestinal mucosa. Studies with Gram-negative pathogens showed that outer membrane vesicles (OMVs) are internalized into the host cell by endocytosis, but the entry mechanism for microbiota-derived vesicles is unknown. Escherichia coli strains are found as part of normal human gut microbiota. In this work, we elucidate the pathway that mediate internalization of OMVs from the probiotic E.coli Nissle 1917 (EcN) and the commensal ECOR12 strains in several human intestinal epithelial cell lines. Time course measurement of fluorescence and microscopy analysis performed with rhodamine B-R18-labeled OMVs in the presence of endocytosis inhibitors showed that OMVs from these strains enter epithelial cells via clathrin-mediated endocytosis. Vesicles use the same endocytosis pathway in polarized epithelial monolayers. Internalized OMVs are sorted to lysosomal compartments as shown by their colocalization with clathrin and specific markers of endosomes and lysosomes. OMVs from both strains did not affect cell viability, but reduce proliferation of HT-29 cells. Labeling of 8-oxo-dG adducts in DNA revealed that neither OMVs from EcN nor from ECOR12 promoted oxidative DNA damage. In contrast, flow cytometry analysis of phosphorylated γH2AX evidenced that OMVs from the probiotic EcN significantly produced more double strand breaks in DNA than ECOR12 OMVs. The EcN genotoxic effects have been attributed to the synthesis of colibactin. However, it is not known how colibactin is exported and delivered into host cells. Whether colibactin is secreted via OMVs is an open question that needs further study.


Conflict of interest statement

Competing Interests: The authors have declared that no competing interests exist.

Figures

Fig 1
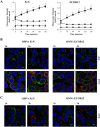
Fig 1. Uptake of EcN and ECOR12 OMVs in HT-29 cells.
(A) HT-29 cells were incubated at 37°C with rhodamine B-R18-labeled OMVs (2 μg/well) from strains EcN and ECOR12 (squares) and fluorescence was measured over time with a microplate reader. OMVs (circles) and cells (triangles) alone were analyzed in parallel as controls. Fluorescence intensity was normalized by fluorescence detected at the indicated time points by labeled OMVs in the absence of cells. Data are presented as means ± standard error from four independent experiments. Results significantly different from that of untreated control cells are indicated by an asterisk (P<0.006). (B, C) Visualization of internalized OMVs by florescence microscopy. HT-29 cells were incubated with rhodamine B-R18-labeled OMVs (B) or with unlabeled OMVs (C) for 1 and 3 h at 37°C. When indicated incubations were performed at 4°C as a control. The cell membrane was stained with WGA (green) and nuclei with DAPI (blue). Internalized rhodamine B-R18-labeled OMVs are visualized in red. In (C) vesicles were immunostained with E. coli anti-LPS antibody and Alexa Fluor 546-conjugated secondary antibody. Analysis was performed in a Leica TCS SP5 laser scanning confocal spectral microscope with 63x oil immersion objective lens, and images were captured with a Nikon color camera (16 bit). Scale bar: 20 μm.
Fig 2
Fig 2. Inhibitors of dymanin and clathrin-mediated endocytosis block internalization of EcN and ECOR12 vesicles.
HT-29 cells were pre-incubated for 1h at 37°C with (A) the lipid raft disrupting agents filipin III (triangles) or nystatin (circles), or with (B) the inhibitors of the clathrin-mediated endocytosis pathway chlorpromazine (circles) or dynasore (triangles) before adding rhodamine B-R18-labeled OMVs (2 μg/well) from strains EcN and ECOR12. Uptake experiments were performed in HT-29 cells in the absence of endocytosis inhibitors for comparison (squares). Fluorescence was measured over time with a microplate reader. Fluorescence intensity was normalized by fluorescence detected at the indicated time points by labeled OMVs in the absence of cells. Data are presented as means ± standard error from four independent experiments. Results significantly different from that of cells incubated with OMVs in the absence of endocytosis inhibitors are indicated by an asterisk (P<0.012). (C) Analysis by fluorescence microscopy of vesicle uptake in the presence of endocytosis inhibitors. HT-29 cells were pre-incubated with chlorpromazine or filipin III for 1 h before the addition of rhodamine B-R18-labeled OMVs (2 μg). After 1 h incubation, the cell membrane was stained with WGA (green) and nuclei with DAPI (blue). Internalized OMVs are visualized in red. Images are from a single representative experiment (n = 4). Scale bar: 20 μm.
Fig 3
Fig 3. Colocalization of EcN and ECOR12 OMVs with clathrin (A), endosomes (B) and lysosomes (C).
HT-29 cells were incubated with rhodamine B-R18-labeled OMVs (2 μg) for the indicated times and analyzed using laser scanning confocal spectral microscope. Scale bar: 20 μm. Clathrin was stained using anti-clathrin mouse monoclonal antibody and Alexa Fluor 488-conjugated goat anti-mouse IgG (green). Endosomes were labeled with a rabbit polyclonal antibody against the endosome-associated protein EEA1 and Alexa Fluor 488-conjugated goat anti-rabbit IgG (green). Lysosomes were detected using LysoTracker Green DND-26 at 300 nM (green). Images are from a single representative experiment (n = 4). Colocalization of the green (clathrin, EEA1 or the LysoTracker probe)) and red (vesicles) signals was confirmed by histogram analysis of the fluorescence intensities along the yellow lines. Analysis by laser scanning confocal spectral microscope was performed as described for Fig 1.
Fig 4
Fig 4. Effect of EcN and ECOR12 OMVs on proliferation and viability of HT-29 cells.
(A) Cell viability, (B) Mean proliferation index, (C) Population doubling level of HT-29 cells exposed to OMVs (5 μg/ml) from EcN (squares) or ECOR12 (triangles) for up to 7 days, measured by the trypan blue exclusion assay. In panel (C), control cells are indicated by circles. (D) MTT reduction activity measured along the experiment. Values are means ± standard error from four independent experiments (P<0.01, versus untreated control cells).
Fig 5
Fig 5. EcN and ECOR12 OMVs induce cell cycle arrest in HT-29 cells.
Cell cycle analysis of HT-29 cells challenged with OMVs (5 μg/ml) from strains EcN (gray bars) or ECOR12 (black bars) for up to 3 days. Non-treated cells were analyzed as a control (white bars). Cells were gated based on FSC and SSC and then by their area vs peak fluorescence signal for propidium iodide. A total of 10,000 events were analyzed for each sample. Values are means ± standard error from three independent experiments (P<0.02, versus untreated control cells).
Fig 6
Fig 6. DNA damage analysis in HT-29 cells exposed to EcN or ECOR12 OMVs.
(A) Immunofluorescence microscopy of mutagenic 8-oxo-dG adducts (green) in cell nuclei of cells challenged with the indicated OMVs (5 μg/ml) for 48 h. (B) Immunofluorescence microscopy of phosphorylated γH2AX (red) in cell nuclei of cells challenged with the indicated OMVs (5 μg/ml). Cells treated with 300 μM H2O2 for 24 h were processed in parallel as a positive control. Immunofluorescence microscopy images are from a single representative experiment (n = 3). (C) Flow cytometry analysis of phosphorylated γH2AX expression. Cells were gated using the FSC vs SSC double dot. A total of 10,000 events were analyzed for each sample. Data are presented as means ± standard error from three independent experiments. Results significantly different from that of untreated control cells are indicated by an asterisk (P<0.02).

References

    1. O’Hara AM, Shanahan F. The gut flora as a forgotten organ. EMBO Rep. 2006; 7: 688–693. 10.1038/sj.embor.7400731. - DOI - PMC - PubMed
    1. Garret WS, Gordon JI, Glimcher LH. Homeostasis and inflammation in the intestine. Cell. 2010; 140: 859–870. 10.1016/j.cell.2010.01.023 - DOI - PMC - PubMed
    1. Krishnan S, Alden N, Lee K. Pathways and functions of gut microbiota metabolism impacting host physiology. Curr Opin Biotechnol. 2015; 36: 137–145. 10.1016/j.copbio.2015.08.015 - DOI - PMC - PubMed
    1. Johansson ME, Phillipson M, Petersson J, Velcich A, Holm L, and Hansson GC. The inner of the two Muc2 mucin-dependent mucus layers in colon is devoid of bacteria. Proc Natl Acad Sci USA. 2008; 105: 15064–15069. 10.1073/pnas.0803124105 - DOI - PMC - PubMed
    1. Kulp A, Kuehn MJ. Biological functions and biogenesis of secreted bacterial outer membrane vesicles. Annu Rev Microbiol. 2010; 64: 163–184. 10.1146/annurev.micro.091208.073413 - DOI - PMC - PubMed