. 2016 Aug 11;536(7615):179-83.
doi: 10.1038/nature19068. Epub 2016 Aug 3.

SAR11 bacteria linked to ocean anoxia and nitrogen loss

SAR11 bacteria linked to ocean anoxia and nitrogen loss

Despina Tsementzi et al. Nature. .

Abstract

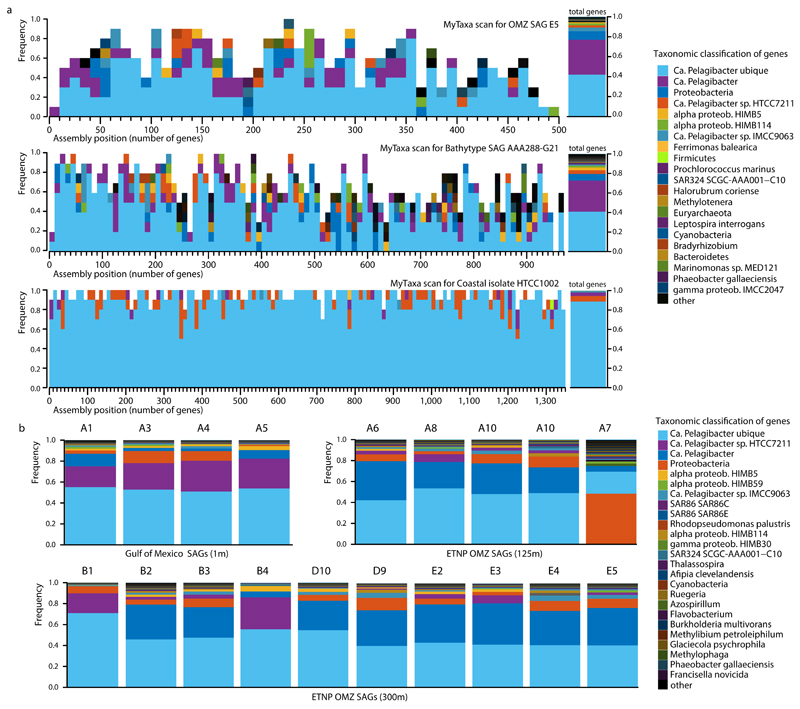
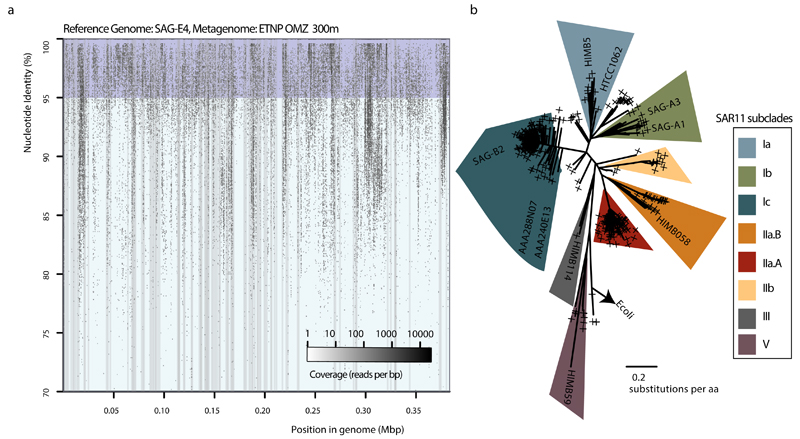
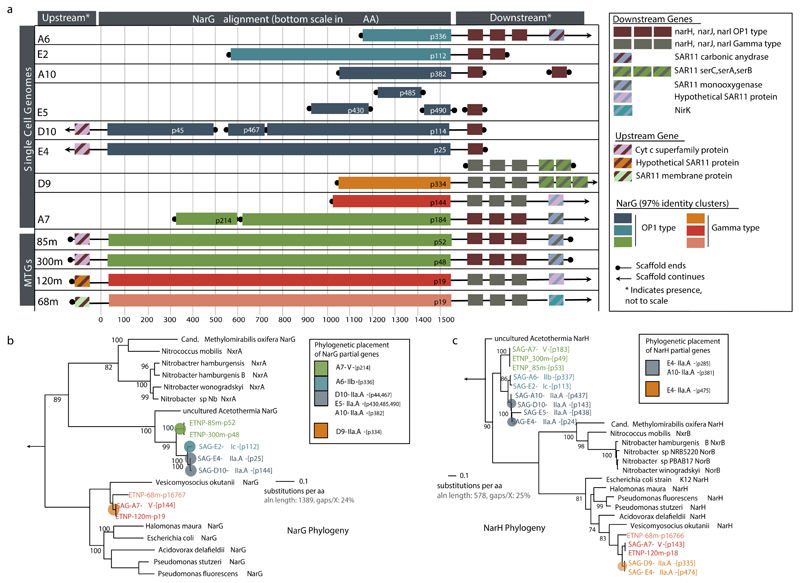
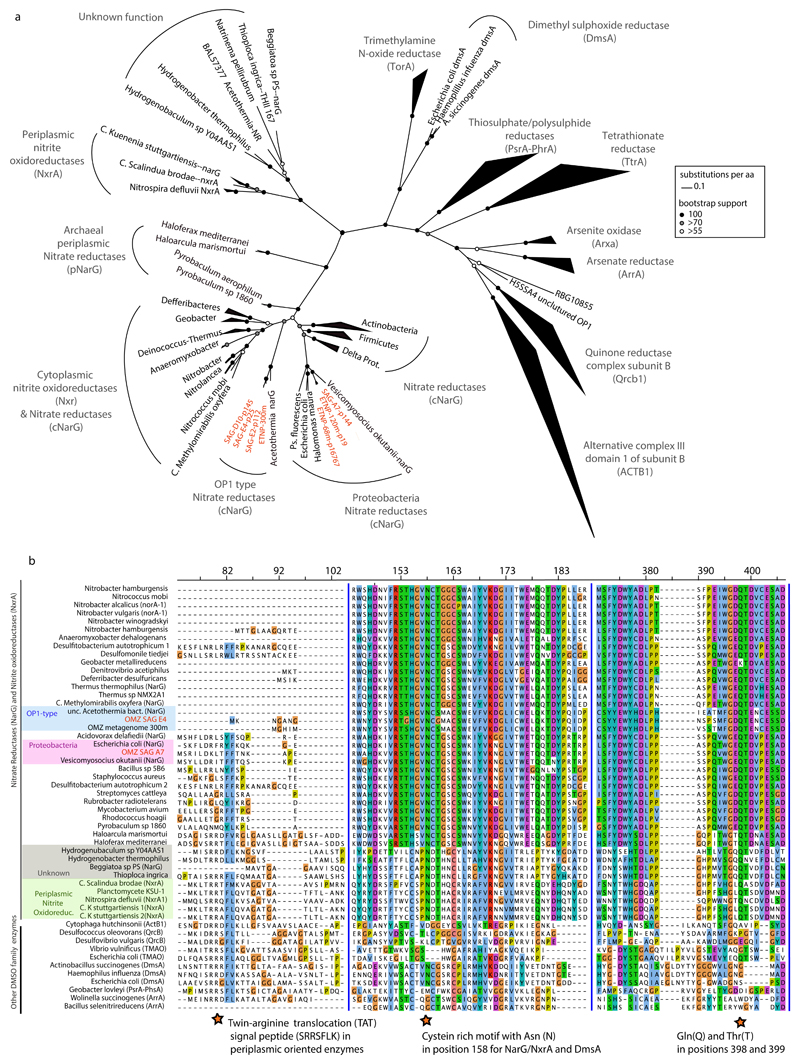
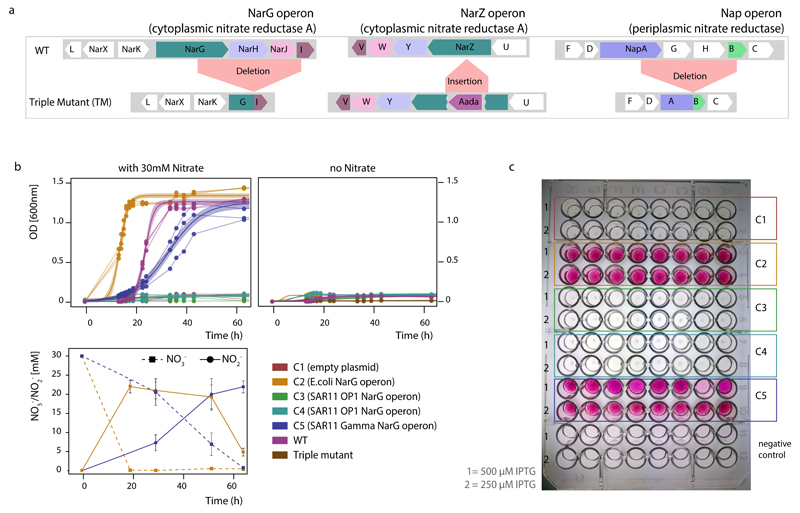
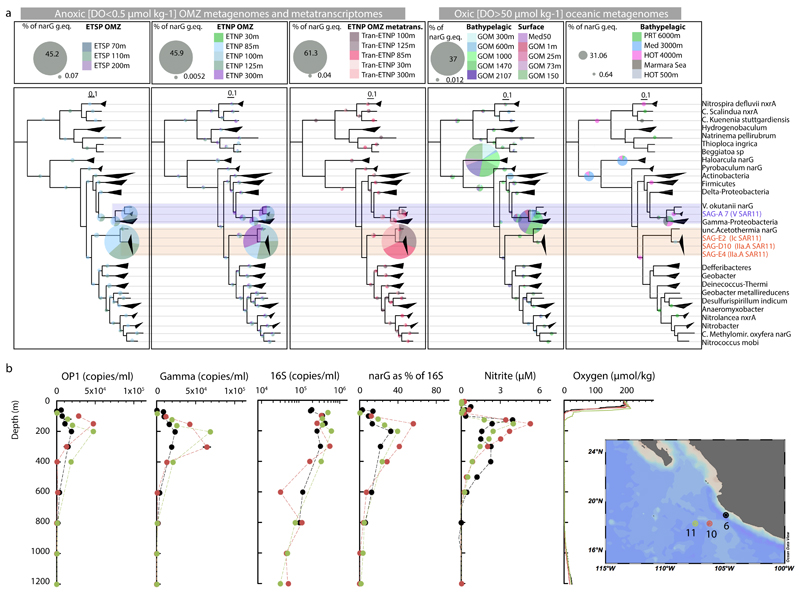
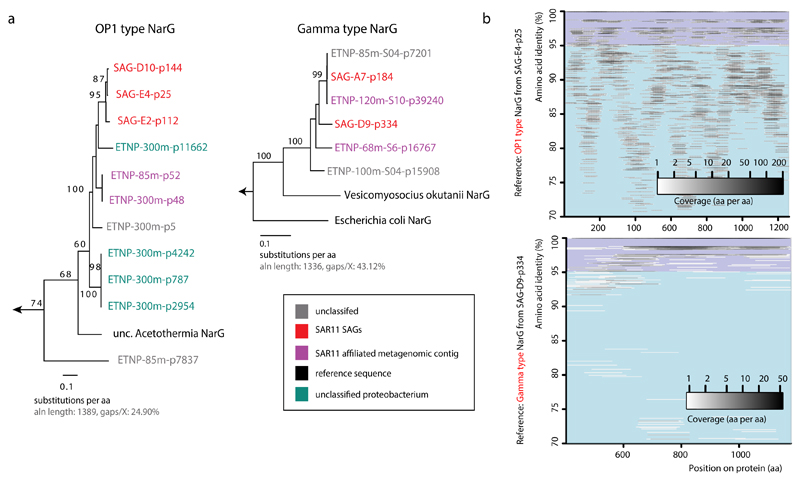
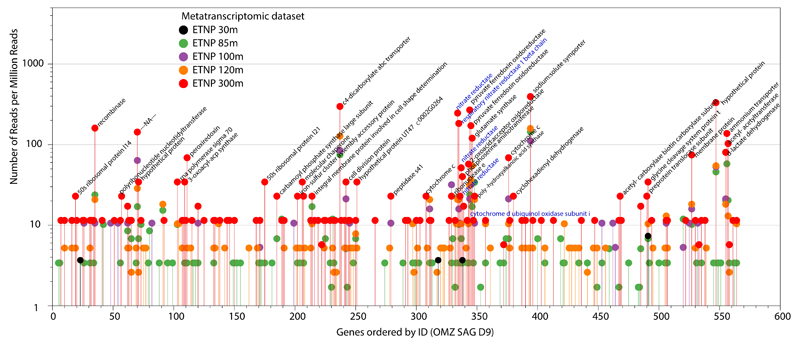
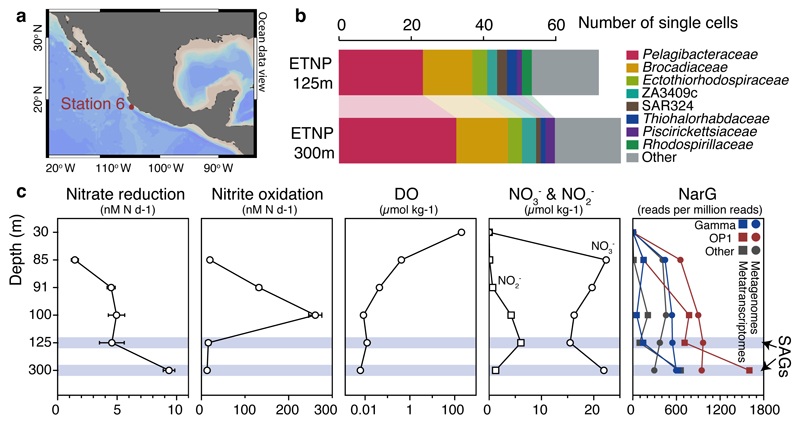
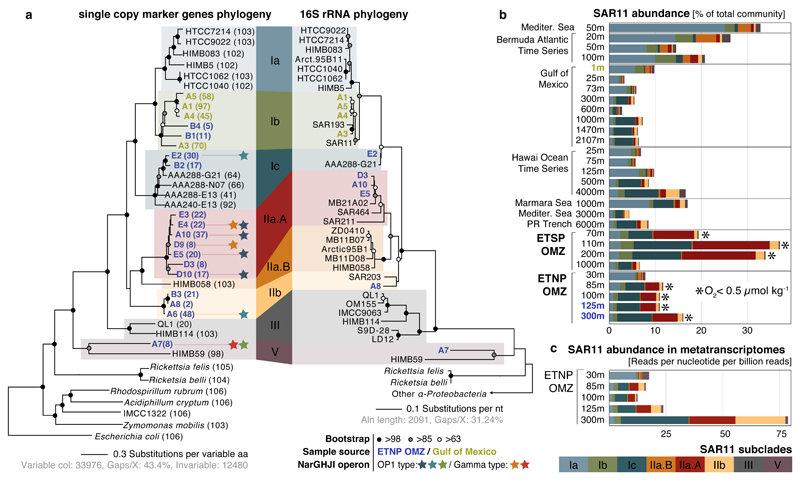
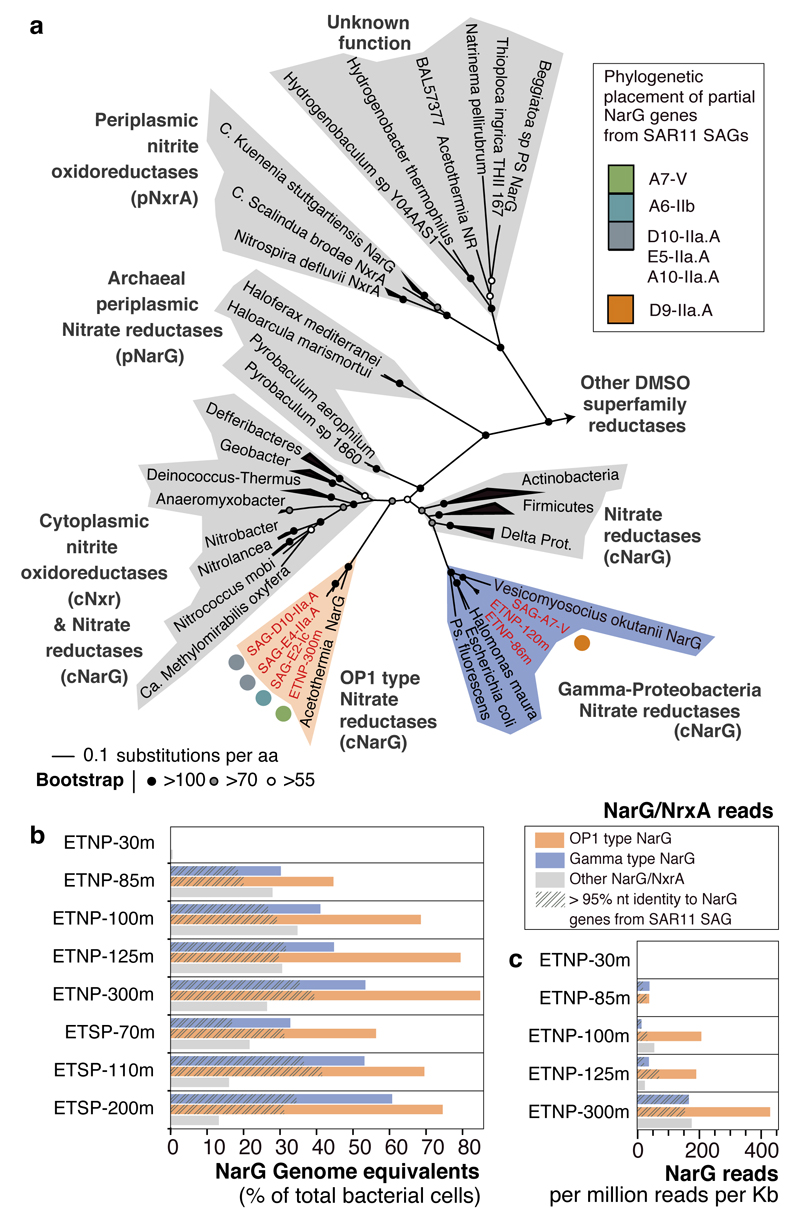
Bacteria of the SAR11 clade constitute up to one half of all microbial cells in the oxygen-rich surface ocean. SAR11 bacteria are also abundant in oxygen minimum zones (OMZs), where oxygen falls below detection and anaerobic microbes have vital roles in converting bioavailable nitrogen to N2 gas. Anaerobic metabolism has not yet been observed in SAR11, and it remains unknown how these bacteria contribute to OMZ biogeochemical cycling. Here, genomic analysis of single cells from the world's largest OMZ revealed previously uncharacterized SAR11 lineages with adaptations for life without oxygen, including genes for respiratory nitrate reductases (Nar). SAR11 nar genes were experimentally verified to encode proteins catalysing the nitrite-producing first step of denitrification and constituted ~40% of OMZ nar transcripts, with transcription peaking in the anoxic zone of maximum nitrate reduction activity. These results link SAR11 to pathways of ocean nitrogen loss, redefining the ecological niche of Earth's most abundant organismal group.


Conflict of interest statement

The authors declare no competing financial interests in association with this study.

Figures

Extended Data Figure 1
Extended Data Figure 1. Evaluation of contamination based on MyTaxa taxonomic affiliations.
a, Representative MyTaxa plots to test for contamination based on taxonomic affiliations of predicted genes. The MyTaxa algorithm predicts the taxonomic affiliation based on a weighted classification scheme that takes into account the phylogenetic signal of each protein family. Each gene is assigned to the deepest taxonomic resolution (out of phylum, genus, and species) for which a high confidence value can be obtained (score 0.5). Each MyTaxa scan represents taxonomic distributions of all the predicted genes for one genome, given in windows of 10 genes, and sorted based on their position in the concatenated assembly of the genome (when a partial genome is used). White space in the histograms represents genes that could not be assigned to a given taxon due to (a) lack of BLASTP hits against the reference database (a collection of closed and draft genomes) or (b) lack of high confidence scores. Notice that for the representative OMZ SAG E5, more than 80% of the genes can be classified as Candidatus Pelagibacter (SAR11), with an additional 10% assigned to Proteobacteria. Note there are no genome representatives for this taxon (i.e., SAR11 subclade IIa.A) in the database upon which MyTaxa is based. Similar results are obtained for the bathytype SAR11 SAG , as this genome also lacks representatives. The closed genome from a coastal isolate HTCC1002 is shown for comparison to demonstrate a typical pattern for cases when close relatives of the query genome are available in the reference database, as is the case for this isolate. b, Taxonomic classifications of genes from the 19 SAGs analyzed here. Each distribution was obtained from the MyTaxa scans performed for each SAG. The percentage of the total genes that could be taxonomically classified with MyTaxa was on average ~60%, and varied depending on the completeness of the genome (i.e., partial genes are less likely to be assigned taxonomy with high confidence). These values are also reported in Supplementary Table 1. Of the genes that could be classified, the majority (>90%) were classified to SAR11 taxa.
Extended Date Figure 2
Extended Date Figure 2. Microdiversity within the SAR11 populations.
a, Recruitment plot of metagenomic reads from the ETNP OMZ 300 m sample, against scaffolds from SAG E4. Notice that the recruited reads vary in identities from 100 down to 85%, indicating the presence of closely affiliated clades, as well as extensive microdiversity within the same clade (i.e., reads sharing >95% identity) b, Phylogenetic reconstruction of reference RpoB protein sequences from SAR11 genomes, and placement of identified RpoB metagenomic sequences (denoted with the cross symbols). The alignment length was 1406 columns with 5.9% gaps or undetermined sites. The presence of multiple divergent rpoB reads within the same subclade (predominantly for subclades IIa.A and Ic) suggests high abundance but also extensive microdiversity within those populations (rather than clonal populations).
Extended Date Figure 3
Extended Date Figure 3. nar genes encoded by SAR11 populations of OMZs.
a, nar operon and adjacent genes identified in SAR11 single amplified genomes (SAGs) from the ETNP OMZ, and in assemblies from the 85 m and 300 m ETNP OMZ metagenomes. narG sequences with at least 97% amino acid similarity are represented with the same color. b,c, Representative maximum likelihood phylogeny to show sequence variation among full or near full-length narG (b) and narH (c) amino acid sequences identified in the SAGs. A subset of cytoplasm-oriented nitrate reductases and nitrate oxidoreductases from publicly available genomes is also included. A comprehensive phylogeny showing the placement of SAR11 nar sequences relative to enzymes (n=392) of the DMSO family is in Fig. 2a. Colored pies represent the placement of shorter narG/narH gene fragments identified in the SAGs. Bootstrap values over 50 are shown. Outgroups (arrows) are Escherichia coli dmsA (b) and dmsB (c). Note: the Gamma-type nar-containing contig recovered in E4 (Fig. 2a) contains narHJI, but not narG; E4 Gamma-type is therefore not represented in Fig. 3b. All genes co-localized in the nar-containing contigs are listed in Supplementary Table 5. The p-numbers are gene IDs given by the gene prediction software, consistent with those in Supplementary Table 5.
Extended Data Figure 4
Extended Data Figure 4. Identified NarG in SAR11 SAGs are members of the DMSO superfamily of oxidoreductases.
a, Phylogenetic reconstruction of NarG and DMSO enzymes. The tree shown in Figure 2 is presented here but has been expanded to include diverse DMSO oxidoreductases for direct comparison with the NarG/NxrA enzymes. Notice that both OP1 (green, blue, grey) and Gamma-type (red, orange) variants cluster within the cytoplasmically oriented nitrate reductases and nitrite oxidoreductases. 697 NarG/NxrA proteins were identified from UniRef , and from those 321 full length sequences were selected to represent all the diverse clades. An additional 71 non-NarG/NxrA proteins, representative of the diverse enzymes of the DMSO superfamily were also included in the collection. The full-length amino acid sequences were aligned with Clustal Omega and the phylogenetic tree was constructed by maximum likelihood and 1000 bootstraps using RAxML . The alignment length was 1803 columns, out of which 31.2% were gaps or undetermined. Partial NarG sequences identified in the SAGs were placed on the tree using the epa algorithm from RAxML . The same collection of proteins was used to train the Rocker models and quantify the narG metagenomic fragments, and can be found in the enve-omics website (http://enve-omics.ce.gatech.edu/rocker/models). b, Alignment of NarG sequences from OMZ SAR11 with representative sequences from the DMSO superfamily of oxidoreductases. The protein motifs in the second and third panels are present in all functional nitrate reductases (NarG) and nitrite oxidoreductases (NxrA) but not in closely related enzymes of the DMSO superfamily. The first panel shows the presence/absence of the TAT signal peptide (SRRSFLK), whose presence typically denotes a protein excreted to the outer membrane ,. SAR11 NarG is instead oriented toward the cytoplasm (lack of TAT). The second panel shows the cysteine-rich motif typically found in the N-terminus of the type-II DMSO superfamily oxidoreductases and believed to enable the formation of a [4Fe–4S] cluster in these proteins . The Asn (N) in position 158 of the alignment is typically found in catalytic subunits of nitrite reductases and DMSO oxidoreductases (DmsA) but not in other DMSO family enzymes. The third panel shows the Gln(Q) and Thr(T) in positions 398 and 399 within the putative substrate entry channel of the protein, which differentiate the Nar proteins from all other oxidoreductases of the DMSO family .
Extended Data Figure 5
Extended Data Figure 5. Functional characterization of the SAR11 nar operons in the Escherichia coli heterologous expression system.
a, Genotype of the E. coli triple mutant confirmed by whole genome sequencing. The triple mutant lacks complete functional operons of all three NO3- reductases, and thus is incapable of NO3- reduction. b, Anaerobic growth of triple mutant clones, complemented with the SAR11 nar operons. For each strain three independent clones were monitored, and data from the replicate growth curves were fitted into a logistic model. Shaded areas represent the 95% confidence intervals of optical density readings (OD600nm) in the fitted logistic growth models. NO3- and NO2- were measured in parallel with ion chromatography. Note that the Gamma-type SAR11 operon complements the triple mutant phenotype, growing anaerobically by reducing NO3- to NO2-. E. coli encodes functional nitrite reductases, thus the accumulated NO2- can be further reduced to ammonia, accounting for the non-stoichiometric NO2- production. c, Whole cell NO2- production assays under aerobic conditions. Eight independent clones (columns A-H) of each type (C1-C5) were inoculated in LB supplemented with 30mM NO3- and different IPTG concentrations, and the well plate was incubated for 2 days at room temperature. Griess reagent was added, and development of pink color indicated NO2- production.
Extended Data Figure 6
Extended Data Figure 6. Relative abundance of narG variants in ETNP OMZ metagenomes and metatranscriptomes and various other ocean metagenomes.
a, Relative abundance and diversity of NarG/NxrA enzymes as revealed by phylogenetic placement of identified narG metagenomic reads (colored pies). All identified short metagenomic narG reads from various oceanic metagenomes were placed within a reconstructed reference NarG tree in order to estimate the abundance of the different narG variants. The results of the placement are presented in 5 separate trees, based on the origin of the analyzed metagenomic reads (ETSP metagenomes, ETNP metagenomes and metatranscriptomes, oxic bathypelagic and oxic surface metagenomes) for clarity. In each of the 5 trees, the colored pies represent the abundance (normalized for dataset size) of the short metagenomic reads clustering in the respective node. Specifically, the pie radius reflects read abundance as a percentage of the total narG genome equivalents identified (i.e., number of narG reads compared to number of rpoB reads, normalized for gene length and total number of reads in each metagenome), with the size of grey pies in the legends representing the highest and lowest relative abundance, respectively. The reference tree is the same as in Figure 3a. Scale bars represent substitutions per amino acid. Notice that the two narG variants affiliated with the SAR11 SAGs (highlighted in orange for the OP1 type and blue for the Gamma type) are only abundant in the metagenomes and metatranscriptomes from the OMZ, where they comprise more than 70% of the total narG read pool, as can also be observed in Figure 3b and c. The number of narG reads of the OP1 or Gamma type are also given in Supplementary Table 1. b, qPCR-based abundance of SAR11 affiliated narG genes in the ETNP OMZ relative to nitrite, nitrate, and oxygen concentrations OMZ and qPCR-based counts of 16S rRNA. Counts of total bacterial 16S rRNA, OP1-type narG, and Gamma-type narG genes at three stations (map on legend) west of Manzanillo, Mexico in May 2014. Map was created with Ocean Data View (Schlitzer, R., odv.awi.de, 2015). All assays were performed in triplicates, and the bars represent standard errors. Note: counts of OP1 and Gamma-type narG variants are likely underestimates given the observed microdiversity in the community (Extended Data Fig. 2 and 7), and therefore the possibility that our primers did not match all OP1 and Gamma-type variants.
Extended Data Figure 7
Extended Data Figure 7. Diversity of OP1 and Gamma-type narG amino acid sequences in the ETNP OMZ metagenome.
a, Phylogenies showing all full-length narG sequences recovered in the ETNP OMZ metagenomes (85, 100, 125, 300 m), as well as those from the SAR11 SAGs and corresponding narG reference sequences, with the left tree showing OP1-type variants and the right tree showing Gamma-type variants. NarG sequences are color-coded based on the taxonomic classification of adjacent genes in the same metagenomic scaffolds, as show in Supplementary Table 6. b, Recruitment of metagenomic reads (predicted open reading frames) from the OMZ 300 m sample, against OP1 (left) or Gamma (right) type narG sequences from the SAR11 SAGs. The metagenomic reads used for recruitment were identified as “narG” using the ROCker pipeline, and their identity further confirmed by phylogenetic placement within the narG clade on a reference DMSO superfamily protein tree, in order to minimize non-specific recruitments in conserved protein regions. Notice that based on this analysis, the OP1 type narG variants are highly diverse in the OMZ metagenome.
Extended Data Figure 8
Extended Data Figure 8. Transcriptional profile of predicted genes from the SAR11 OMZ SAG-D9.
Transcriptomic reads with >99% identity matches were counted for each gene, and the counts were normalized for the dataset size. Note that the nar operon genes are among the most actively transcribed in the ETNP 300m OMZ sample.
Figure 1
Figure 1. Site description and phylogenetic affiliation of single cells.
a, Location of station 6 (red) in the ETNP from which samples were obtained. Map was created with Ocean Data View (Schlitzer, R., odv.awi.de, 2015). b, Taxonomic classification of sorted single cells, based on their 16S rRNA genes. c, Nitrate reduction and nitrite oxidation rates relative to dissolved O2 (DO), nitrate, and nitrite concentrations and narG read abundance in metagenomes and metatranscriptomes. Error bars represent standard error from triplicate measurements. Note that a log10 scale is used for the DO plot and that 0.01 µmol kg-1 represents the detection limit of the STOX sensor oxygen data presented here. DO at 300 m was below the detection limit.
Figure 2
Figure 2. Diversity, abundance, and transcription of nitrate-reducing SAR11.
a, Maximum likelihood phylogeny based on the concatenated alignment of single copy housekeeping (left) and 16S rRNA (right) genes in SAGs from this study, SAR11 and representative alphaproteobacterial genomes. Values in parentheses denote the number of housekeeping genes used per genome. For the 16S-based tree, only full-length sequences from the genomes in the left tree were included. Star symbols of the same color represent closely related narG genes (>97% aa identity), encoding the catalytic subunit of the respiratory nitrate reductase of the DMSO family. b, Abundance of SAR11 subclades (left) in selected oceanic metagenomes. Note that the major nar-encoding clade IIa.A peaks in abundance at oxygen-depleted OMZ depths. Dataset descriptions are available in Supplementary Table 1. c, Normalized average coverage of SAR11 subclades in ETNP metatranscriptomes. Transcription by nar-encoding lineages increases from the base of the oxycline (85 m) to spike at the OMZ core (300 m), but is negligible in the overlying oxic zone (30 m).
Figure 3
Figure 3. Diversity, abundance, and transcription of nitrate reductase enzymes in the OMZ.
a, Phylogenetic reconstruction of NarG sequences identified in the SAR11 SAGs and metagenomic SAR11 contigs (ETNP prefix), along with reference NO3- reductase and NO2- oxidoreductase enzymes. Partial gene sequences (represented with colored pies) were subsequently added to the pre-constructed tree with phylogenetic placement. b, Relative abundance of NarG/NxrA enzymes in OMZ metagenomic datasets. Abundance was normalized to the rpob gene abundance and thus represents genome equivalents, or the portion of OMZ bacterial cells that encode the enzyme. c, Relative expression of NarG/NxrA proteins in the ETNP transcriptomes.

References

    1. Brown MV, Schwalbach MS, Hewson I, Fuhrman JA. Coupling 16S-ITS rDNA clone libraries and automated ribosomal intergenic spacer analysis to show marine microbial diversity: development and application to a time series. Environ Microbiol. 2005;7:1466–1479. - PubMed
    1. Carlson CA, et al. Seasonal dynamics of SAR11 populations in the euphotic and mesopelagic zones of the northwestern Sargasso Sea. ISME J. 2008;3:283–295. - PubMed
    1. Eiler A, Hayakawa DH, Church MJ, Karl DM, Rappé MS. Dynamics of the SAR11 bacterioplankton lineage in relation to environmental conditions in the oligotrophic North Pacific subtropical gyre. Environ Microbiol. 2009;11:2291–2300. - PubMed
    1. Morris RM, et al. SAR11 clade dominates ocean surface bacterioplankton communities. Nature. 2002;420:806–810. - PubMed
    1. Salter I, et al. Seasonal dynamics of active SAR11 ecotypes in the oligotrophic Northwest Mediterranean Sea. ISME J. 2015;9:347–360. - PMC - PubMed

Publication types

MeSH terms