
Emergence of a Homo sapiens-specific gene family and chromosome 16p11.2 CNV susceptibility

Xander Nuttle et al. Nature. .

Abstract

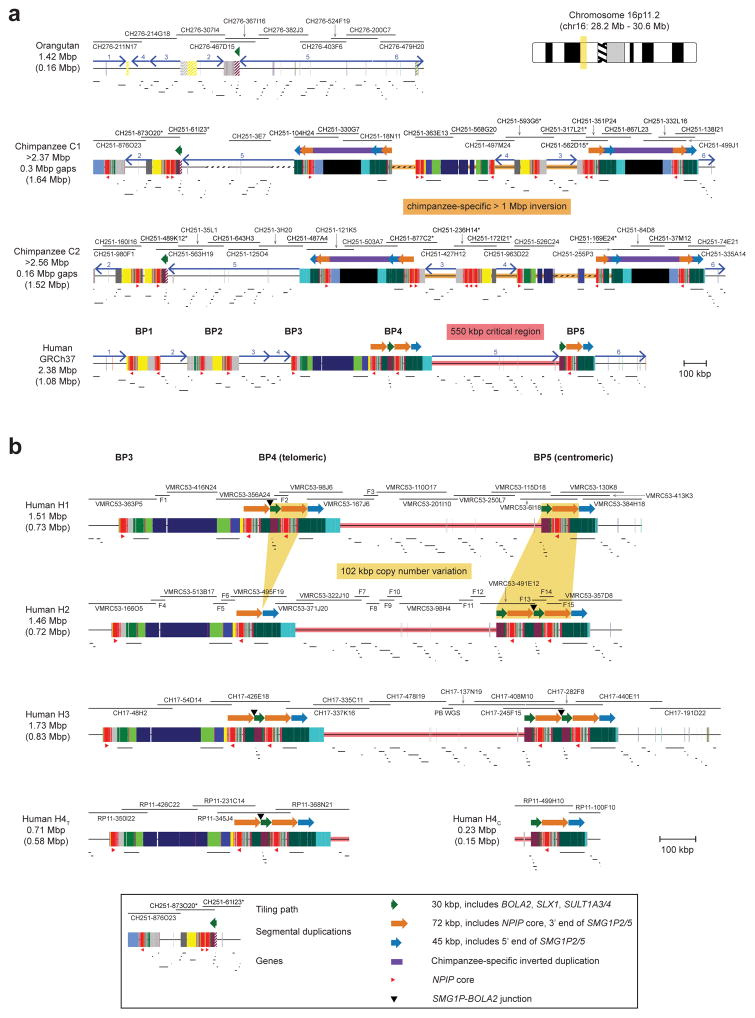
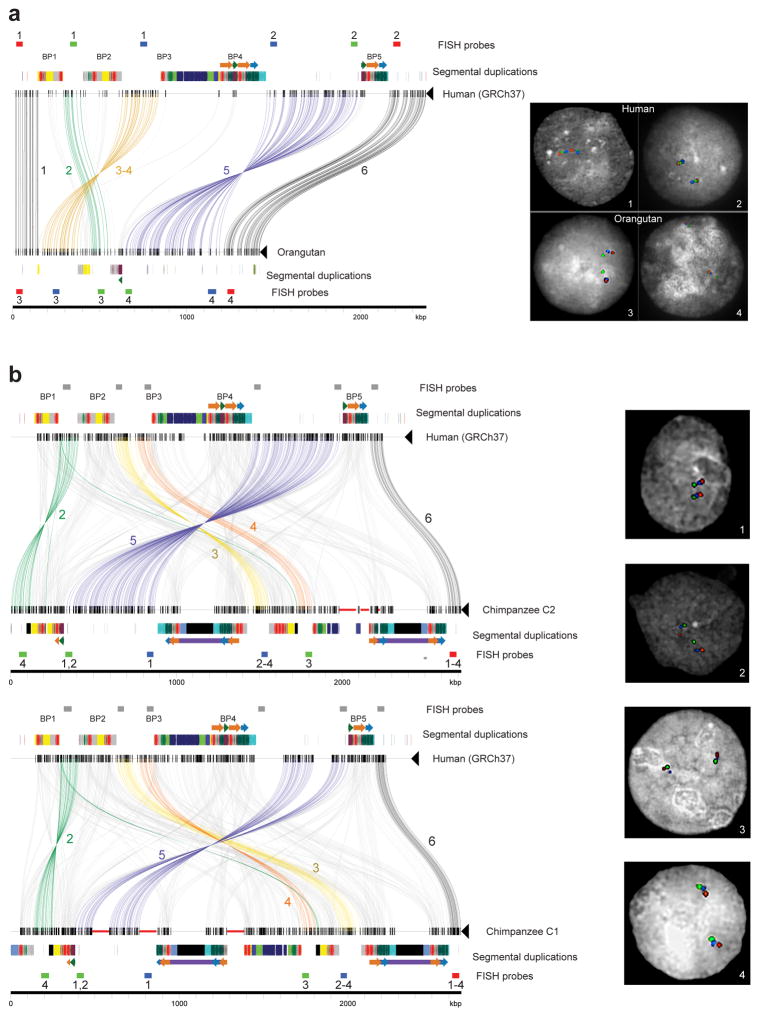
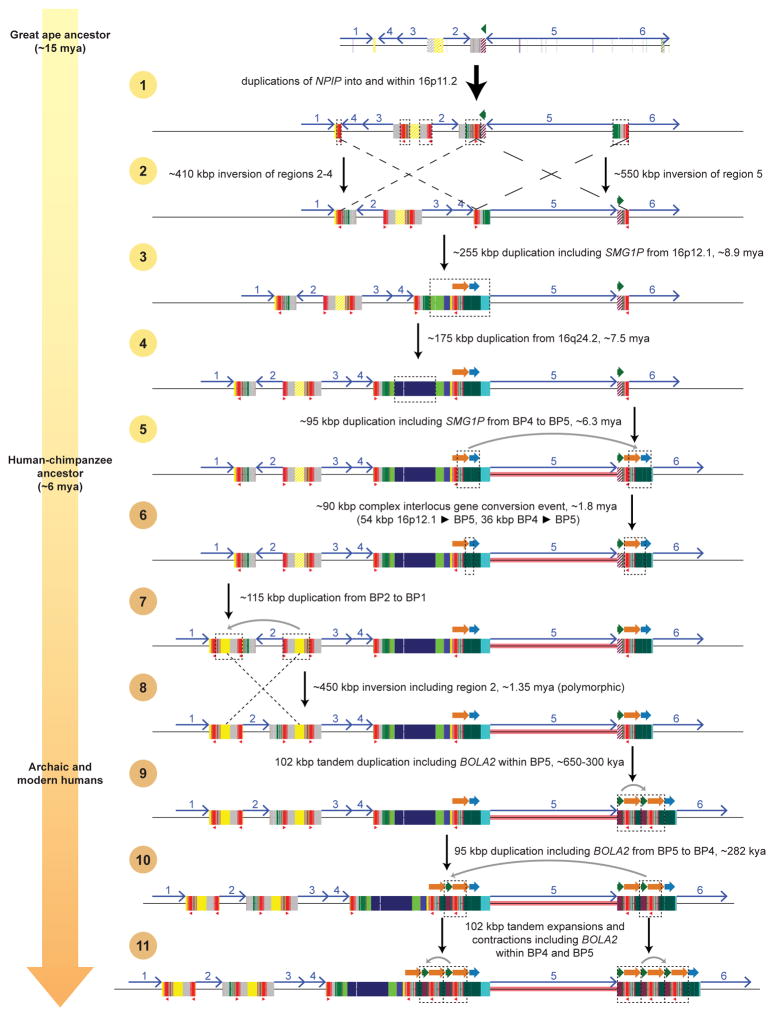
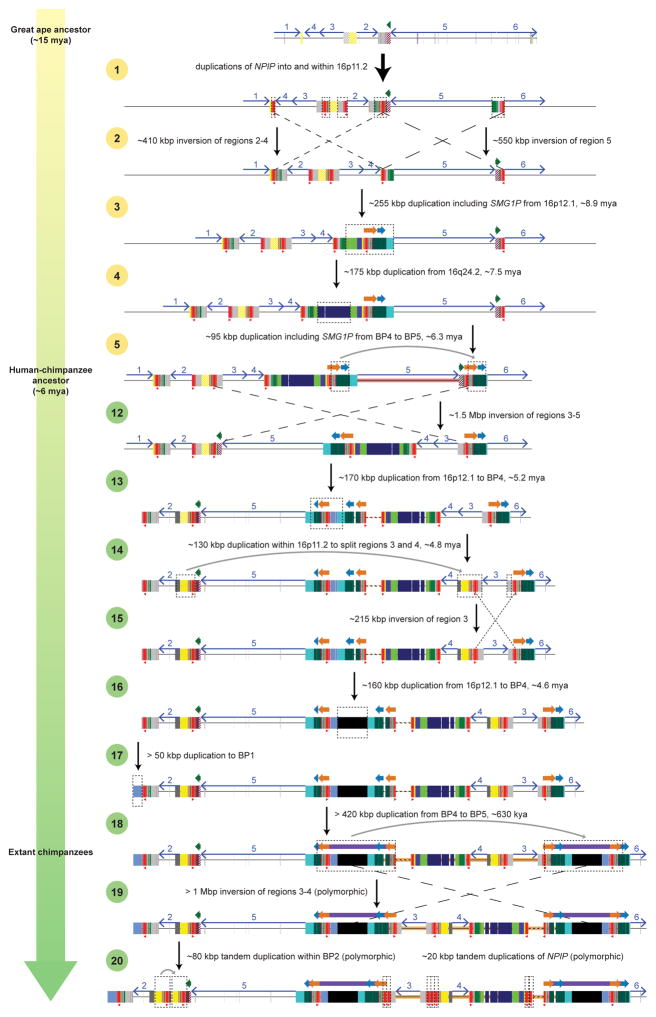
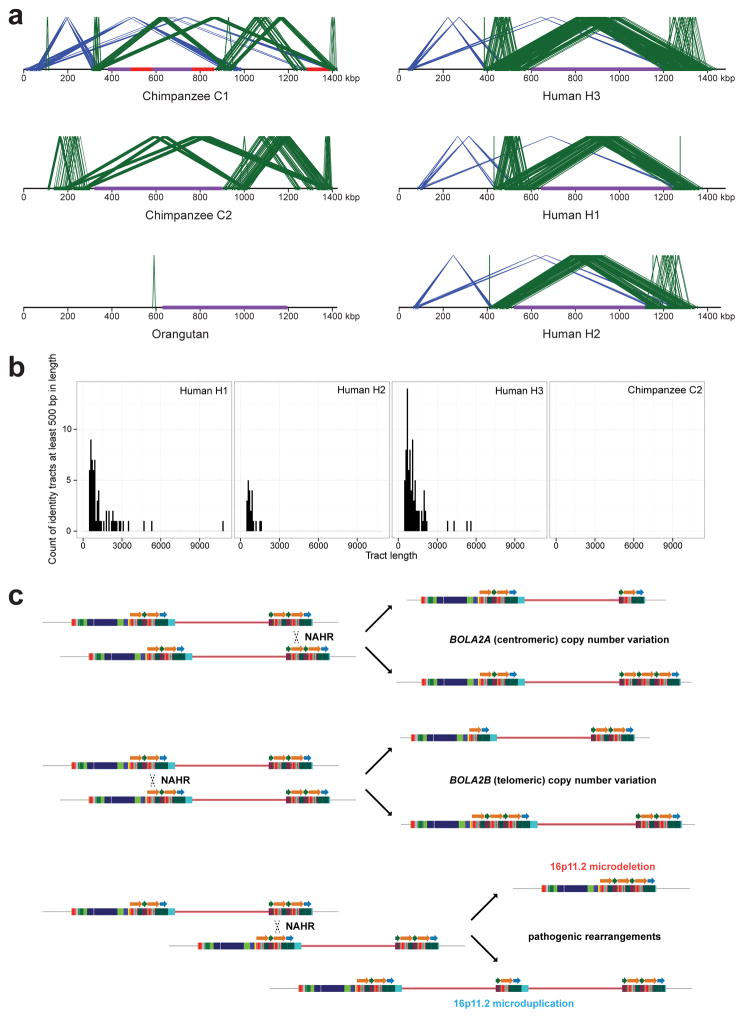
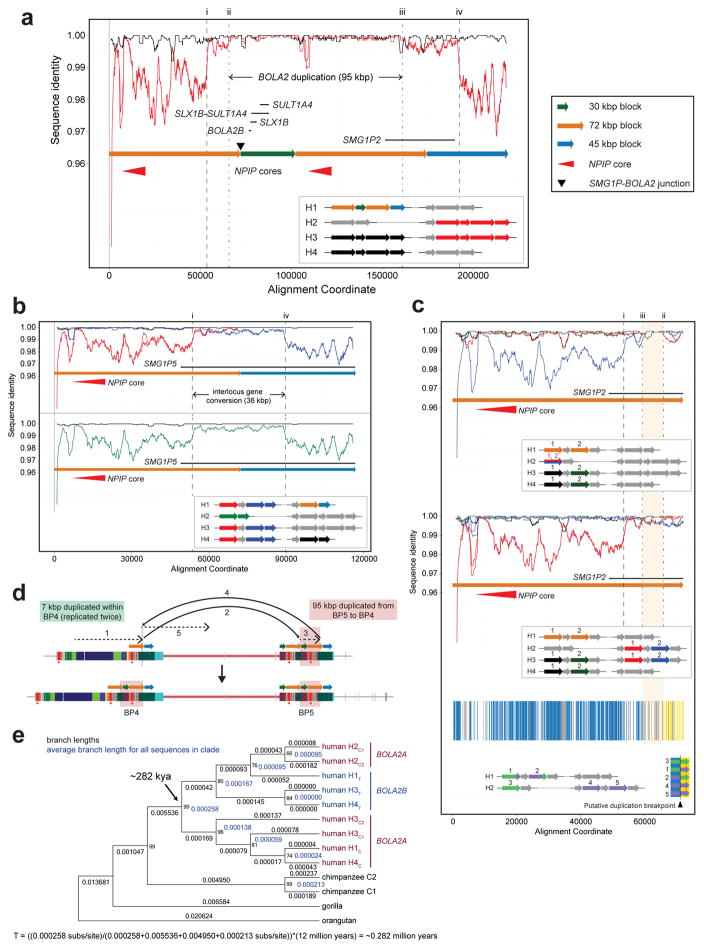
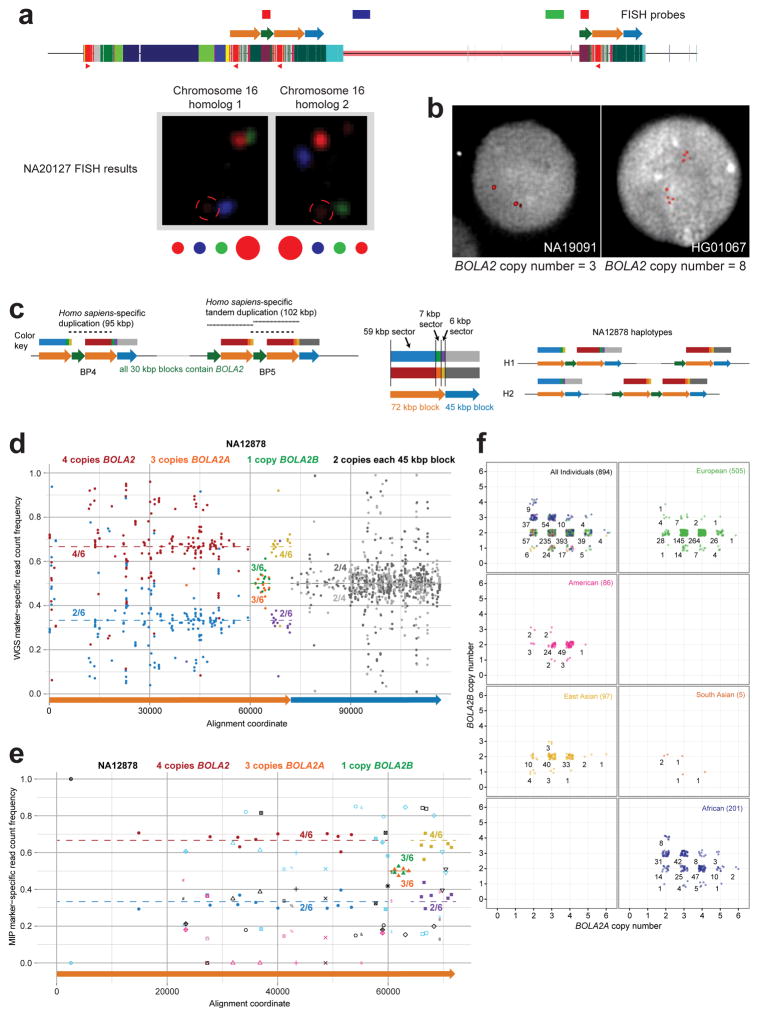
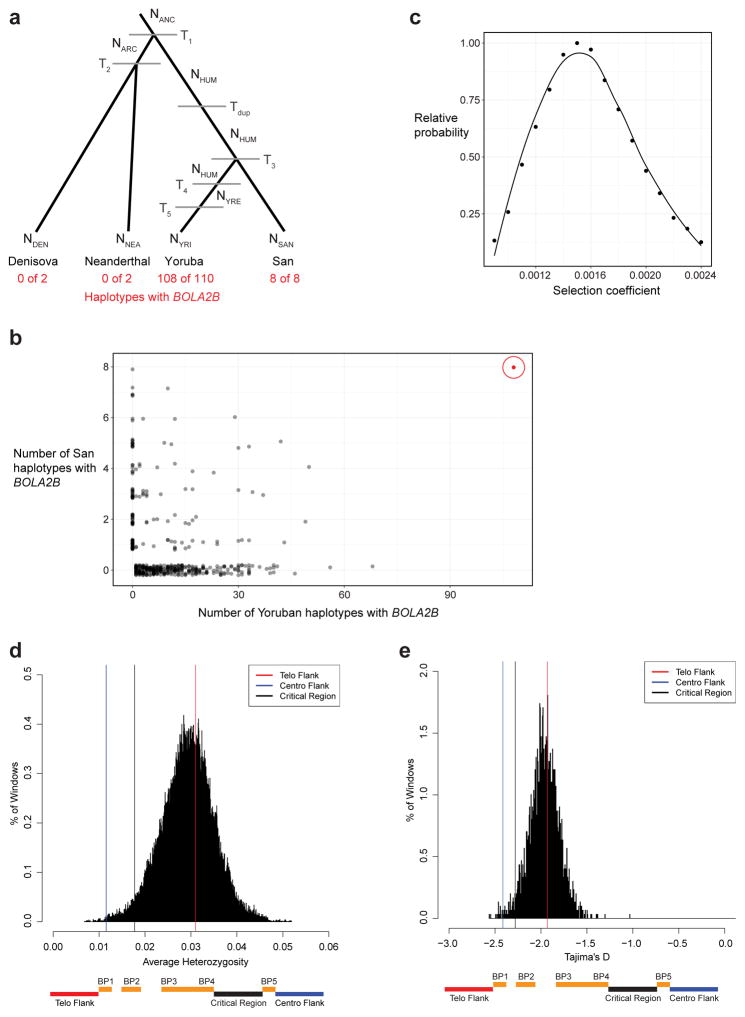
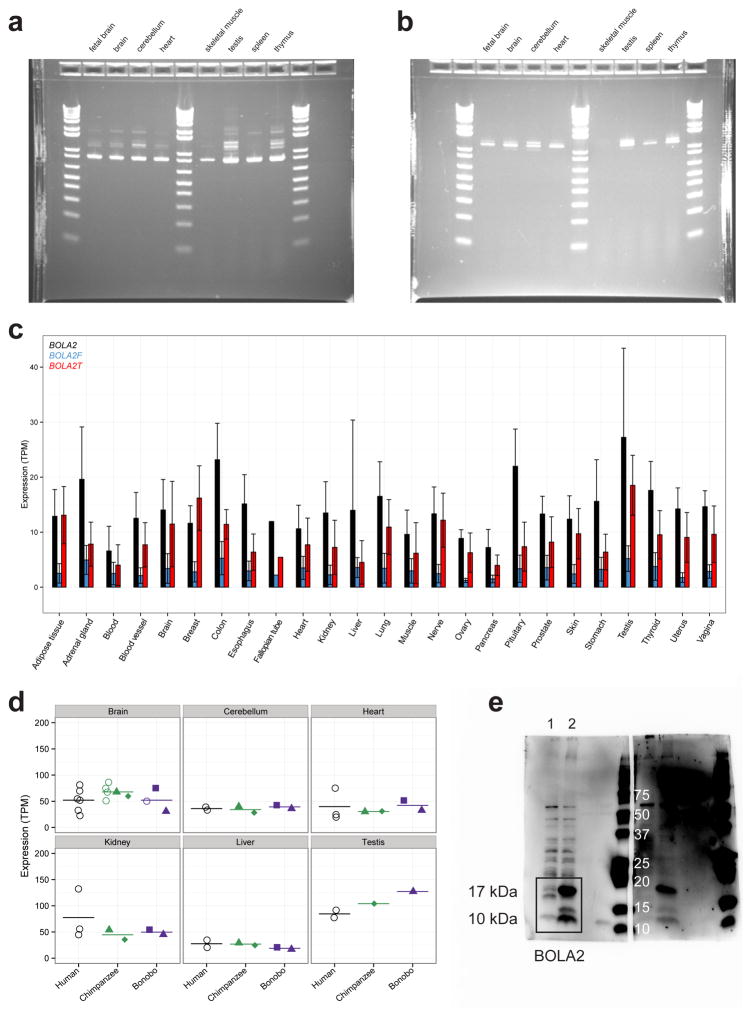
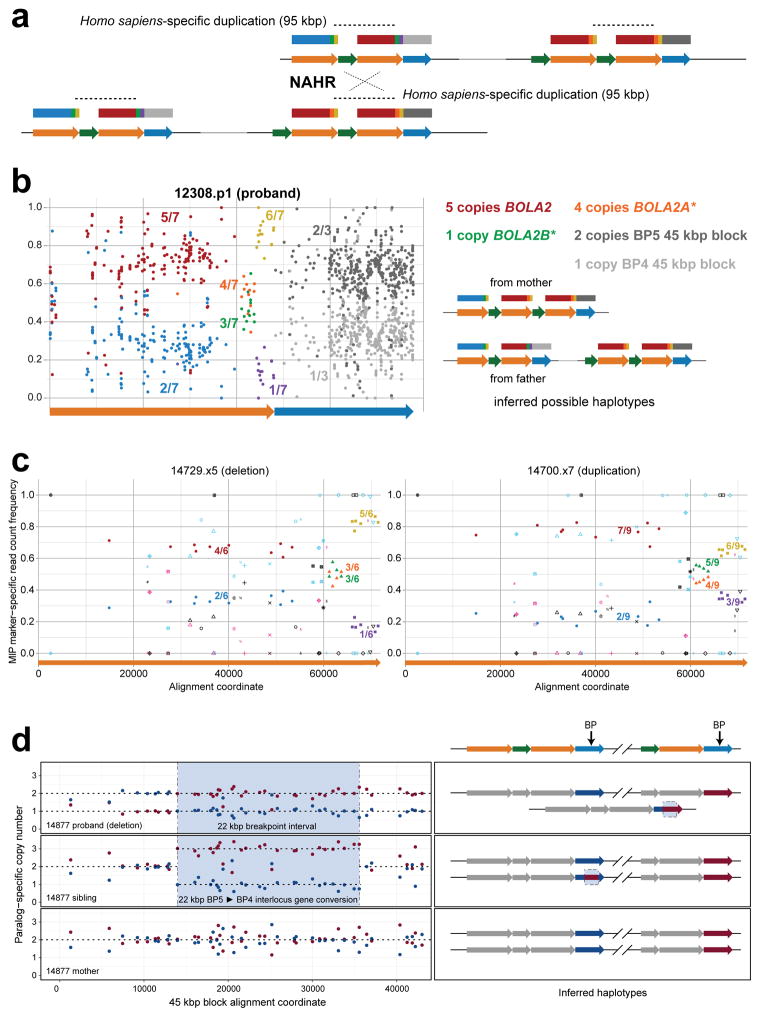
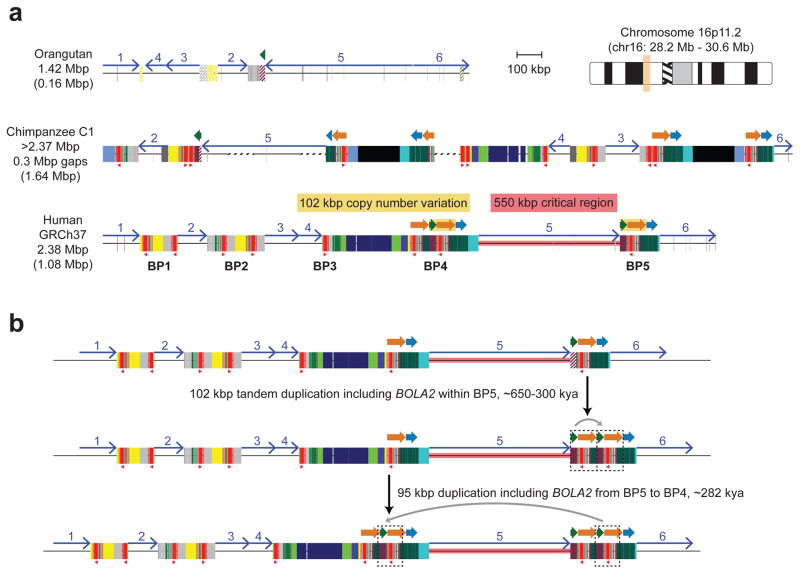
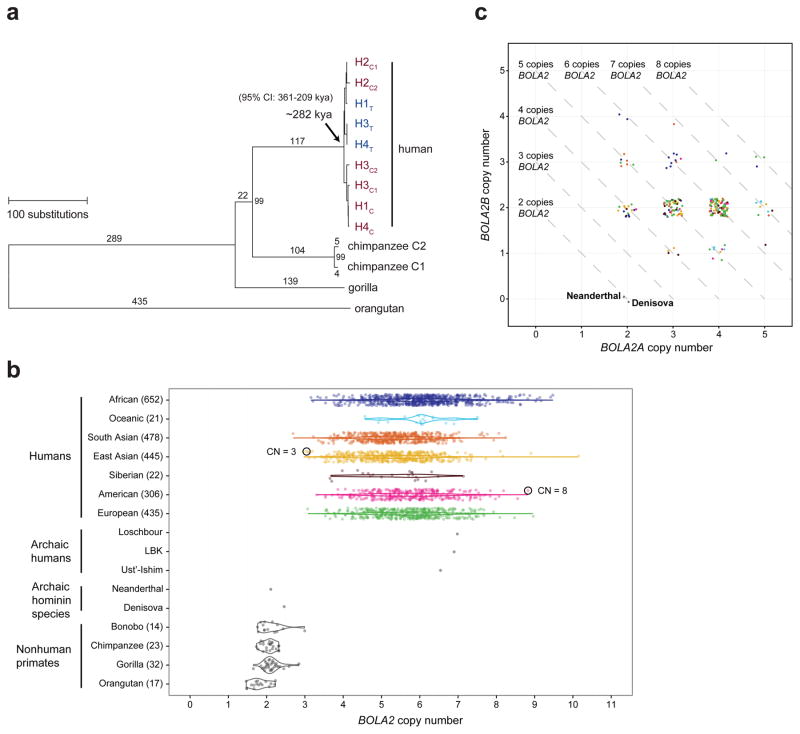
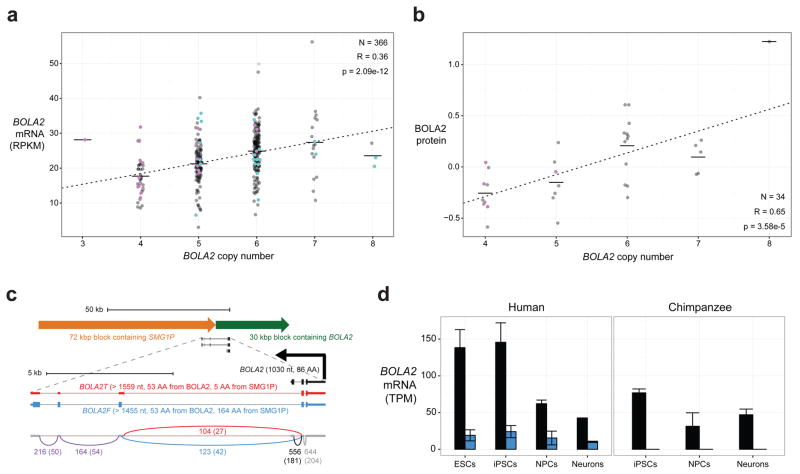
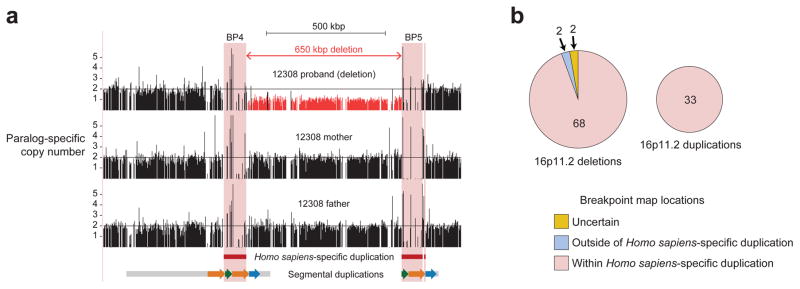
Genetic differences that specify unique aspects of human evolution have typically been identified by comparative analyses between the genomes of humans and closely related primates, including more recently the genomes of archaic hominins. Not all regions of the genome, however, are equally amenable to such study. Recurrent copy number variation (CNV) at chromosome 16p11.2 accounts for approximately 1% of cases of autism and is mediated by a complex set of segmental duplications, many of which arose recently during human evolution. Here we reconstruct the evolutionary history of the locus and identify bolA family member 2 (BOLA2) as a gene duplicated exclusively in Homo sapiens. We estimate that a 95-kilobase-pair segment containing BOLA2 duplicated across the critical region approximately 282 thousand years ago (ka), one of the latest among a series of genomic changes that dramatically restructured the locus during hominid evolution. All humans examined carried one or more copies of the duplication, which nearly fixed early in the human lineage--a pattern unlikely to have arisen so rapidly in the absence of selection (P < 0.0097). We show that the duplication of BOLA2 led to a novel, human-specific in-frame fusion transcript and that BOLA2 copy number correlates with both RNA expression (r = 0.36) and protein level (r = 0.65), with the greatest expression difference between human and chimpanzee in experimentally derived stem cells. Analyses of 152 patients carrying a chromosome 16p11. rearrangement show that more than 96% of breakpoints occur within the H. sapiens-specific duplication. In summary, the duplicative transposition of BOLA2 at the root of the H. sapiens lineage about 282 ka simultaneously increased copy number of a gene associated with iron homeostasis and predisposed our species to recurrent rearrangements associated with disease.


Conflict of interest statement

COMPETING FINANCIAL INTERESTS

E.E.E. is on the scientific advisory board (SAB) of DNAnexus, Inc., and is a consultant for the Kunming University of Science and Technology (KUST) as part of the 1000 China Talent Program.

Figures

Extended Data Figure 1
Extended Data Figure 1. Comparative sequence analysis of chromosome 16p11.2 among apes
a) Schematic depicts the genomic organization of chromosome 16p11.2 for one orangutan and two chimpanzee haplotypes along with the human reference haplotype (GRCh37 chr16:28195661–30573128; see ideogram for approximate chromosomal location). Blocks of segmental duplications within this locus mediate recurrent rearrangements in humans; thus, these blocks have been defined as breakpoint regions BP1–BP5 (ref. 8). The ~550 kbp critical region (pink) and a >1 Mbp chimpanzee-specific inversion polymorphism (orange) are highlighted. Tiling paths of sequenced clones are indicated above each haplotype, with chimpanzee clones that could not be fully resolved marked with asterisks. Colored boxes and thick arrows indicate the extent and orientation of segmental duplications (with different colors denoting duplicons from different ancestral genomic loci, and hashed boxes indicating sequence duplicated in humans but not in the species represented). Thin numbered arrows show orientations of gene-rich regions of unique sequence. Numbers (left) indicate the size of each orthologous haplotype, with the number of segmentally duplicated base pairs shown in parentheses. Note that, for chimpanzee, these sizes are lower bounds due to gaps in the contigs (dotted line sections) and the contigs not reaching unique sequence beyond BP1 (i.e., unique region 1). b) Schematic depicts distinct human structural haplotypes over the chromosome 16p11.2 critical region and flanking sequences (three complete haplotypes extending from unique sequence distal to BP3 to unique sequence proximal to BP5 and one partial haplotype including BP3–BP4 and BP5 sequence contigs). High-quality sequence for each haplotype was generated by sequencing a total of 40 BACs and 15 fosmids from three different human genomic libraries. Regions of copy number variation (highlighted in yellow along the first two haplotypes) occur on both sides of the critical region and involve the same 102 kbp unit in direct orientation, including a 30 kbp block containing BOLA2 and two other genes and a 72 kbp block harboring a partial segmental duplication of SMG1 (SMG1P). Expansion and contraction of this cassette underlie hundreds of kbp of structural diversity between human haplotypes. BOLA2 paralog-specific copy number genotype data suggest that H1 and H3 likely represent the most common haplotype structures in humans.
Extended Data Figure 2
Extended Data Figure 2. Comparison of chromosome 16p11.2 structure between apes
a) Sequences (thin horizontal lines) from human (GRCh37 chr16:28195661–30573128) and orangutan (contig sequence) at chromosome 16p11.2 are compared using Miropeats (s = 1,000) and annotated with locations of human segmental duplications and FISH probes used to validate the organization of the region. Lines connecting the sequences show regions of homology, and line colors highlight differences in the order and orientation of distinct gene-rich regions of unique sequence across the locus (numbered 1–6). Numbers below FISH probes correspond to numbers within the images on the right, specifying which probes were used in each experiment. Experiment 1 used the same probes as experiment 3, and experiment 2 used the same probes as experiment 4. Three-color interphase FISH on human and orangutan chromosomes confirms the accuracy of our assembled orangutan contig. b) Sequences (thin horizontal lines) from human (GRCh37 chr16:28195661–30573128) and two chimpanzee structural haplotypes at chromosome 16p11.2 are compared using Miropeats (s = 1,500) and annotated with locations of human segmental duplications and FISH probes used to validate the organization of the region. Thick red horizontal lines indicate gaps in the chimpanzee contigs, and black boxes correspond to chimpanzee-specific segmental duplications (i.e., sequences not duplicated in humans). Lines connecting the sequences show regions of homology, and line colors highlight differences in the order and orientation of distinct gene-rich regions of unique sequence across the locus (numbered 2–6). Numbers below FISH probes correspond to numbers within the images on the right, specifying which probes were used in each experiment. Gray rectangles show mapping locations of FISH probes in human. Three-color interphase FISH on chimpanzee chromosomes confirms the accuracy of our assembled contigs.
Extended Data Figure 3
Extended Data Figure 3. Dynamic evolution of human chromosome 16p11.2
a) A model for the evolution of the chromosome 16p11.2 BP1–BP5 region (ref. 8) during great ape evolution. The schematic depicts structural changes over time leading to the present-day human architecture (see Supplementary Information for details). The orangutan structure (top) is largely devoid of segmental duplications and deemed to represent the ape ancestral organization because it is conserved with mouse. Subsequent steps were inferred based on phylogenetic reconstruction, origins of the duplicated sequences, and the most parsimonious path with respect to changes in gene order (inversions). (See Supplementary Information for a detailed discussion of all supporting evidence and confidence levels for each step.) Note that, without access to genomes containing intermediate chromosome 16p11.2 structures, it is impossible to know with certainty the entire step-by-step evolutionary history. Some details presented here may not be accurate.
Extended Data Figure 4
Extended Data Figure 4. Dynamic evolution of chimpanzee chromosome 16p11.2
A model for the evolution of the chromosome 16p11.2 BP1–BP5 region (ref. 8) during great ape evolution. The schematic depicts structural changes over time leading to the present-day chimpanzee architecture (see Supplementary Information for details and discussion of all supporting evidence and confidence levels for each step.).
Extended Data Figure 5
Extended Data Figure 5. Comparison of duplications around the chromosome 16p11.2 autism critical region among apes and NAHR model underlying CNV at human chromosome 16p11.2
a) Local directly oriented (green) and inversely oriented (blue) intrachromosomal segmental duplications flanking the chromosome 16p11.2 autism critical region (purple) are visualized using Miropeats (s = 1,000). Gaps in the chimpanzee C1 contig are shown in red. The smaller size (<50 kbp) and lower average sequence identity (at most 98.6%) of directly oriented duplications flanking the critical region in chimpanzee compared to human haplotypes including BOLA2 on both sides of the critical region (at least 147 kbp of directly oriented duplications having at least 99.3% average sequence identity) suggest that susceptibility to NAHR resulting in microdeletions and microduplications at this locus evolved specifically in humans. b) Perfect sequence identity tract lengths (>500 bp) within directly oriented duplications flanking the critical region for human vs. chimpanzee. Histograms show counts of tracts of perfect sequence identity (lacking single-nucleotide variants and indels) between directly oriented segmental duplications of interest within each indicated haplotype and the distribution of these tracts over different size ranges. Human haplotypes having BOLA2 on both sides of the critical region (bottom panels) contain the highest number of such tracts and the longest such tracts, including one tract spanning 10,774 bp. In contrast, the longest tract of perfect sequence identity between duplications of interest in chimpanzee (considering both the C1 and C2 haplotypes) spans 450 bp. c) NAHR model underlying normal and disease-associated CNV at human chromosome 16p11.2.
Extended Data Figure 6
Extended Data Figure 6. Sequence refinement of interspersed BOLA2 duplication breakpoints, inference of BOLA2 duplication mechanism, and phylogenetic BOLA2 duplication timing
a) H1 human BP4 sequence (orange, green, orange, and blue arrows in inset) was aligned to its allelic (black arrows in inset) and paralogous (red arrows in inset) counterparts. The sequence identity for each alignment was computed and plotted over 2 kbp windows, sliding by 100 bp. Black lines indicate sequence identity for allelic comparisons, whereas red lines correspond to paralogous comparisons. While the allelic comparisons exhibit uniform, near-perfect sequence identity across the entirety of the alignment, paralogous comparisons reveal three distinct levels of sequence identity, with the highest level in the middle. This pattern suggests that the BOLA2 duplication (highest-identity region, 95 kbp) landed within an evolutionarily older segmental duplication having paralogs at BP4 and BP5. Dashed vertical lines (numbered i–iv) indicate putative breakpoints for events that occurred after this older segmental duplication. Junction sequence from the BP5 102 kbp tandem duplication (i.e., the SMG1P-BOLA2 junction) was clearly included in the 95 kbp duplication from BP5 to BP4. b) Alignment of BP4 sequences containing the putative left (red arrows in inset) and right (dark blue arrows in inset) BOLA2 duplication breakpoints to the BP5 paralog associated with the evolutionarily older segmental duplication (orange and light blue arrows in inset) and sliding window sequence identity analysis supports the hypothesis outlined above. Sequence identity lines for comparisons involving left and right BP4 sequences intersect in the vicinity of the hypothesized BOLA2 duplication breakpoints. Comparing this result with the same analysis of the human H2 BP4 sequence lacking BOLA2 (green arrows in inset and green identity line) suggests this BP4 sequence represents the ancestral state of BP4 before the BOLA2 duplication arrived. Thus, two levels of sequence identity existed between BP4 and BP5 before the BOLA2 duplication, consistent with an interlocus gene conversion event. c) Alignment of BP4 sequences (orange arrows in insets) containing the putative BOLA2 duplication breakpoints to their ancestral BP4 (top plot) and their ancestral BP5 (middle plot) counterparts and sliding window sequence identity analysis reveals an ~7 kbp window (highlighted in orange) defining the BOLA2 duplication breakpoints. Analysis of the underlying multiple sequence alignment (Table S5) identified positions with signatures informative for breakpoint localization (blue vertical lines, left BP4 72 kbp block outside of the BOLA2 duplication and right BP4 72 kbp block within the BOLA2 duplication; yellow vertical lines, left BP4 72 kbp block within the BOLA2 duplication and right BP4 72 kbp block outside of the BOLA2 duplication). Gray vertical lines indicate positions showing signatures of interlocus gene conversion. As both left and right 72 kbp block BP4 sequences within the ~7 kbp window are more highly identical to ancestral BP4 sequence (20/24 informative positions match the ancestral BP4 sequence) than to ancestral BP5 sequence, it is likely that this interval was involved in the BOLA2 duplication but duplicated only within BP4. Its boundaries define the most likely BOLA2 duplication breakpoints, and this pattern of sequence identity suggests a template switching replicative mechanism as most likely underlying the BOLA2 duplication event. d) Template-switching model for the formation of BOLA2B. This mechanism was inferred from the sequence identity analyses in panels a–c and from analysis of a multiple sequence alignment (Table S5). e) Phylogenetic characterization of the 95 kbp duplication containing BOLA2 from BP5 to BP4. Cladogram representation of an unrooted neighbor-joining phylogenetic tree based on a 21,102 bp multiple sequence alignment spanning BOLA2 and most of the 30 kbp block including human sequences from BP4 and BP5 and single-copy orthologous sequences from chimpanzee, gorilla, and orangutan. Branch lengths (substitutions per site) are shown on each branch (black decimal numbers), and bootstrap support is indicated (black integers at nodes). Blue numbers correspond to nodes and indicate average branch lengths for all sequences in corresponding clades. Branch lengths were used to estimate the time corresponding to the 95 kbp duplication containing BOLA2 from BP5 to BP4 as shown.
Extended Data Figure 7
Extended Data Figure 7. Analyses of BOLA2 aggregate and paralog-specific copy number variation in humans
a) Interphase FISH confirms both BOLA2A and BOLA2B show copy number variation. Previous interphase FISH analysis (data not shown) suggests the individual NA20127 has six total copies of BOLA2. Diagram outlines a three-color FISH assay including two probes (blue, green) targeting sequences within the autism critical region and one probe (red) targeting ~18 kbp of sequence (including BOLA2) over the 30 kbp duplication block. Signals from the red probe are detected on the telomeric (BP4) and centromeric (BP5) sides of the critical region (adjacent to the blue and green probes, respectively) on both chromosome 16 homologs. However, the red probe signal intensity is strongest adjacent to the green probe for one homolog but, in contrast, is strongest adjacent to the blue probe for the other chromosome 16 homolog, consistent with higher BOLA2A copy number in the first case and higher BOLA2B copy number in the second case. These data indicate that individual NA20127 has three copies each of BOLA2A and BOLA2B. This differential signal intensity pattern does not result from an inversion of the chromosome 16p11.2 critical region in this individual, as data from another FISH experiment (data not shown) refute this possibility. Information on probes used in these FISH experiments is provided in Table S2. b) Interphase FISH experiments using a probe targeting BOLA2 and surrounding sequence for individuals having the lowest (3) and highest (8) confirmed aggregate BOLA2 copy numbers. c) Left and middle schematics detail three distinct sectors of the 72 kbp blocks (orange arrows). Each block has paralogous sequence variants that are informative for particular region(s) when compared to others in chromosome 16p11.2. These markers are color-coded into three sectors within the 72 kbp block of paralogy (a 59 kbp sector, blue and red boxes; a 7 kbp sector, green and orange boxes; and a 6 kbp sector, purple and yellow boxes), indicating which particular regions they distinguish. Right schematic shows known haplotype structures for individual NA12878. d) Analyzing WGS data from NA12878 yields copy number estimates for BOLA2A and BOLA2B that match the known BOLA2 PSCN for this individual. Each point shows a relative marker-specific read count frequency (y-axis) and its position within the duplication blocks (x-axis). Point colors correspond to different marker sets for each sector, as diagramed in panel c. Fractions indicate the relative copy number of each marker set. Estimates of 4/6 (red marker set) vs. 2/6 (blue marker set) for the 59 kbp sector confirms the sequenced architecture (panel c) with an aggregate of 4 BOLA2 copies, and the estimate of 3/6 (orange marker set) confirms three copies of BOLA2A. WGS analysis also yields accurate PSCN estimates for the 45 kbp block. e) Using MIPs, we employed the same relative read-depth strategy. Genotyping results for the same sample as in panel d are shown, with additional markers (points not color-coded as in panels c–d) added based on polymorphic variants (symbols indicate different patterns of presence/absence among 72 kbp blocks, considering all such blocks from our four contiguous human haplotypes). MIP genotypes confirm WGS estimates (in panel d). f) BOLA2 PSCN genotypes (points, jittered around their integer values for clarity) were inferred from MIP sequence data for 894 humans. Numbers indicate total counts of individuals in each population having a particular BOLA2 PSCN genotype. Low-confidence estimates were excluded.
Extended Data Figure 8
Extended Data Figure 8. Population genetic modeling of the BOLA2B duplication and critical region analyses
a) Demographic model (adapted from ref. 16) used to simulate BOLA2B evolution under different scenarios. NANC, effective population size of Homo ancestor, 21,600. NARC, effective population size of Neanderthal-Denisova ancestor, 500. NHUM, effective population size of human ancestor, 24,000. NYRE, effective size of Yoruban population after expansion, 45,000. NDEN, effective population size of Denisova, 500. NNEA, effective population size of Neanderthal, 500. NYRI, effective size of extant Yoruban population, 10,000. NSAN, effective size of extant San population, 10,000. T1, time of archaic hominin divergence from modern humans, 650,000 years. T2, time of Neanderthal-Denisova divergence, 525,000 years. Tdup, time of formation of BOLA2B, 282,000 years. T3, time of Yoruban-San divergence, 200,000 years. T4, time of Yoruban population expansion, 157,500 years. T5, time of Yoruban population decline, 37,500 years. b) Simulation results (n = 1,000,000) assuming that the duplication that formed BOLA2B occurred once, 282 kya, along the modern human ancestral lineage and evolved under neutrality compared to the observed genotype frequencies of BOLA2B in 8 San and 110 Yoruban haplotypes. Nearly all (999,531) simulations resulted in BOLA2B being lost from both populations; results from the remaining 469 simulations (black) are shown alongside the observed data (red, circled). Under this simple neutral model incorporating BOLA2B age, the observed BOLA2B frequency is never approached. c) Simulation was repeated exploring a range of selection coefficients from 0.0009 to 0.0024 (increments of 0.0001), and the relative probability of the observed data under each scenario was calculated as the proportion of simulations yielding the observed BOLA2B genotypes among simulations where BOLA2B was not lost relative to the maximum such proportion for any single selection coefficient considered. The maximum likelihood estimate for the selection coefficient was s = 0.0015. Smoothed line is LOESS regression curve. d) Low average heterozygosity of the chromosome 16p11.2 BP4–BP5 critical region. Distribution of average heterozygosity values for 100,000 ~550 kbp regions of unique sequence randomly sampled with replacement from the autosomal genome compared to average heterozygosity values for the critical region (black line) and flanking unique sequences (colored lines). The critical region lies in the bottom 2.6% of the distribution, showing low diversity consistent with potential positive selection. Bottom schematic indicates locations of the critical region and flanking unique regions in relation to segmental duplications across the locus—note that BOLA2A is located at BP5 and BOLA2B at BP4. e) Low Tajima’s D score for the chromosome 16p11.2 BP4–BP5 critical region. Distribution of Tajima’s D scores for 2,987 non-overlapping ~550 kbp regions across the genome compared to Tajima’s D scores for the critical region (black line) and flanking unique sequences (colored lines). The critical region lies in the bottom 2.7% of the distribution, consistent with possible positive selection. The distribution is centered near −2 rather than 0 because most SNVs in the 1000 Genomes dataset are rare variants having arisen during the large expansions of human populations over the past 100,000 years. Bottom schematic indicates locations of the critical region and flanking unique regions in relation to segmental duplications across the locus.
Extended Data Figure 9
Extended Data Figure 9. BOLA2 expression and antibody validation
a) RT-PCR expression profile for canonical BOLA2. The expected product size for canonical BOLA2 (838 bp) was observed in all eight human tissues. 1 kb + DNA ladder (Thermo Fisher). b) RT-PCR expression profile for BOLA2-SMG1 fusion product. The expected product size for the BOLA2 fusion transcript (1,239 bp) was observed as a doublet in all tissues except skeletal muscle. Intensity of upper band differs between tissues. 1 kb + DNA ladder (Thermo Fisher). c) BOLA2 RNA-seq expression analysis. Canonical (BOLA2) and fusion transcripts (BOLA2F, BOLA2T) were assessed across 25 humans from GTEx RNA-seq data. Bar heights indicate mean expression levels for each tissue in TPM with standard errors shown (error bars). Colors correspond to different BOLA2 isoforms as indicated. d) BOLA2 expression among primates in six adult tissues. Each point indicates a BOLA2 expression estimate from a single tissue sample, with samples obtained from a total of 18 humans, 6 chimpanzees, and 3 bonobos. Open circles correspond to individuals analyzed in a single experiment, while closed shapes denote data from multiple experiments involving the same individual, with each distinct color + shape pattern showing all experiments for a particular individual. Horizontal lines show mean expression values for each species and tissue. Combined with our expression analyses of iPSCs, these data show BOLA2 expression differs substantially between human, chimpanzee, and bonobo only in stem cells. e) Western blotting of HeLa cells transfected with the human BOLA2 annotated CDS and probed with an anti-BOLA2 antibody (Sc-163747). Whole-cell lysate of HeLa cells non-transfected with the overexpression construct (lane 1) and transfected with the human BOLA2 annotated CDS (lane 2) were probed with anti-BOLA2 antibody. Two bands with molecular weights of 10 and 17 kDa are identified and more abundant in transfected cells and correspond to two BOLA2 protein isoforms arising from different translation start sites.
Extended Data Figure 10
Extended Data Figure 10. Chromosome 16p11.2 rearrangement breakpoint refinement
a) Schematic depicts NAHR between directly oriented segmental duplications at BP4 and BP5. This unequal crossover results in chromosome 16p11.2 microdeletions and microduplications (Extended Data Fig. 5c). Colored arrows and boxes correspond to duplication blocks and sectors within them color-coded as in Extended Data Fig. 7c. Unequal crossover could occur in eight distinct regions with regard to duplication block and sector boundaries. Three such regions are located within the ~95 kbp Homo sapiens-specific duplication (dashed lines). Only unequal crossover events outside the Homo sapiens-specific duplication produce recombinants having a sector with non-uniform marker-specific copy number across its extent. b) Plot shows relative marker-specific read count frequencies (points) determined from WGS analysis for a microdeletion proband. Fractions indicate relative marker-specific copy numbers, as in Extended Data Fig. 7d, and diagrams adjacent to the plot show inferred haplotype structures for each chromosome 16 homolog for this individual. Though the data in the plot provide only diploid genotypes (and not resolved haplotypes), the haplotypes suggested here reflect this genotype information together with data from the parents (not shown) and the assumption (supported by our PSCN data) that haplotypes having two BOLA2A copies and a single BOLA2B copy are the most common. Because marker-specific copy number is uniform across each sector, unequal crossover breakpoints must have occurred within the Homo sapiens-specific duplication. c) Breakpoint refinement based on MIP PSCN marker data. Plots show relative marker-specific read count frequencies (points) determined using MIPs for a typical microdeletion patient (left) and a typical microduplication patient (right). Shapes and color code designate different markers, and fractions indicate relative marker-specific copy numbers (as in Extended Data Fig. 7). Because marker-specific copy number is uniform across each sector for both individuals, in both cases, unequal crossover breakpoints must have occurred within the Homo sapiens-specific duplication. d) Data from an atypical patient where the breakpoints are inferred to map outside of the Homo sapiens-specific segmental duplication. The plots show paralog-specific copy number for a chromosome 16p11.2 microdeletion proband, his sibling, and his mother over a 45 kbp duplication block shared between BP4 and BP5. Paralog-specific copy number was estimated using a MIP assay targeting 54 informative markers over this region, with data from 43 markers fixed among haplotypes H1–H4 shown (points). Dashed lines indicate calls inferred using an automated caller, which were also confirmed by visual inspection. Adjacent schematics indicate the inferred haplotypes for each individual based on these data, with approximate breakpoint locations shown (arrows). The results demarcate the location of the unequal crossover interval based on the reciprocal copy number transition between the BP5 (red) and BP4 (blue) 45 kbp block segmental duplications. In this case, the breakpoints clearly map to a 22 kbp region outside of the typical hotspot. Analysis of the sibling suggests that this region was the site of an interlocus gene conversion event from BP5 to BP4, and data from the mother imply that chromosomes having this event were present in the paternal germline. DNA from the father was not available for testing.
Figure 1
Figure 1. Comparative sequence analysis of chromosome 16p11.2 among apes and the evolution of BOLA2 duplications in humans
a) Schematic depicts the genomic organization of chromosome 16p11.2 for one orangutan and one chimpanzee haplotype along with the human reference haplotype (GRCh37 chr16:28195661–30573128). Blocks of segmental duplications within this locus mediate recurrent rearrangements in humans and have thus been defined as breakpoint regions BP1–BP5 (ref. 8). Colored boxes and thick arrows indicate the extent and orientation of segmental duplications (different colors denote duplicons from different ancestral genomic loci, and hashed boxes indicate sequence duplicated in humans but not in the species represented). Thin numbered arrows show orientations of gene-rich regions of unique sequence. Red triangles indicate locations and orientations of NPIP cores. Numbers (left) indicate the size of each haplotype, with the number of segmentally duplicated base pairs shown in parentheses. For chimpanzee, the size is a lower bound due to gaps (dotted line sections) and the contig not reaching unique region 1. Regions of human copy number variation (yellow highlight) occur on both sides of the critical region and involve the same 102 kbp unit: a 30 kbp block (green arrow) containing BOLA2, SLX1, and SULT1A3 and a 72 kbp block (orange arrow) harboring SMG1P. Expansion and contraction of this cassette underlie hundreds of kbp of structural diversity between human haplotypes. b) A model for the emergence of BOLA2 duplications during Homo sapiens evolution. Schematic depicts structural changes over time leading to the present-day human architecture. A full evolutionary model detailing the dynamic evolution of chromosome 16p11.2 in great apes is provided in the Supplementary Information and Extended Data Figs. 3, 4.
Figure 2
Figure 2. Homo sapiens-specific BOLA2 duplication and copy number diversity
a) A phylogenetic tree representing the last interspersed segmental duplication from BP5 to BP4 in humans. The unrooted neighbor-joining tree was constructed from a 21,102 bp multiple sequence alignment including allelic, paralogous, and orthologous copies of the BOLA2-containing segmental duplications. Human taxon labels denote haplotypes and locations of different copies (telomeric, T, blue; centromeric, C, red, with C1 closer to the critical region than C2). The number of substitutions (above each branch) and bootstrap support (at nodes) are indicated. Timing estimates assume human-chimpanzee divergence 6 mya. b) Diploid copy number estimates (points) for BOLA2 based on sequence read depth are shown for 2,359 humans, three archaic humans,, a Neanderthal, a Denisovan, and 86 nonhuman primates, with violin plots overlaid. c) Paralog-specific BOLA2 copy number genotypes (points, jittered around their integer values) were inferred from WGS read depth over informative markers for 222 individuals sequenced to high coverage. Colors correspond to different populations as in panel b.
Figure 3
Figure 3. BOLA2 expression analyses
a) Normalized BOLA2 mRNA expression quantifications in 366 LCLs from individuals genotyped for BOLA2 paralog-specific copy number. Points indicate expression levels and copy number (jittered) for each cell line, and horizontal lines show the mean expression level for each copy number. Line shows least squares regression. Point colors indicate BOLA2B copy number (pink = 1 copy, black = 2 copies, cyan = 3 copies). Groups with the same aggregate BOLA2 copy number but different combinations of paralog-specific copy number do not exhibit differential expression, consistent with both BOLA2A and BOLA2B producing mRNA. b) Plot layout is the same as in panel a, but data show BOLA2 protein expression quantified by Western blot densitometry on protein lysates from 34 LCLs. Though the sample size is small, no evidence indicates differential protein expression of distinct BOLA2 paralogs. c) BOLA2 gene models, predicted protein products, and support from RNA-seq data from human iPSCs. RT-PCR, cloning, and capillary sequencing experiments identified three BOLA2 isoforms: the canonical isoform (BOLA2, black) encoding an 86 residue protein and two fusion isoforms consisting of the first two exons from canonical BOLA2 fused with three exons from SMG1P. One of the fusion isoforms (BOLA2F, blue) maintains the BOLA2 ORF well beyond the fusion junction and is predicted to encode a 217 residue protein deriving primarily from SMG1P, whereas a third isoform (BOLA2T, red) contains a premature stop codon within the first SMG1P-derived exon. Numbers next to curved lines indicate mean counts of RNA-seq reads from two human iPSCs (two independent clones each) supporting each exon-exon junction, with standard errors in parentheses. d) RNA-seq quantification of BOLA2 mRNA expression through in vitro differentiation of primate iPSCs into neurons. Data from two human and two chimpanzee cell lines (two independent clones each, except for neurons) reveal significantly higher levels of BOLA2 transcripts in human iPSCs than in chimpanzee iPSCs and that BOLA2 RNA levels decrease through neuronal differentiation. Bar heights indicate mean expression levels for each species and differentiation stage in transcripts per million (TPM), with error bars showing standard errors. Bar colors correspond to different BOLA2 isoforms as in panel c. BOLA2 expression in human ESCs (two cell lines) is consistent with data from human iPSCs, suggesting the iPSC data accurately reflect BOLA2 expression at early stages in development.
Figure 4
Figure 4. Refinement of chromosome 16p11.2 rearrangement breakpoints
a) Results of whole-genome sequencing of a family with a de novo chromosome 16p11.2 microdeletion in a child with autism. Normalized read depth at unique 30-mer positions in the human reference genome GRCh37 is depicted for the proband, her mother, and her father. Read-depth signatures reveal a deletion in the proband extending between but not beyond the Homo sapiens-specific duplicated sequences (highlighted in pink). b) Summary of results across 105 independent microdeletion and microduplication events from 152 individuals. ~96% of breakpoints map to the Homo sapiens-specific segmental duplication.

References

    1. King MC, Wilson AC. Evolution at two levels in humans and chimpanzees. Science (New York, NY) 1975;188:107–116. - PubMed
    1. Prufer K, et al. The complete genome sequence of a Neanderthal from the Altai Mountains. Nature. 2014;505:43–49. doi: 10.1038/nature12886. - DOI - PMC - PubMed
    1. Meyer M, et al. A high-coverage genome sequence from an archaic Denisovan individual. Science (New York, NY) 2012;338:222–226. doi: 10.1126/science.1224344. - DOI - PMC - PubMed
    1. Weiss LA, et al. Association between microdeletion and microduplication at 16p11.2 and autism. The New England journal of medicine. 2008;358:667–675. doi: 10.1056/NEJMoa075974. - DOI - PubMed
    1. Kumar RA, et al. Recurrent 16p11.2 microdeletions in autism. Human molecular genetics. 2008;17:628–638. doi: 10.1093/hmg/ddm376. - DOI - PubMed

Publication types