. 2016 Sep 29;537(7622):680-684.
doi: 10.1038/nature18950. Epub 2016 Aug 3.

Thirst neurons anticipate the homeostatic consequences of eating and drinking

Affiliations

Thirst neurons anticipate the homeostatic consequences of eating and drinking

Christopher A Zimmerman et al. Nature. .

Abstract

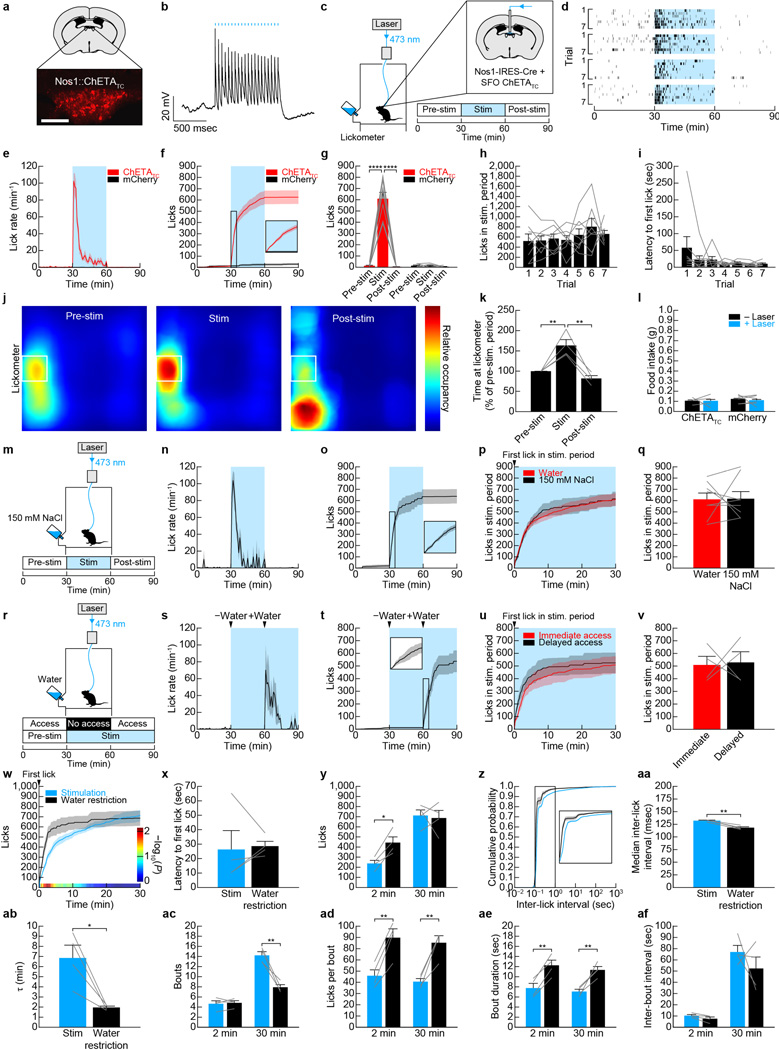
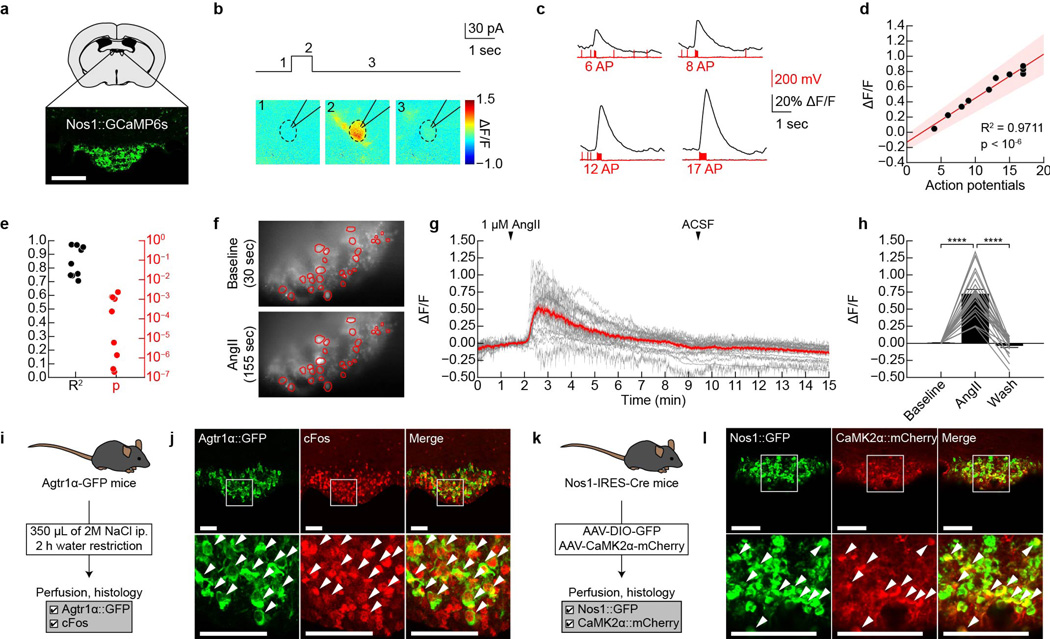
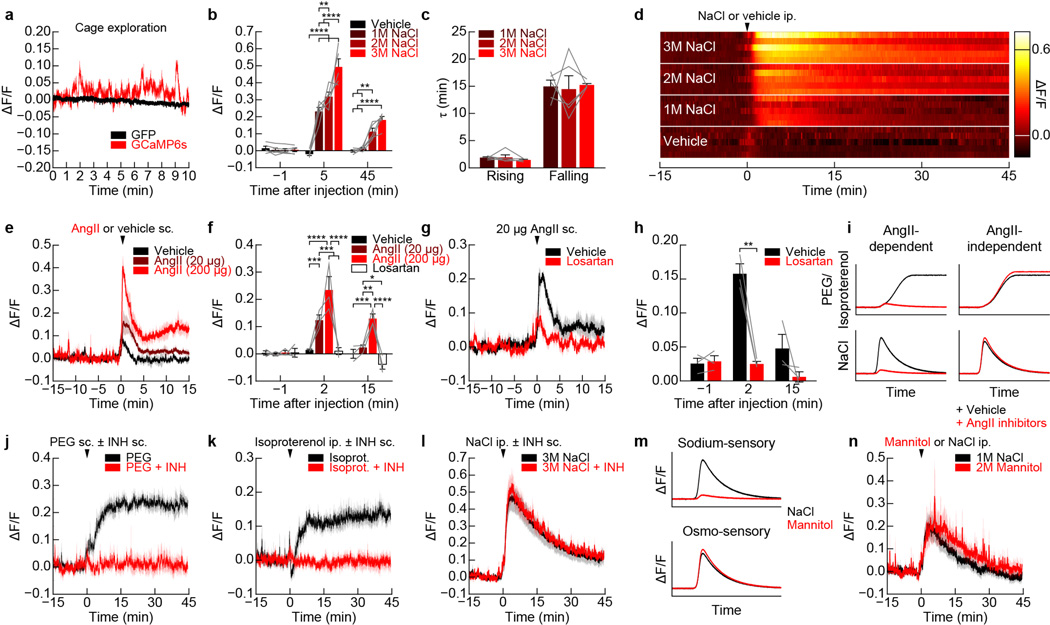
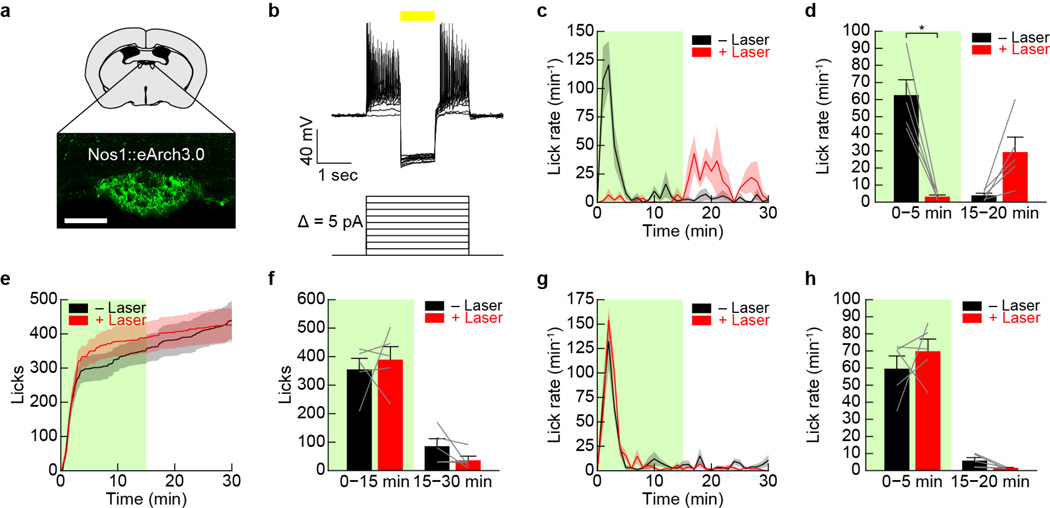
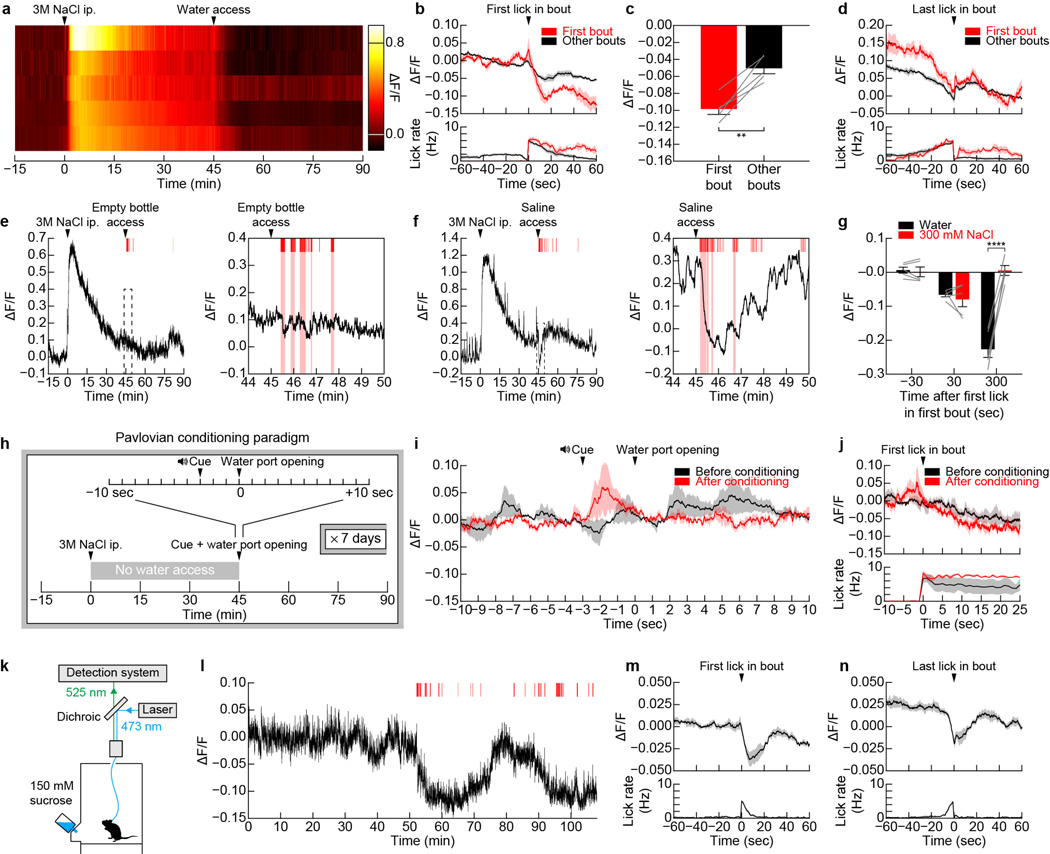
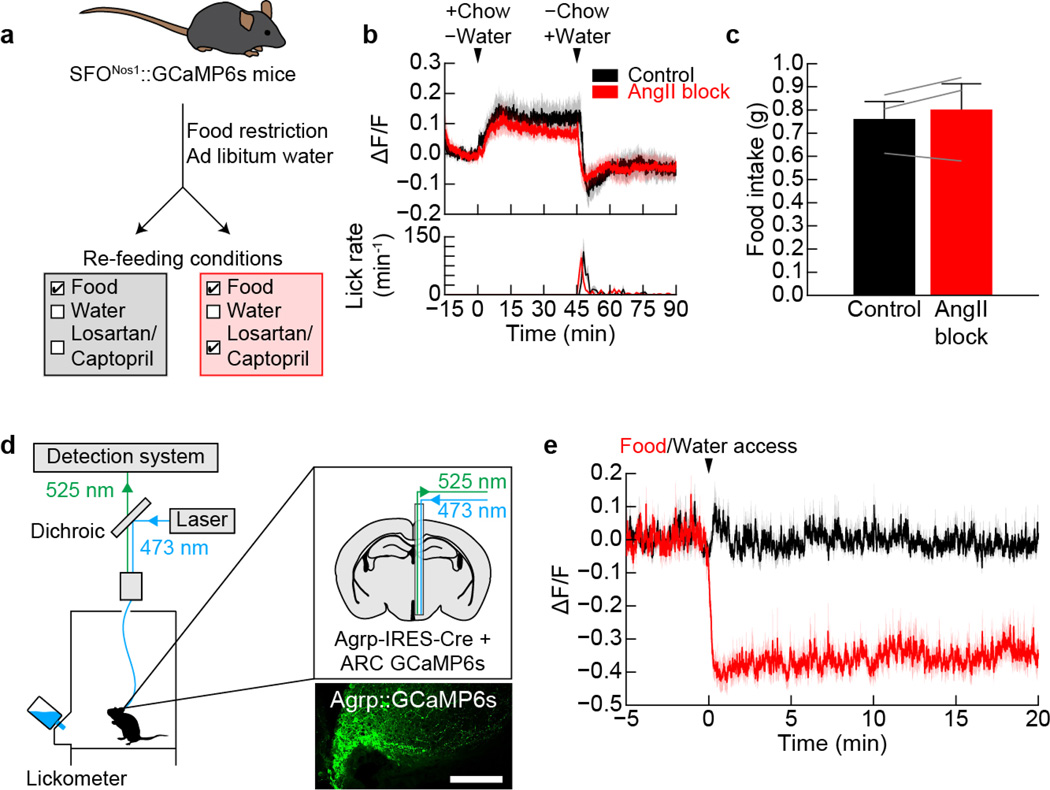
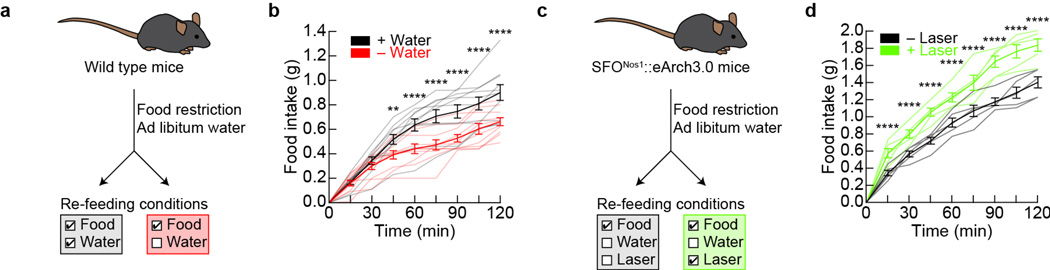
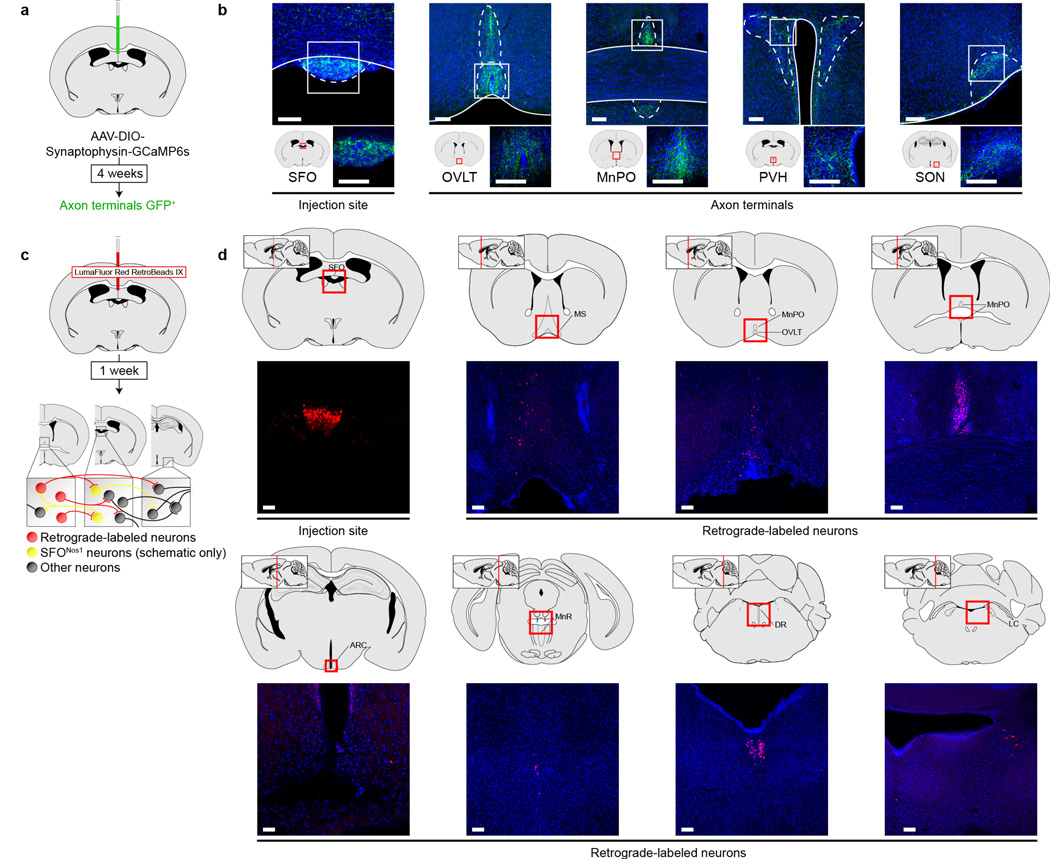
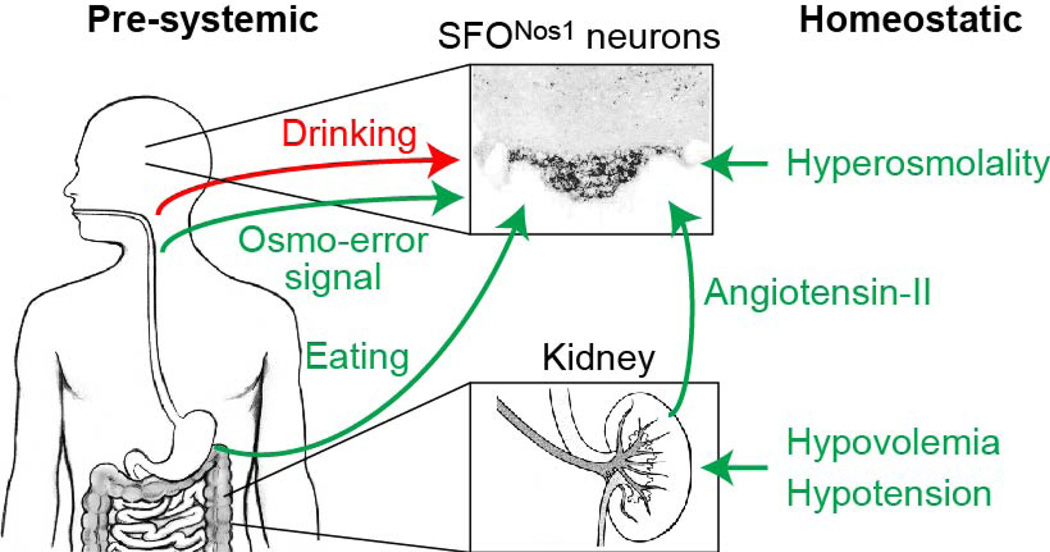
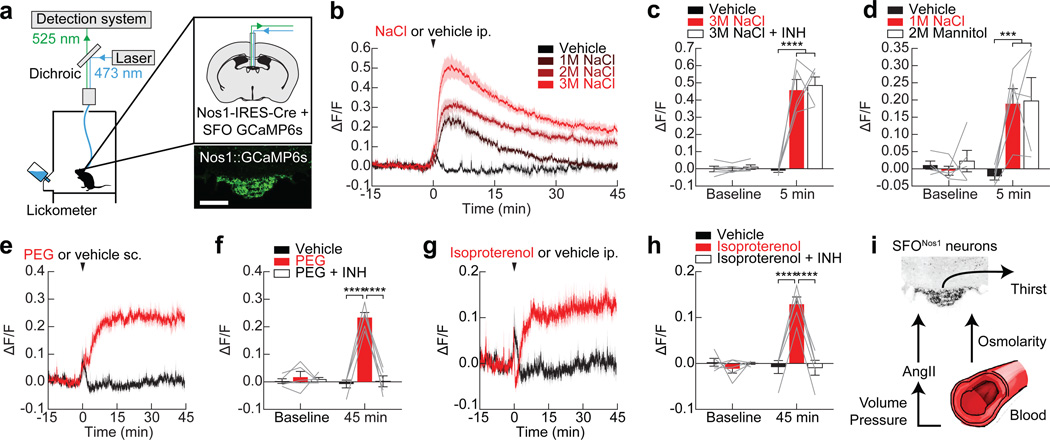
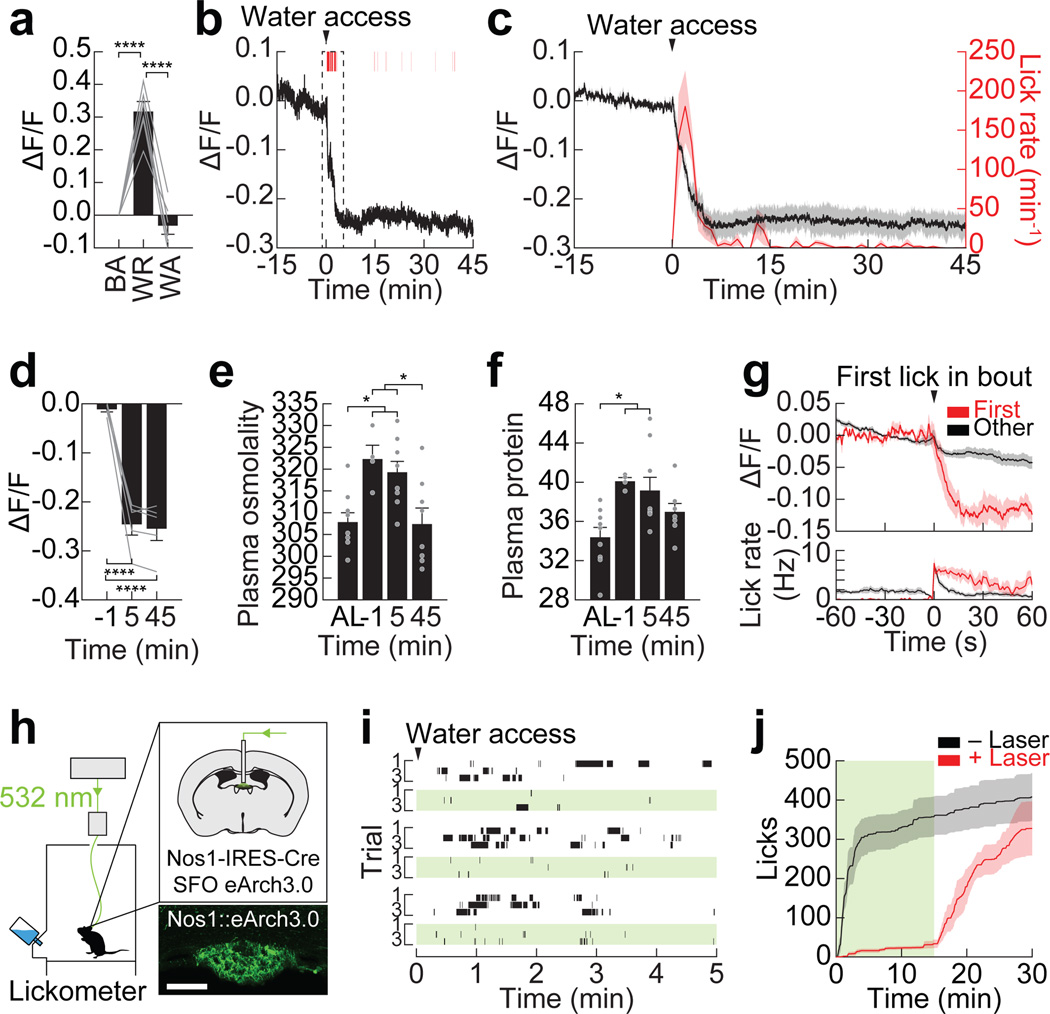
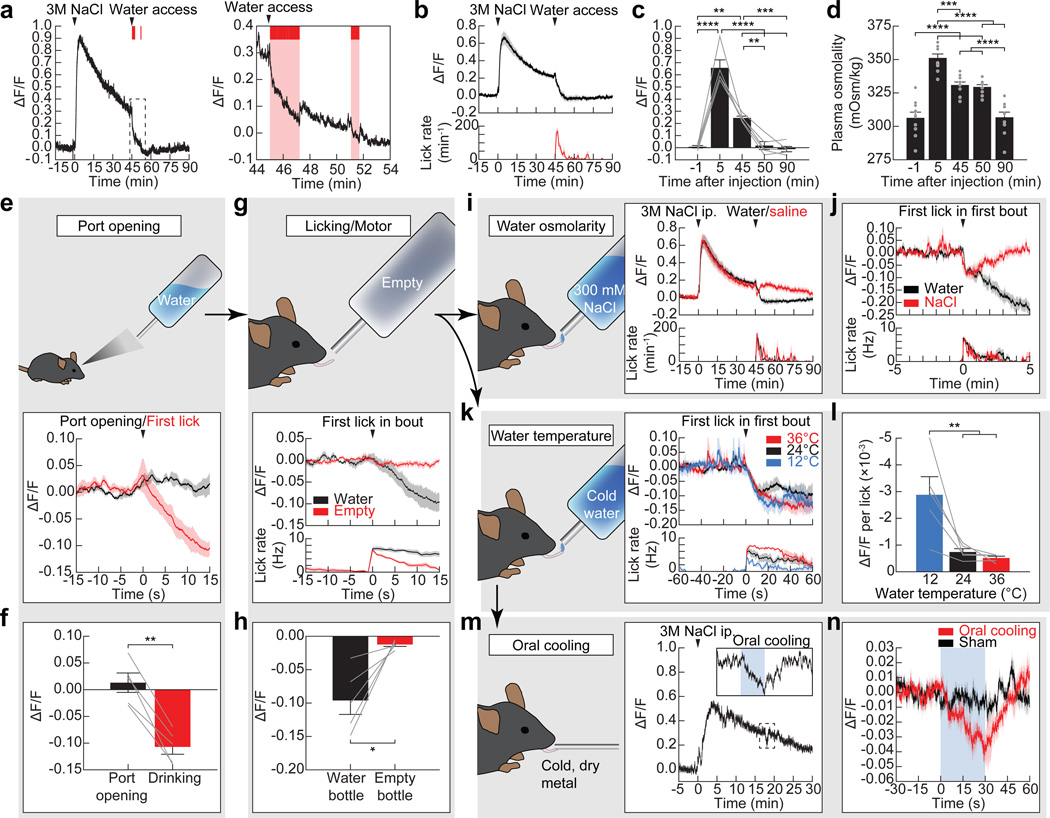
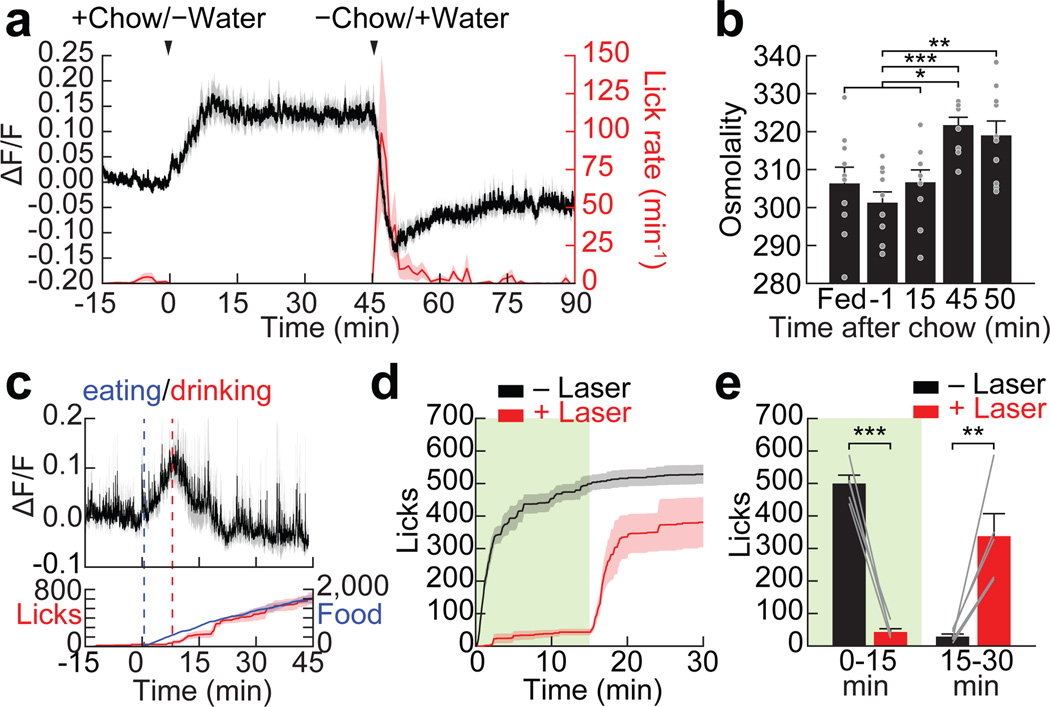
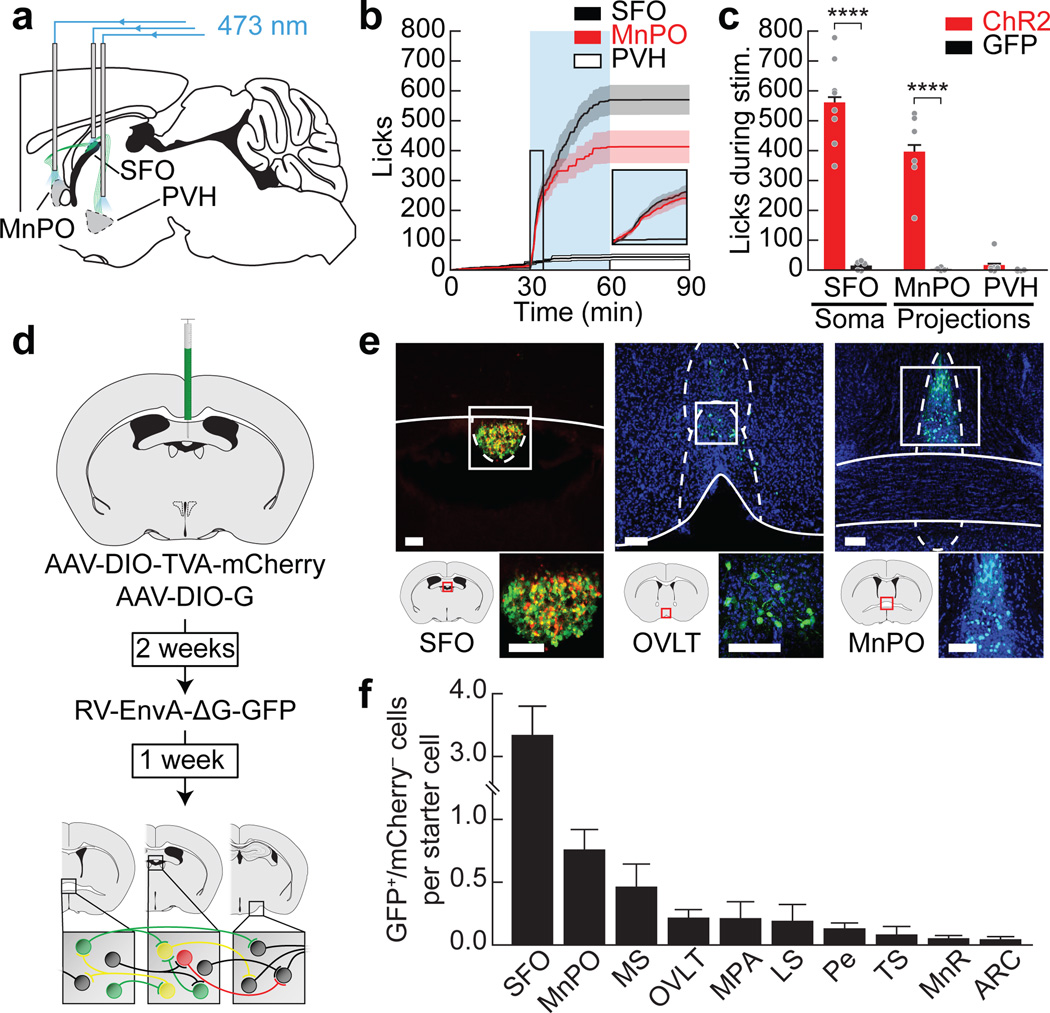
Thirst motivates animals to drink in order to maintain fluid balance. Thirst has conventionally been viewed as a homeostatic response to changes in blood volume or tonicity. However, most drinking behaviour is regulated too rapidly to be controlled by blood composition directly, and instead seems to anticipate homeostatic imbalances before they arise. How this is achieved remains unknown. Here we reveal an unexpected role for the subfornical organ (SFO) in the anticipatory regulation of thirst in mice. By monitoring deep-brain calcium dynamics, we show that thirst-promoting SFO neurons respond to inputs from the oral cavity during eating and drinking and then integrate these inputs with information about the composition of the blood. This integration allows SFO neurons to predict how ongoing food and water consumption will alter fluid balance in the future and then to adjust behaviour pre-emptively. Complementary optogenetic manipulations show that this anticipatory modulation is necessary for drinking in several contexts. These findings provide a neural mechanism to explain longstanding behavioural observations, including the prevalence of drinking during meals, the rapid satiation of thirst, and the fact that oral cooling is thirst-quenching.


Figures

Extended Data Figure 1
Extended Data Figure 1. Optogenetic activation of SFONos1 neurons is sufficient to promote drinking, but negative feedback inhibits excessive drinking during optogenetically- and dehydration-induced drinking
Panels a–l demonstrate that optogenetic activation of SFONos1 neurons rapidly and specifically promotes drinking. a, Expression of mCherry in SFONos1 neurons from AAV5-EF1α-DIO-ChETATC-2A-mCherry (scale bar, 100 µm). b, Representative recording showing rapid firing of SFONos1 neuron in response to photostimulation (20 Hz) in acute slice (1 of 3 cells; blue lines, stimulation). c, Schematic of optogenetic setup for activating SFONos1 neurons. d, Rasters of drinking in response to optogenetic stimulation for seven trials each for four SFONos1::ChETATC mice (black lines, licks; blue boxes, stimulation). e, Averaged traces showing lick rate (n = 6 SFONos1::mCherry mice and 8 SFONos1::ChETATC mice). f, Averaged traces showing cumulative licks (n = 6 SFONos1::mCherry mice and 8 SFONos1::ChETATC mice). g, Quantification of drinking during stimulation protocol (****P < 0.0001, two-way repeated-measures ANOVA, n = 6 SFONos1::mCherry mice and 8 SFONos1::ChETATC mice). h, Licks during stimulation period across seven consecutive trials (n.s., one-way repeated-measures ANOVA, n = 8 mice). i, Latency to first lick during stimulation period across seven consecutive trials (n.s., one-way repeated-measures ANOVA, n = 8 mice). j, Heatmaps showing location of SFONos1::ChETATC mice during stimulation protocol (n = 4 mice). k, Quantification of time spent at lickometer during stimulation protocol (**P < 0.01, one-way repeated-measures ANOVA, n = 4 mice). l, Activation of SFONos1 neurons did not induce feeding (n.s., two-way repeated-measures ANOVA, n = 6 SFONos1::mCherry mice and 4 SFONos1::ChETATC mice). Panels m–q demonstrate that osmotic dilution does not inhibit excessive drinking during optogenetically-induced drinking. m, SFONos1::ChETATC mice were stimulated, but with access to 150 mM NaCl instead of water. n, Lick rate (n = 8 mice). o, Cumulative licks (n = 8 mice). p, Comparison to stimulation with water access (n = 8 mice). q, Quantification (n.s., two-tailed Student’s t-test, n = 8 mice). Panels r–v demonstrate that channelrhodopsin failure does not explain the negative feedback that inhibits excessive drinking during optogenetically-induced drinking. r, SFONos1::ChETATC mice were stimulated, but with delayed access to water instead of immediate access. s, Lick rate (n = 4 mice). t, Cumulative licks (n = 4 mice). u, Comparison to stimulation with water access (n = 4 mice). v, Quantification (n.s., two-tailed Student’s t-test, n = 4 mice). Panels w–af demonstrate that a negative feedback mechanism also inhibits excessive drinking during dehydration-induced drinking. w, Comparison of optogenetically-induced and dehydration-induced drinking in SFONos1::ChETATC mice (n = 4 mice; P-value color bar represents result of independent two-tailed Student’s t-tests). x, Latency to first lick (n.s., two-tailed Student’s t-test, n = 4 mice). y, Cumulative licks (*P < 0.05, two-way repeated-measures ANOVA, n = 4 mice). z, Cumulative probability distribution for inter-lick interval, a measure of licking “speed” (n = 4 mice). aa, Median inter-lick interval (**P < 0.01, two-tailed Student’s t-test, n = 4 mice). ab, Time constant (τ) for cumulative licks (*P < 0.05, two-tailed Student’s t-test, n = 4 mice). ac, Number of drinking bouts (**P < 0.01, two-way repeated-measures ANOVA, n = 4 mice). ad, Number of licks per drinking bout (**P < 0.01, two-way repeated-measures ANOVA, n = 4 mice). ae, Bout duration (**P < 0.01, two-way repeated-measures ANOVA, n = 4 mice). af, Inter-bout interval (n.s., two-way repeated-measures ANOVA, n = 4 mice). Values are mean ± s.e.m. (error bars or shaded area).
Extended Data Figure 2
Extended Data Figure 2. GCaMP6s faithfully reports SFONos1 neuron activity in acute slices
a, Expression of GCaMP6s in SFONos1 neurons from AAV5-EF1α-FLEX-GCaMP6s (scale bar, 100 µm). b, Representative fluorescence images of a neuron given a 30 pA current injection for 700 msec in acute slice (1 of 9 cells). c, Representative traces showing calcium responses in response to 30 pA current injections of increasing duration to produce increasing numbers of action potentials (1 of 9 cells). d, Relationship between number of action potentials and ΔF/F for the representative neuron in panel c (shaded area denotes 95% confidence interval). e, R2 and P-value for linear relationship between number of action potentials and ΔF/F (n = 9 cells). Panels f–j demonstrate that SFONos1 neurons are homogeneously responsive to both angiotensin and salt challenge. f, Representative fluorescence images showing SFONos1 neuron activity before and during bath application of angiotensin (1 of 3 experiments; red circles, identified neurons). g, 24/27 (~90%) identified SFONos1 neurons were activated by bath application of angiotensin (red line, mean; grey lines, individual activated neurons). h, Quantification (****P < 0.0001, two-way repeated-measures ANOVA, n = 24 activated neurons). i, Experimental design to test if a single population of SFO neurons is responsive to both angiotensin and salt challenge. j, Co-localization of Agtr1α::GFP and salt challenge-induced cFos indicates that SFONos1 neurons are homogeneously responsive to both angiotensin and salt challenge (scale bars, 100 µm). k, Experimental design to test if a SFO neurons express the excitatory neuron marker CaMK2α. l, Co-localization of CaMK2α::mCherry and Nos1::GFP indicates that SFONos1 neurons are excitatory (scale bar, 100 µm). Values are mean ± s.e.m. (error bars or shaded area).
Extended Data Figure 3
Extended Data Figure 3. Regulation of SFONos1 neurons by homeostatic signals
a, Recordings from SFONos1::GCaMP6s mice as they explored a behavioral chamber without access to food or water revealed dynamic fluctuations in fluorescence around a stable baseline (1 of 8 mice); these fluctuations were absent from recordings from SFONos1::GFP mice (1 of 3 mice). b, Quantification of response to peripheral injection of NaCl (averaged traces in Fig. 1b; **P < 0.01, ****P < 0.0001, two-way repeated-measures ANOVA, n = 5 mice). c, Time constant (τ) of rising and falling phases of response to peripheral injection of NaCl (n.s., two-way repeated-measures ANOVA, n = 5 mice). d, Representative recordings for five mice showing response to peripheral injection of NaCl or vehicle. e, SFONos1 neurons are activated by peripheral injection of angiotensin in a dose-dependent manner (n = 3 mice). f, Quantification (*P < 0.05, **P < 0.01, ***P < 0.001, ****P < 0.0001, two-way repeated-measures ANOVA, n = 3 mice). g, The AT1R antagonist losartan abolished the response to peripheral injection of angiotensin (n = 3 mice). h, Quantification (**P < 0.01, two-way repeated-measures ANOVA, n = 3 mice). i, Schematic illustrating expected observations if activation of SFONos1 neurons in response to peripheral injection PEG/isoproterenol and NaCl is angiotensin-dependent. j, Angiotensin blockers abolished the response to peripheral injection of PEG (quantification in Fig. 1f; n = 5 mice). k, Angiotensin blockers abolished the response to peripheral injection of isoproterenol (quantification in Fig. 1h; n = 5 mice). l, Angiotensin blockers did not abolish the response to peripheral injection of NaCl (quantification in Fig. 1c; n = 5 mice). m, Schematic illustrating expected observations if activation of SFONos1 neurons in response to peripheral injection NaCl is sodium-sensory or osmo-sensory. n, SFONos1 neurons are similarly activated by peripheral injection of equimolar mannitol and NaCl (quantification in Fig. 1d; n = 5 mice). Values are mean ± s.e.m. (error bars or shaded area).
Extended Data Figure 4
Extended Data Figure 4. SFONos1 neurons are necessary for drinking
a, Expression of YFP in SFONos1 neurons from AAV5-EF1α-DIO-eArch3.0-YFP (scale bar, 100 µm). b, Representative recording showing firing of SFONos1 neurons is blocked in response to photosilencing in acute slice (1 of 3 cells; yellow line, laser). c, Averaged traces showing lick rate for experiment in Fig. 2j (n = 5 mice; green box, laser on). d, Quantification (*P < 0.05, two-way repeated-measures ANOVA, n = 5 mice). e, Averaged traces showing cumulative licks following water restriction for SFONos1::mCherry control mice (n = 5 mice; green box, laser on). f, Quantification (n.s., two-way repeated-measures ANOVA, n = 5 mice). g, Averaged traces showing lick rate following water restriction for SFONos1::mCherry control mice (n = 5 mice; green box, laser on). h, Quantification (n.s., two-way repeated-measures ANOVA, n = 5 mice). Values are mean ± s.e.m. (error bars or shaded area).
Extended Data Figure 5
Extended Data Figure 5. Regulation of SFONos1 neurons by anticipatory signals
a, Representative recordings for five mice showing activation of SFONos1 neurons during salt challenge and rapid inhibition of SFONos1 neurons during drinking. b, PSTH of SFONos1 neuron activity and lick rate around the first lick in either the first drinking bout or all other drinking bouts following salt challenge (n = 5 mice). c, The decrease in SFONos1 neuron activity was greatest during the first drinking bout (ΔF/F at 20 sec after first lick; **P < 0.01, two-tailed Student’s t-test, n = 5 mice). d, PSTH of SFONos1 neuron activity and lick rate around the last lick in either the first drinking bout or all other drinking bouts following salt challenge (n = 5 mice). e, Representative recording showing no inhibition of SFONos1 neurons during licking an empty bottle following salt challenge (1 of 5 mice; red lines, licks; red boxes, drinking bouts). f, Representative recording showing rapid inhibition followed by “re-setting” of SFONos1 neurons during drinking 300 mM NaCl following salt challenge (1 of 5 mice; red lines, licks; red boxes, drinking bouts). g, SFONos1 neurons receive a post-ingestive error signal that reports the osmolarity of ingested fluids (averaged traces in Fig. 3j; ****P < 0.0001, two-way repeated-measures ANOVA, n = 5 mice). Panels h–j demonstrate that SFONos1 neurons do not transmit a teaching signal in a Pavlovian conditioning paradigm. h, Schematic of Pavlovian conditioning paradigm. i, SFONos1 neurons were not inhibited by cue presentation after one week of Pavlovian conditioning (n = 3 mice). j, PSTH of SFONos1 neuron activity and lick rate around the first lick in the first drinking bout either before or after Pavlovian conditioning (n = 3 mice). Panels k–n demonstrate that SFONos1 neurons are modulated by rapid anticipatory signals during drinking in the absence of homeostatic need. k, The activity of SFONos1 neurons was recorded while fully hydrated mice were given ad libitum access to sucrose. l, Representative recording showing modulation of SFONos1 neurons during sucrose drinking (1 of 4 mice; red lines, licks). m, PSTH of SFONos1 neuron activity and lick rate around the first lick in all sucrose drinking bouts (n = 4 mice). n, PSTH of SFONos1 neuron activity and lick rate around the last lick in all sucrose drinking bouts (n = 4 mice). Values are mean ± s.e.m. (error bars or shaded area).
Extended Data Figure 6
Extended Data Figure 6. Activation of SFONos1 neurons during eating does not require angiotensin signaling
a, Experimental design to test if angiotensin signaling is necessary for prandial thirst. b, Angiotensin blockers (“INH”) did not inhibit eating-induced activation of SFONos1 neurons or prandial drinking (n = 3 mice). c, Angiotensin blockers did not effect food consumption (n.s., two-tailed Student’s t-test, n = 3 mice). Panels d–e demonstrate that ARCAgRP neurons that control hunger are not reciprocally modulated by eating and drinking. d, Schematic of fiber photometry setup for recording the activity of ARCAgRP neurons (scale bar, 100 µm). e, ARCAgRP neurons were rapidly inhibited when fasted mice were presented with chow, as previously reported, but were unaffected when dehydrated mice were presented with water (n = 5 mice). Values are mean ± s.e.m. (error bars or shaded area).
Extended Data Figure 7
Extended Data Figure 7. Silencing of SFONos1 neurons disinhibits feeding
a, Experimental design to test if prandial thirst inhibits food intake. b, Mice provided simultaneous access to water consumed more food after overnight fasting than mice without simultaneous access to water (**P < 0.01, ****P < 0.0001, two-way ANOVA, n = 10 mice per group), consistent with previous reports that thirst can inhibit hunger in rats. c, Experimental design to test if SFONos1 neurons mediate inhibition of food intake by prandial thirst. d, Silencing of SFONos1 neurons increased food intake when mice were provided access to chow without simultaneous access to water after overnight fasting (**P < 0.01, ****P < 0.0001, two-way repeated-measures ANOVA, n = 5 mice). Values are mean ± s.e.m. (error bars or shaded area).
Extended Data Figure 8
Extended Data Figure 8. Projection mapping and retrograde tracing from SFO neurons
a, Schematic of viral strategy for identifying projections from SFONos1 neurons using a fluorescent synaptophysin fusion protein. b, Representative images showing SFONos1 neuron somas in the SFO and axon terminals in the organum vasculosum of the lamina terminalis (OVLT), median preopotic nucleus (MnPO), paraventricular hypothalamus (PVH), and supraoptic nucleus (SON) (1 of 2 mice; green, GFP; blue, DAPI; scale bars, 100 µm). c, Schematic of strategy for retrograde tracing from SFO neurons using retrobeads. d, Representative images showing retrobeads injection site in the SFO and retrograde-labeled neurons in the medial septum (MS), OVLT, MnPO, arcuate nucleus (ARC), median raphe (MnR), dorsal raphe (DR), and locus coeruleus (LC) (1 of 2 mice; red, rhodamine; blue, DAPI; scale bars, 100 µm).
Extended Data Figure 9
Extended Data Figure 9. Schematic for convergence of anticipatory and homeostatic signals at SFONos1 thirst neurons
a, SFONos1 neurons monitor the composition of the blood by sensing plasma osmolarity and, via angiotensin, plasma volume and pressure. SFONos1 neurons predict the future state of the blood by integrating temperature-dependent inputs from the mouth and osmolarity-dependent inputs from the gut during drinking, and angiotensin- and osmolarity-independent inputs from the mouth/gut during eating.
Figure 1
Figure 1. Mechanisms of homeostatic regulation of SFONos1 neurons
a, Schematic of fiber photometry setup (scale bar, 100 µm). b, SFONos1 neurons are activated by injection of NaCl. c, Angiotensin blockers (INH) do not abolish the response to NaCl. d, SFONos1 neurons are similarly activated by equiosmotic mannitol and NaCl. e, SFONos1 neurons are activated by injection of PEG. f, Angiotensin blockers abolish the this response. g, SFONos1 neurons are activated by injection of isoproterenol. h, Angiotensin blockers abolish the this response. i, Schematic summarizing the mechanisms by which SFONos1 neurons monitor the blood. Statistical analyses are described in Methods and in Extended Data Table 1. n = 5 mice for all experiments.
Figure 2
Figure 2. SFONos1 neurons receive rapid anticipatory modulation and are necessary for drinking
a, SFONos1 neurons are activated by water restriction (WR), and their activity returns to baseline (BA) after water access (WA; n = 6 mice). b, Representative recording showing rapid inhibition of SFONos1 neurons during drinking following water restriction (1 of 5 mice; red lines, licks; red boxes, bouts). c, Averaged traces showing SFONos1 neuron activity and lick rate (n = 5 mice). d, Quantification (n = 5 mice). e, Plasma osmolality (mOsm/kg) is elevated by water restriction and is unchanged by 5 min after re-access (n = 4–9 mice per group; AL, ad libitum). f, Plasma protein concentration (mg/mL) is elevated by water restriction and is unchanged by 5 min after re-access (n = 4–9 mice per group). g, PSTH around first lick in first bout or all other bouts (n = 5 mice). h, Schematic of optogenetic setup for silencing SFONos1 neurons (scale bar, 100 µm). i, Representative rasters of drinking following water restriction (3 of 5 mice; black lines, licks; green boxes, laser on). j, Averaged traces showing cumulative licks following water restriction (n = 5 mice; green box, laser on). Statistical analyses are described in Methods and in Extended Data Table 1.
Figure 3
Figure 3. Mechanisms of anticipatory regulation of SFONos1 neurons during drinking
a, Representative recording showing rapid inhibition of SFONos1 neurons during drinking following salt challenge (1 of 8 mice; red lines, licks; red boxes, bouts). b, Averaged traces showing SFONos1 neuron activity and lick rate. c, Quantification. d, Plasma osmolality is elevated by salt challenge and is unchanged by 5 min after water re-access (n = 10 mice per group). e, SFONos1 neurons do not respond to the sight of water. f, Quantification. g, SFONos1 neurons do not respond to motor movements associated with licking. h, Quantification. i, SFONos1 neurons receive a post-ingestive error signal that reports the osmolarity of ingested fluids. j, PSTH around first lick in first bout. k, SFONos1 neurons were similarly inhibited regardless of water temperature. l, Drop in activity per lick was highly temperature-dependent. m, Representative recording showing rapid inhibition of SFONos1 neurons during oral cooling (1 of 5 mice; blue box, oral cooling). n, PSTH around placement of dry metal into oral cavity. Statistical analyses are described in Methods and in Extended Data Table 1. n = 5 mice for all photometry experiments.
Figure 4
Figure 4. SFONos1 neurons are activated by eating and are required for prandial thirst
a, SFONos1 neurons are rapidly activated by eating and inhibited by prandial drinking following overnight fasting (n = 6 mice). b, Plasma osmolality is elevated by eating by 45 min (but not 15 min) after chow access and is unchanged by 5 min after water re-access (n = 10 mice per group). c, SFONos1 neurons are rapidly modulated in fasted mice provided simultaneous access to chow and water (n = 5 mice). Food refers to time (s) spent interacting with food. d, Silencing SFONos1 neurons abolishes prandial thirst in fasted mice re-fed chow before water access (n = 5 mice; green box, laser on). e, Quantification (n = 5 mice). Statistical analyses are described in Methods and in Extended Data Table 1.
Figure 5
Figure 5. Structure of the SFONos1 neuron-associated thirst circuit
a, Schematic of optogenetic setup for activating SFONos1 neuron somas or axon terminals in the MnPO or PVH. b, Averaged traces showing cumulative licks during photostimulation (n = 6–8 mice per group). c, Quantification (n = 4–8 mice per group). d, Schematic of viral strategy for identifying monosynaptic inputs to SFONos1 neurons. e, Representative images showing SFO injection site (red, mCherry; green, GFP) and monosynaptically connected neurons (green, GFP; blue, DAPI) in the organum vasculosum of the lamina terminalis (OVLT) and MnPO (1 of 6 mice; scale bars, 100 µm). f, Quantification (MS, medial septum; MPA, medial preoptic area; LS, lateral septum; Pe, periventricular hypothalamus; TS, triangular septum; MnR, median raphe; ARC, arcuate nucleus; n = 6 mice). Statistical analyses are described in Methods and in Extended Data Table 1.

Comment in

References

    1. Lind RW, Thunhorst RL, Johnson AK. The subfornical organ and the integration of multiple factors in thirst. Physiol Behav. 1984;32:69–74. - PubMed
    1. McKinley MJ, Johnson AK. The physiological regulation of thirst and fluid intake. News Physiol Sci. 2004;19:1–6. - PubMed
    1. Bourque CW. Central mechanisms of osmosensation and systemic osmoregulation. Nat Rev Neurosci. 2008;9:519–531. - PubMed
    1. Berridge KC. Motivation concepts in behavioral neuroscience. Physiol Behav. 2004;81:179–209. doi:10.1016/j.physbeh.2004.02.004. - PubMed
    1. Woods SC, Ramsay DS. Homeostasis: beyond Curt Richter. Appetite. 2007;49:388–398. - PMC - PubMed

Extended Data References

    1. Hsiao S, Trankina F. Thirst-hunger interaction. I. Effects of body-fluid restoration on food and water intake in water-deprived rats. J. Comp. Physiol. Psychol. 1969;69:448–453. - PubMed

Publication types