. 2016 Aug 18;536(7616):333-337.
doi: 10.1038/nature19055. Epub 2016 Aug 3.

Operation of a homeostatic sleep switch

Affiliations

Operation of a homeostatic sleep switch

Diogo Pimentel et al. Nature. .

Abstract

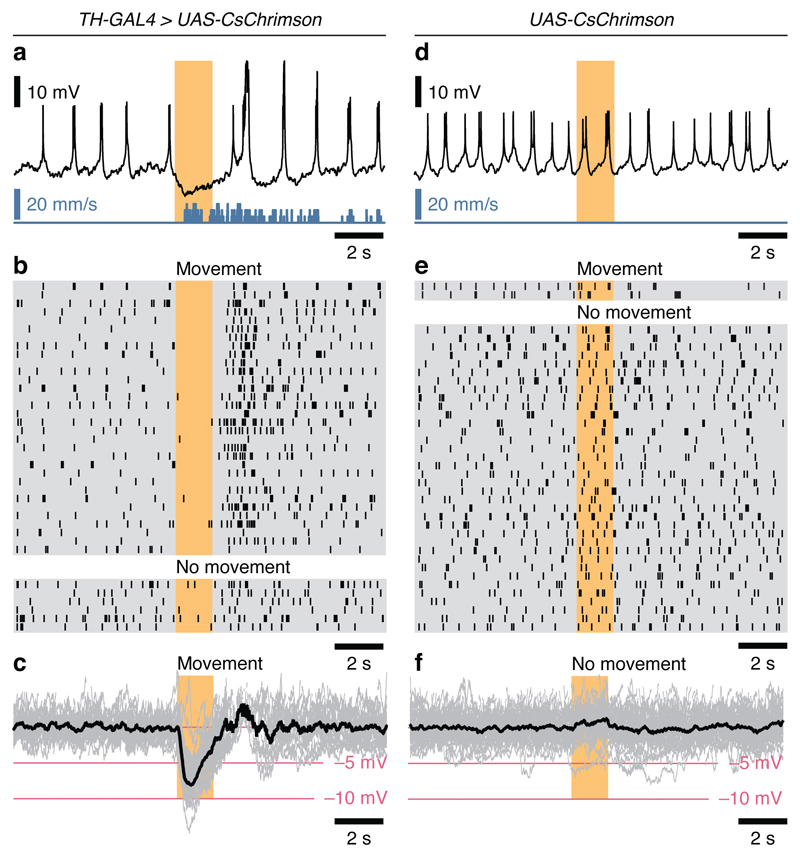
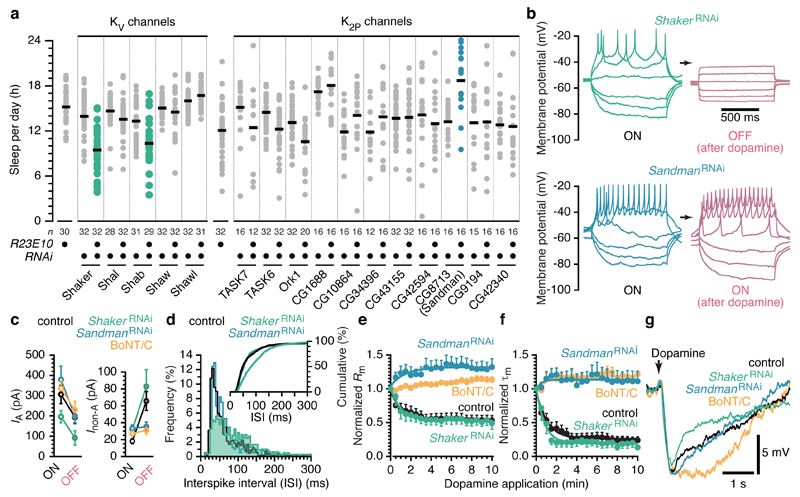
Sleep disconnects animals from the external world, at considerable risks and costs that must be offset by a vital benefit. Insight into this mysterious benefit will come from understanding sleep homeostasis: to monitor sleep need, an internal bookkeeper must track physiological changes that are linked to the core function of sleep. In Drosophila, a crucial component of the machinery for sleep homeostasis is a cluster of neurons innervating the dorsal fan-shaped body (dFB) of the central complex. Artificial activation of these cells induces sleep, whereas reductions in excitability cause insomnia. dFB neurons in sleep-deprived flies tend to be electrically active, with high input resistances and long membrane time constants, while neurons in rested flies tend to be electrically silent. Correlative evidence thus supports the simple view that homeostatic sleep control works by switching sleep-promoting neurons between active and quiescent states. Here we demonstrate state switching by dFB neurons, identify dopamine as a neuromodulator that operates the switch, and delineate the switching mechanism. Arousing dopamine caused transient hyperpolarization of dFB neurons within tens of milliseconds and lasting excitability suppression within minutes. Both effects were transduced by Dop1R2 receptors and mediated by potassium conductances. The switch to electrical silence involved the downregulation of voltage-gated A-type currents carried by Shaker and Shab, and the upregulation of voltage-independent leak currents through a two-pore-domain potassium channel that we term Sandman. Sandman is encoded by the CG8713 gene and translocates to the plasma membrane in response to dopamine. dFB-restricted interference with the expression of Shaker or Sandman decreased or increased sleep, respectively, by slowing the repetitive discharge of dFB neurons in the ON state or blocking their entry into the OFF state. Biophysical changes in a small population of neurons are thus linked to the control of sleep-wake state.


Conflict of interest statement

Author Information. The authors declare no competing financial interests.

Figures

Extended Data Figure 1
Extended Data Figure 1. Optogenetic stimulation of dopaminergic neurons.
Dopaminergic neurons expressing CsChrimson under TH-GAL4 control were driven with 3-ms pulses of 630-nm light at the indicated frequencies. Optical power at the sample was ~28 mW/cm2. a, Examples of voltage responses to optical pulse trains. b, The ratio of light-evoked action potentials to optical pulses was close to 1 at driving frequencies between 5 and 20 Hz (n=36 trials on 6 cells). Data are means ± s.e.m.
Extended Data Figure 2
Extended Data Figure 2. Changes in sleep after interference with Dop1R2 signaling are consistent with diminished sensitivity to arousing dopamine.
a, Sleep during a 24-hour day in homozygous carriers of the Dop1R2MI08664 allele (red, n=32 flies) and heterozygous controls (black, n=31 flies). Data are means ± s.e.m. Two-way repeated-measures ANOVA detected a significant interaction between time of day and genotype (P<0.0001). b, Sleep during a 24-hour day in homozygous carriers of the Dop1R2MB05108 allele (red, n=28 flies) and heterozygous controls (black, n=32 flies). Data are means ± s.e.m. Two-way repeated-measures ANOVA failed to detect a significant interaction between time of day and genotype (P=0.4736). c, Sleep in homozygous and heterozygous carriers of the Dop1R2MI08664 or Dop1R2MB05108 alleles (circles denote individual flies; horizontal lines indicate group means). Mann-Whitney tests detected a significant effect of the Dop1R2MI08664 allele (P=0.0219, red), but not of the Dop1R2MB05108 allele (P=0.6750). The Dop1R2MB05108 allele contains a transposon insertion in a non-coding region of the Dop1R2 gene, which reduces mRNA levels in homozygous carriers by only 14% (ref. 4), thus explaining the lack of a phenotype. The inability of Dop1R2MB05108 to suppress the short-sleeping phenotype of flies with enhanced dopaminergic transmission does therefore not argue against a role of Dop1R2 in the dFB. d, Sleep during a 24-hour day in flies expressing R23E10-GAL4 driven RNAi targeting Dop1R2 (red, n=48 flies) and parental controls (open symbols: R23E10-GAL4, n=48 flies; filled symbols: undriven UAS-Dop1R2RNAi, n=32 flies). Data are means ± s.e.m. Two-way repeated-measures ANOVA detected a significant interaction between time of day and genotype (P<0.0001). e, Average length of daytime sleep bouts in flies expressing R23E10-GAL4 driven RNAi targeting Dop1R2 and parental controls. Data are means ± s.e.m. One-way ANOVA detected a significant genotype effect (P=0.0015); red colour indicates a significant difference from both parental controls in pairwise post-hoc comparisons. f, Sleep in flies with temperature-inducible R23E10-GAL4 driven expression of pertussis toxin and parental controls (circles denote individual flies; horizontal lines indicate group means). Two-way ANOVA detected a significant interaction between genotype and temperature (P=0.0143); blue colour indicates a significant difference between inducing and non-inducing temperatures in pairwise post-hoc comparisons. g, Average length of daytime sleep bouts in flies with temperature-inducible R23E10-GAL4 driven expression of pertussis toxin and parental controls. Data are means ± s.e.m. Two-way ANOVA detected a significant interaction between genotype and temperature (P=0.0002); blue colour indicates a significant increase upon switching from non-inducing to inducing temperatures in pairwise post-hoc comparisons.
Extended Data Figure 3
Extended Data Figure 3. Dopamine hyperpolarizes dFB neurons and inhibits their spiking.
a, Membrane potential of a dFB neuron during a 250 ms pulse of dopamine. b, Average amplitude of hyperpolarization evoked by dopamine in the indicated numbers of cells. Data are means ± s.e.m. Kruskal-Wallis test detected a significant difference between groups (P<0.0001); asterisks indicate significant differences from control conditions in pairwise post-hoc comparisons.
Extended Data Figure 4
Extended Data Figure 4. Optogenetic stimulation of dopaminergic neurons switches dFB neurons to quiescence.
Flies expressing CsChrimson under TH-GAL4 control in dopaminergic neurons were photostimulated with 3 ms pulses of 630 nm light at 20 Hz. a, Voltage responses to identical current steps were recorded in the same cell, before and after optogenetic stimulation of dopaminergic neurons (black and red traces). Red and gray traces in the OFF state (right) indicate current injections matching or exceeding those shown in the ON state, respectively (left). b,c, Time courses of changes in input resistance (Rm) and membrane time constant (Tm) of dFB neurons during optogenetic stimulation of dopaminergic neurons (n=7 cells). Data are means ± s.e.m. One-way repeated-measures ANOVA detected significant effects of time (P=0.0135 for Rm; P=0.0222 for Tm).
Extended Data Figure 5
Extended Data Figure 5. Membrane properties of dFB neurons in the ON state.
a, Input resistances (Rm) of the indicated numbers of cells. Data are means ± s.e.m. Kruskal-Wallis test failed to detect a significant difference between groups (P=0.8997). b, Membrane time constants (Tm) of the indicated numbers of cells. Data are means ± s.e.m. Kruskal-Wallis test failed to detect a significant difference between groups (P=0.1682).
Extended Data Figure 6
Extended Data Figure 6. Measurements of potassium currents in voltage clamp.
a, Voltage steps from a holding potential of –110 mV (top) elicited the full complement of potassium currents expressed by a dFB neuron (Itotal, bottom). b, Stepping the same neuron from a holding potential of –30 mV (top) elicited potassium currents lacking the A-type component (Inon-A, bottom). c, Digital subtraction of Inon-A (b, bottom) from Itotal (a, bottom) yielded an estimate of IA. Note the expanded timescale. d, Individual (gray) and average (black) A-type currents of 7 dFB neurons, evoked by step depolarization to 40 mV. The magenta line represents a single-exponential fit to the average.
Extended Data Figure 7
Extended Data Figure 7. Loss of Shaker and its interacting partners, Hyperkinetic and Sleepless, from dFB neurons has similar effects on sleep.
Sleep in flies expressing R23E10-GAL4 driven RNAi targeting Shaker, Hyperkinetic, or Sleepless and parental controls (circles denote individual flies; horizontal lines indicate group means). One-way ANOVA detected a significant genotype effect (P<0.0001); green colour indicates significant differences from both parental controls in pairwise post-hoc comparisons.
Figure 1
Figure 1. Optogenetic stimulation of dopaminergic neurons silences dFB neurons and promotes awakening.
a, Membrane potential (black) of a dFB neuron and simultaneously recorded movement (blue) of a fly expressing CsChrimson in dopaminergic neurons. b, Spike rasters of dFB neurons in 38 trials. Photostimulation elicited a behavioural response in 32 trials (top) and no response in 6 trials (bottom). c, Individual (gray) and average (black) membrane potentials during the 32 trials with a behavioural response. Spikes are blanked for clarity. d, Membrane potential (black) of a dFB neuron and simultaneously recorded movement (blue) of a fly lacking CsChrimson expression in dopaminergic neurons. e, Spike rasters of dFB neurons in 59 trials. Photostimulation elicited a behavioural response in 2 trials (top) and no response in 57 trials; of these, 36 were randomly selected for display (bottom). f, Individual (gray) and average (black) membrane potentials during the 57 trials without a behavioural response. Spikes are blanked for clarity.
Figure 2
Figure 2. Dopamine inhibits dFB neurons via Dop1R2 and the transient opening of a potassium conductance.
a, Sleep in flies expressing R23E10-GAL4 driven RNAi targeting dopamine receptors and parental controls (circles: individual flies; horizontal lines: group means). One-way ANOVA detected a significant genotype effect (P<0.0001); red colour indicates a significant difference from both parental controls in pairwise post-hoc comparisons. b, R23E10-GAL4 driven CD8::GFP expression in dFB neurons (top). Placement of pipettes for whole-cell recording and pharmacological stimulation (bottom). c, Membrane potentials of dFB neurons following a 250 ms pulse of dopamine, in control conditions of low intracellular chloride (1 mM; black, top and bottom); in cells expressing R23E10-GAL4 driven RNAi targeting Dop1R2 (red, top); in the presence of 2 µg/ml intracellular pertussis toxin (blue, top); in elevated intracellular chloride (141 mM; light gray, bottom); and in intracellular caesium (140 mM; dark gray, bottom). Traces are averages of 5 dopamine applications.
Figure 3
Figure 3. Dopamine switches dFB neurons to quiescence via reciprocal modulation of two potassium conductances.
a, A switching cycle in current clamp. Voltage responses to current steps were recorded in the same cell, before and after the application of dopamine. Red and gray traces in the OFF state (centre) indicate responses to current injections matching or exceeding those in the ON states, respectively. b,c, Time courses of changes in input resistance (Rm) and membrane time constant (Tm) of dFB neurons during the application of dopamine, in controls (black, n=15 cells) and cells expressing R23E10-GAL4 driven RNAi targeting Dop1R2 (red, n=8 cells). Data are means ± s.e.m. Two-way repeated-measures ANOVA detected significant interactions between time and genotype (P<0.0001 for Rm; P<0.0001 for Tm). d, Movement rasters of 6 flies before, during, and after bilateral applications of dopamine to dFB neuron dendrites. Vertical marks denote rotations of the treadmill (surface velocity > 4mm/s, duration > 50 ms). Red colour indicates the period of dopamine application, which started at 0 min (with the monitored dFB neuron in the ON state) and stopped when Rm fell to ~60% of its initial value. The arrowhead marks the spontaneous return to the ON state of the dFB neuron recorded in fly 1. Note the absence of movement thereafter. e, A switching cycle in voltage clamp. A-type (IA, green) and non-A-type (Inon-A, blue) potassium currents evoked by voltage steps were recorded in the same cell, before and after the application of dopamine. f, Average (n=7 cells) current-voltage relationships of IA in the ON state (white fills) and after dopamine-induced switching to the OFF state (red fills). Data are means ± s.e.m. Two-way repeated-measures ANOVA detected a significant interaction between voltage and neuronal state (P<0.0001). g, Average (n=7 cells) current-voltage relationships of Inon-A in the ON state (white fills) and after dopamine-induced switching to the OFF state (red fills). Data are means ± s.e.m. Two-way repeated-measures ANOVA detected a significant interaction between voltage and neuronal state (P<0.0001).
Figure 4
Figure 4. The targets of antagonistic modulation by dopamine—Shaker and Sandman—have opposing effects on sleep.
a, Sleep in flies expressing R23E10-GAL4 driven RNAi targeting KV or K2P channels and parental controls (circles: individual flies; horizontal lines: group means). One-way ANOVA detected significant genotype effects (P<0.0001 for KV channels; P<0.0001 for K2P channels); green and blue colours indicate significant differences from both parental controls in pairwise post-hoc comparisons. b, Voltage responses of two dFB neurons to current steps, before and after the application of dopamine. The neurons expressed R23E10-GAL4 driven RNAi targeting Shaker (green, top) or Sandman (blue, bottom). c, Amplitudes of IA at 40 mV (left) and Inon-A at –40 mV (right) in controls (black, n=7 cells), neurons expressing R23E10-GAL4 driven RNAi targeting Shaker (green, n=7 cells) or Sandman (blue, n=8 cells), and in the presence of 1.5 µg/ml intracellular BoNT/C (orange, n=8 cells), in the ON state (white fills) and after dopamine-induced switching to the OFF state (red fills). Data are means ± s.e.m. Two-way repeated-measures ANOVA detected significant effects of experimental condition (P=0.0426) and neuronal state (P<0.0001) on IA, and a significant interaction between experimental condition and neuronal state for Inon-A (P=0.0018). IA was reduced in cells expressing ShakerRNAi relative to all other groups (P=0.0409). Inon-A differed between ON and OFF states in controls (P=0.0005) and cells expressing ShakerRNAi (P=0.0003), but not in cells expressing SandmanRNAi (P=0.9119) or containing BoNT/C (P=0.9119); Inon-A in the ON state did not differ among groups (P=0.0782). d, Frequency and cumulative frequency distributions (inset) of interspike intervals in controls (black) and neurons expressing R23E10-GAL4 driven RNAi targeting Shaker (green) or Sandman (blue). The interspike interval distribution of neurons expressing ShakerRNAi differed from that of the other groups (P<0.0001 for both comparisons; Kolmogorov-Smirnov test). e,f, Time courses of changes in input resistance (Rm) and membrane time constant (Tm) during the application of dopamine, in controls (black, n=15 cells), neurons expressing R23E10-GAL4 driven RNAi targeting Shaker (green, n=6 cells) or Sandman (blue, n=7 cells), and in the presence of 1.5 µg/ml intracellular BoNT/C (orange, n=8 cells). Data are means ± s.e.m. Two-way repeated-measures ANOVA detected a significant interaction between time and experimental condition (P<0.0001 for Rm; P<0.0001 for Tm). dFB neurons expressing SandmanRNAi or containing BoNT/C differed from controls (P<0.0001 for all pairwise comparisons), but flies expressing ShakerRNAi did not (P=0.9993 for Rm; P=0.8743 for Tm). g, Membrane potentials of dFB neurons following a 250 ms pulse of dopamine, in control flies (black), flies expressing R23E10-GAL4 driven RNAi targeting Shaker (green) or Sandman (blue), and in the presence of 1.5 µg/ml intracellular BoNT/C (orange). Traces are averages of 5 dopamine applications.

Comment in

  • Neuroscience: Flipping the sleep switch.
    Dissel S, Shaw PJ. Dissel S, et al. Nature. 2016 Aug 18;536(7616):278-80. doi: 10.1038/nature18918. Epub 2016 Aug 3. Nature. 2016. PMID: 27487223 No abstract available.

References

    1. Saper CB, Fuller PM, Pedersen NP, Lu J, Scammell TE. Sleep state switching. Neuron. 2010;68:1023–1042. - PMC - PubMed
    1. Donlea JM, Thimgan MS, Suzuki Y, Gottschalk L, Shaw PJ. Inducing sleep by remote control facilitates memory consolidation in Drosophila. Science. 2011;332:1571–1576. - PMC - PubMed
    1. Donlea JM, Pimentel D, Miesenböck G. Neuronal machinery of sleep homeostasis in Drosophila. Neuron. 2014;81:860–872. - PMC - PubMed
    1. Liu Q, Liu S, Kodama L, Driscoll MR, Wu MN. Two dopaminergic neurons signal to the dorsal fan-shaped body to promote wakefulness in Drosophila. Curr Biol. 2012;22:2114–2123. - PMC - PubMed
    1. Lima SQ, Miesenböck G. Remote control of behavior through genetically targeted photostimulation of neurons. Cell. 2005;121:141–152. - PubMed

Publication types

MeSH terms