. 2016 Aug 18;536(7616):344-348.
doi: 10.1038/nature18958. Epub 2016 Aug 3.

Asymmetric division of contractile domains couples cell positioning and fate specification

Affiliations

Asymmetric division of contractile domains couples cell positioning and fate specification

Jean-Léon Maître et al. Nature. .

Abstract

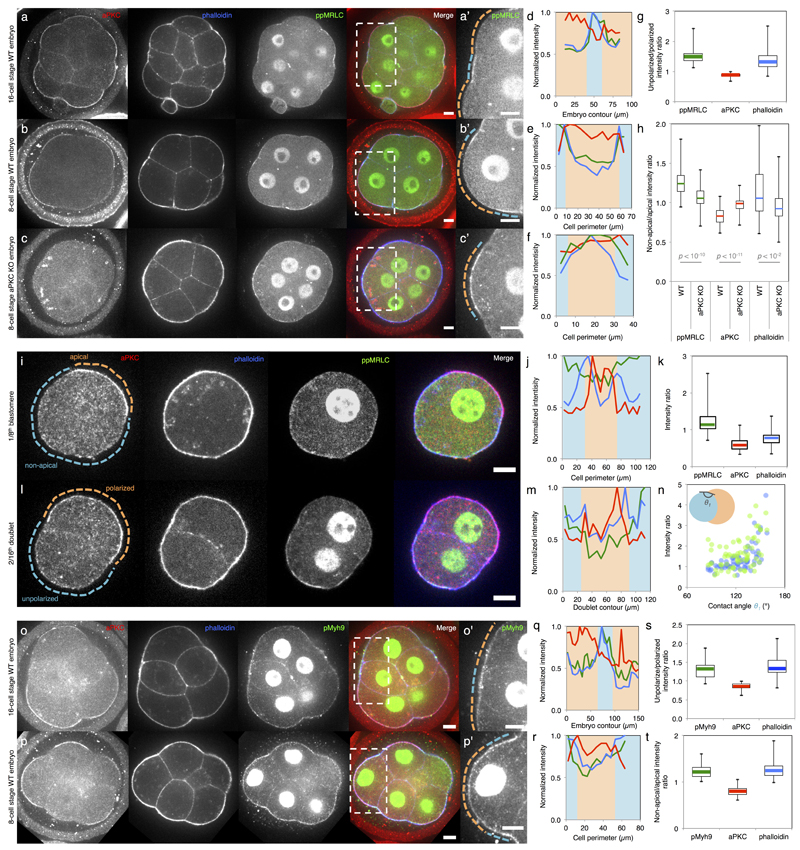
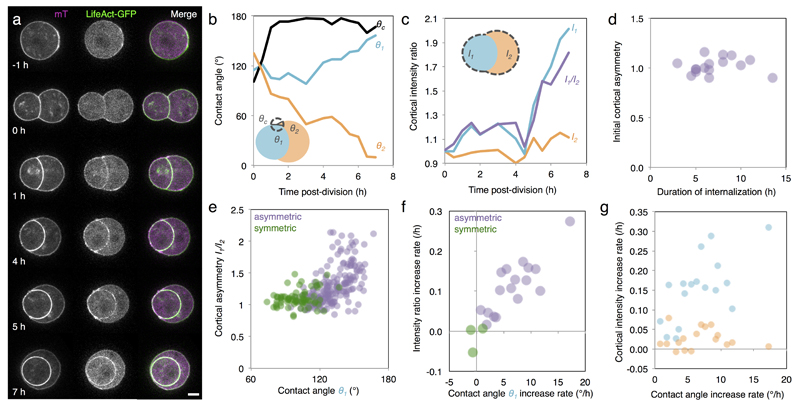
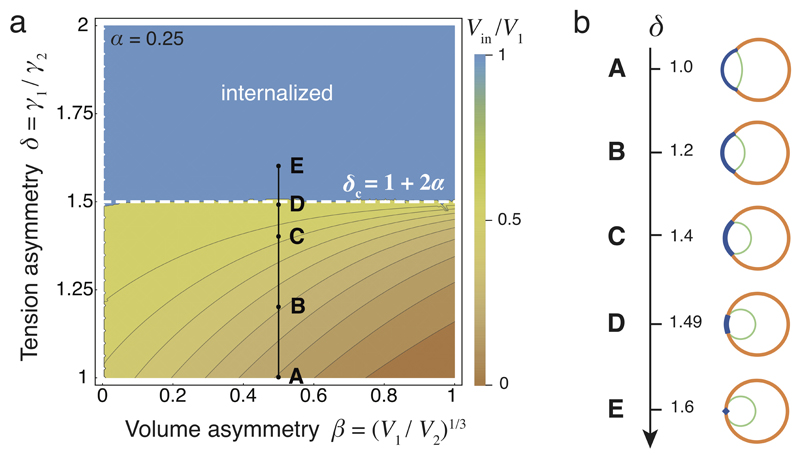
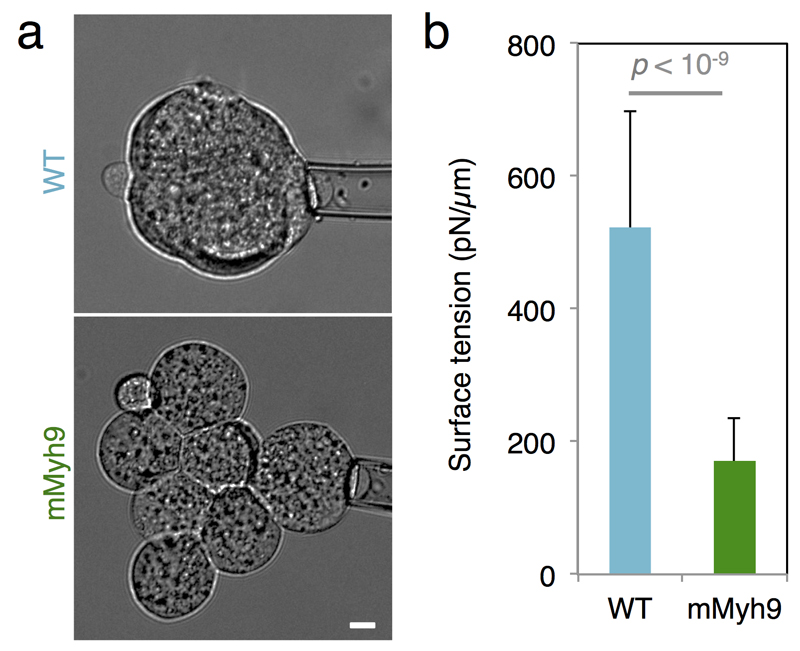
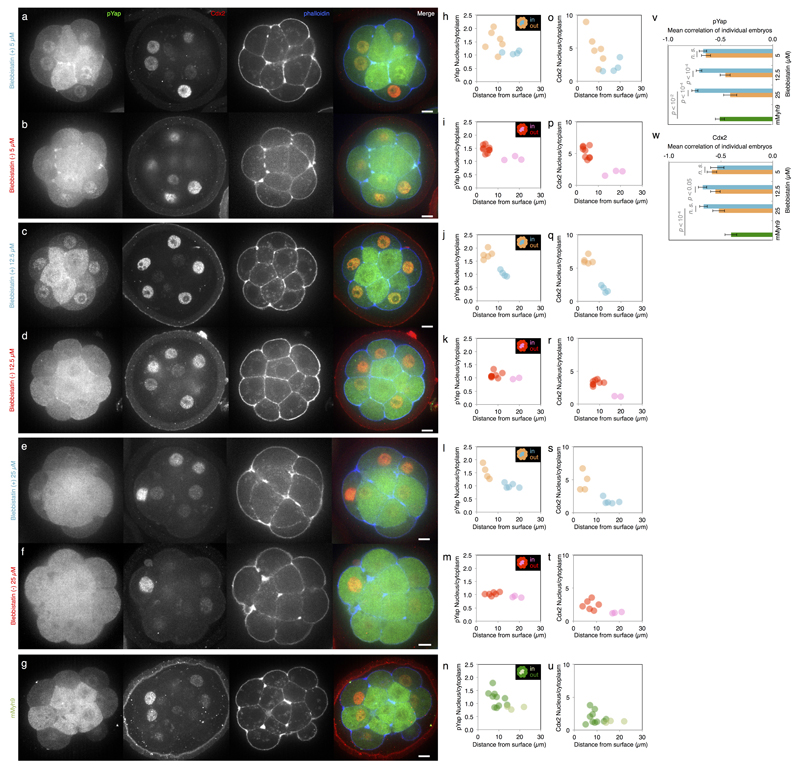
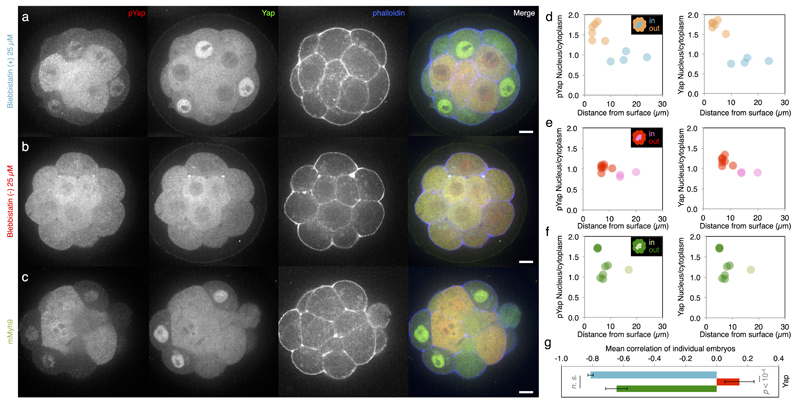
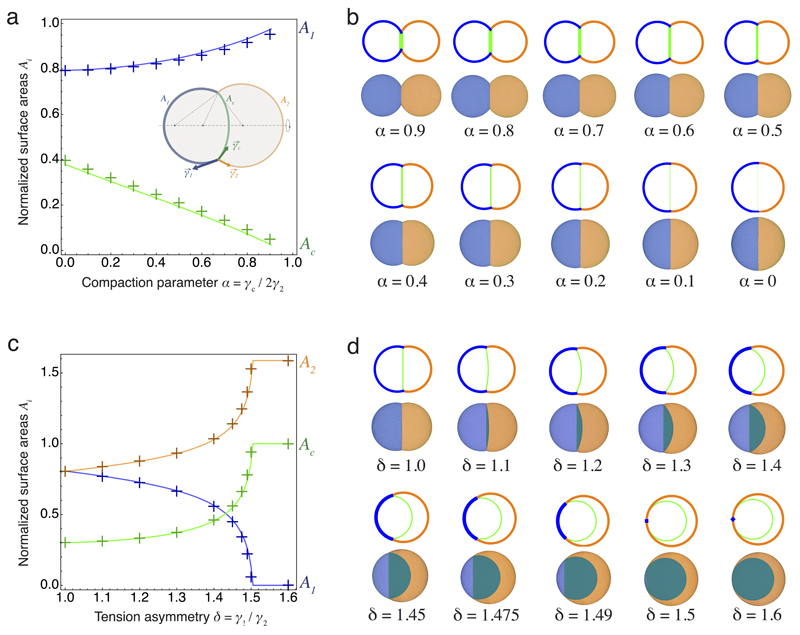
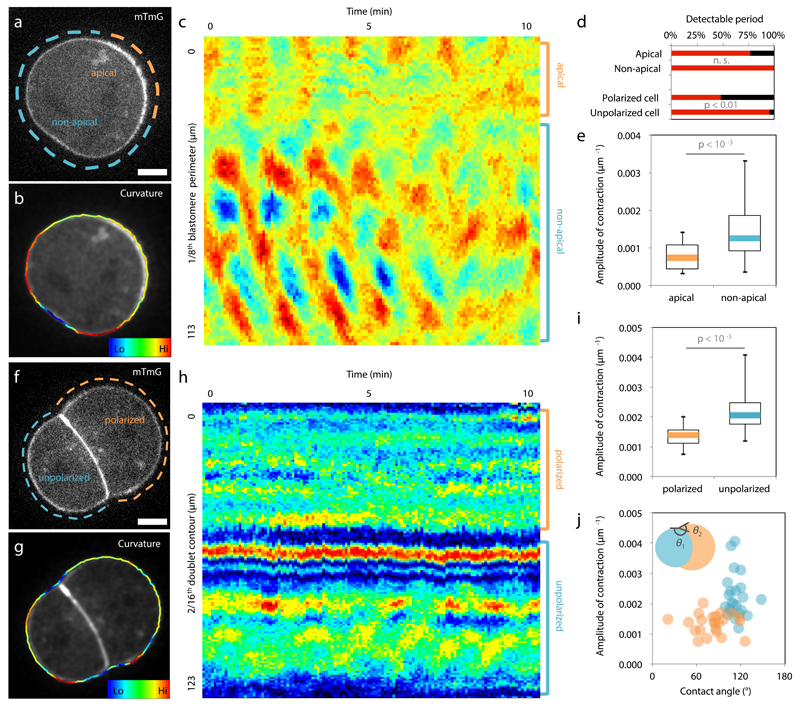
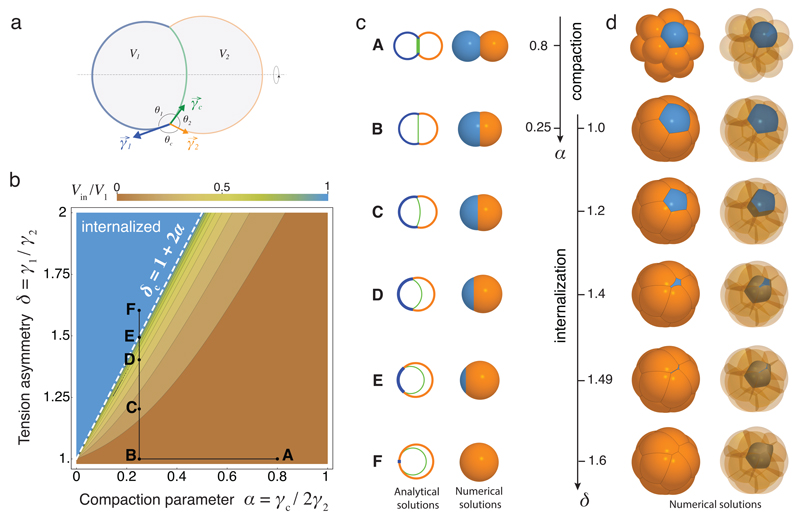
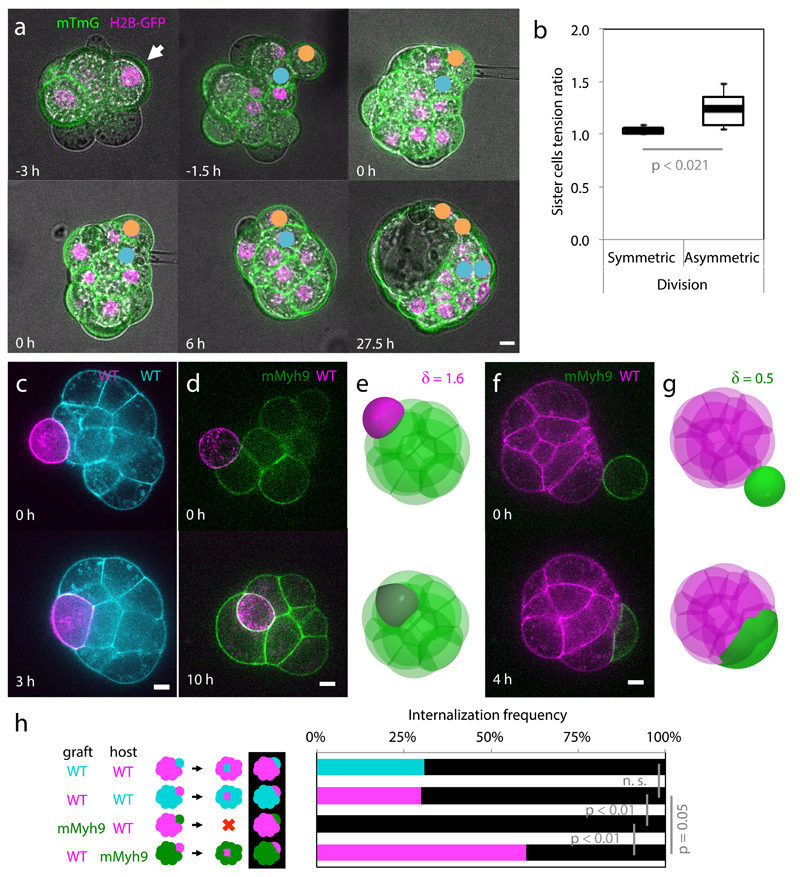
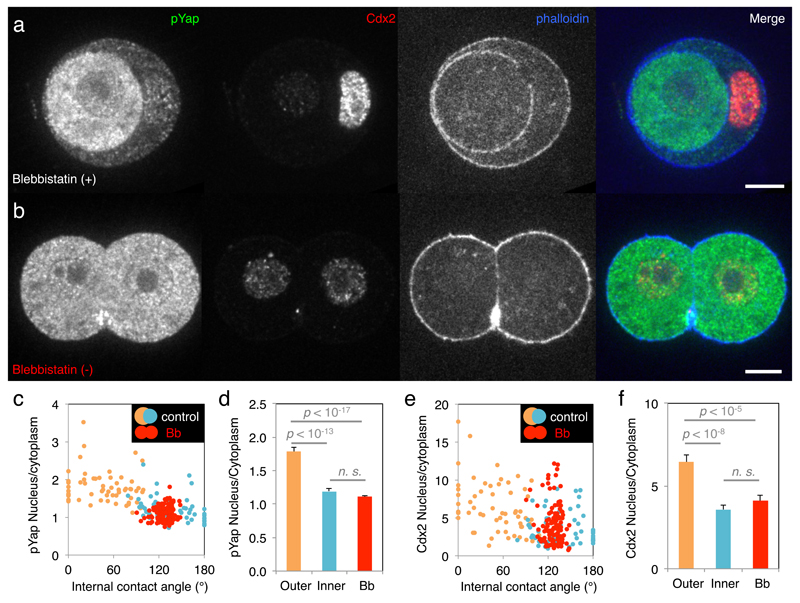
During pre-implantation development, the mammalian embryo self-organizes into the blastocyst, which consists of an epithelial layer encapsulating the inner-cell mass (ICM) giving rise to all embryonic tissues. In mice, oriented cell division, apicobasal polarity and actomyosin contractility are thought to contribute to the formation of the ICM. However, how these processes work together remains unclear. Here we show that asymmetric segregation of the apical domain generates blastomeres with different contractilities, which triggers their sorting into inner and outer positions. Three-dimensional physical modelling of embryo morphogenesis reveals that cells internalize only when differences in surface contractility exceed a predictable threshold. We validate this prediction using biophysical measurements, and successfully redirect cell sorting within the developing blastocyst using maternal myosin (Myh9)-knockout chimaeric embryos. Finally, we find that loss of contractility causes blastomeres to show ICM-like markers, regardless of their position. In particular, contractility controls Yap subcellular localization, raising the possibility that mechanosensing occurs during blastocyst lineage specification. We conclude that contractility couples the positioning and fate specification of blastomeres. We propose that this ensures the robust self-organization of blastomeres into the blastocyst, which confers remarkable regulative capacities to mammalian embryos.


Conflict of interest statement

The authors declare no competing financial interests.

Figures

Extended Data Figure 1
Extended Data Figure 1. aPKC antagonizes myosin phosphorylation at the apical domain
(a-c) Immunostaining of 16- (a) and 8-cell stage wild-type (b) and aPKC KO (c) embryos showing aPKC (red), phalloidin (blue) and ppMRLC (green, bi-phosphorylated Myosin Regulatory Light Chain). Enlarged images of ppMRLC are shown in a’-c’. (d-f) Cortical intensity profiles under the dotted lines in a’-c’. Apical domains highlighted in orange and non-apical regions in blue. (g-h) Boxplot of unpolarized/polarized blastomere intensity ratio at the 16-cell stage (43 neighbouring blastomeres from 35 embryos from 3 experiments) and non-apical/apical intensity ratio at the 8-cell stage for WT and aPKC KO embryos (68 and 58 blastomeres from 22 and 12 embryos from 2 and 3 experiments respectively). ppMRLC in green, aPKC in red and phalloidin in blue. Student t test p values between WT and aPKC KO. At the 16-cell stage (a, d, g), blastomeres showing accumulations of ppMRLC and phalloidin at their cell-medium interfaces have less aPKC. At the 8-cell stage, the apical domain does not occupy the entirety of the cell-medium interface (b, e). The aPKC-rich apical domain shows less myosin than the aPKC-poor region of the cortex (b, e, h). In aPKC KO embryos (c, f, h), no aPKC-rich, nor ppMRLC-poor regions can observed at the cell-medium interface of blastomeres. (i) Immunostaining of 8-cell stage blastomeres showing aPKC (red), phalloidin (blue), ppMRLC (green) and merged staining. The apical domain is highlighted in orange, the non-apical cortex in blue. Scale bar 10 µm. (j) Intensity profile along the cell perimeter showing aPKC (red), phalloidin (blue) and ppMRLC (green). The apical intensity is highlighted in orange the non-apical cortex in blue. (k) Box plot of apical and non-apical intensity ratio of cortical aPKC (red), phalloidin (blue) and ppMRLC (green) for 27 blastomeres from 3 experiments. Blastomeres isolated at the 8-cell stage show an aPKC-rich region (i-k), which has less cortical ppMRLC and phalloidin than the aPKC-poor region of the cell-medium interface. The ppMRLC- and actin-rich regions are distinct from the baso-lateral domain of cells (their cell-cell contact), which have less ppMRLC and actin (a, b, c, l). This ppMRLC cortical region is therefore labeled “non-apical”. (l) Immunostaining of doublets of 16-cell stage blastomeres showing aPKC (red), phalloidin (blue), ppMRLC (green) and merged staining. The polarized blastomere is highlighted in orange, the unpolarized one in blue. Scale bar 10 µm. (m) Intensity profile along the doublet perimeter showing aPKC (red), phalloidin (blue) and ppMRLC (green). The polarized blastomere is highlighted in orange, the unpolarized one in blue. Blastomeres isolated at the 8-cell stage divide to give rise to doublets of 16-cell stage blastomeres,. The polarized sister cell shows high aPKC and low ppMRCL/phalloidin at their cell-medium interfaces when compared to the non-polarized sister cell (l, m). (n) Cortical intensity ratio of ppMRLC (green) and phalloidin (blue) between the inner and outer cells as a function of the inner contact angles θ1 (Pearson R = 0.464 and 0.614, n = 67 doublets from 2 experiments, p < 0.001). During the 16-cell stage, polarized blastomeres can envelop their unpolarized sister blastomeres (Supplementary Video 5),. As envelopment occurs, the internal contact angles change (Extended Data Fig. 2). As the internal contact angles change, the asymmetry in cortical ppMRLC and phalloidin between sister blastomeres changes. After another division, a cyst consisting of 4 blastomeres forms (Supplementary Video 5). This structure is equivalent to the blastocyst in terms of gene expression (Figure 4). (o-p) Immunostaining of 16- (o) and 8-cell stage (p) embryos showing aPKC (red), phalloidin (blue) and pMyh9 (green, Myosin heavy chain phosphorylated on S1943). Enlarged images of ppMRLC are shown in o’-p’. (q-r) Cortical intensity profiles under the dotted lines in o’-p’. Apical domains highlighted in orange and non-apical regions in blue. (s-t) Boxplot of unpolarized/polarized blastomere intensity ratio at the 16-cell stage (24 neighbouring blastomeres from 16 embryos from 3 experiments) and non-apical/apical intensity ratio at the 8-cell stage (34 blastomeres from 10 embryos from 3 experiments). pMyh9 in green, aPKC in red and phalloidin in blue.
Extended Data Figure 2
Extended Data Figure 2. Cortical asymmetries intensify during the 16-cell stage
(a) Time-lapse of mTmG (magenta) and LifeAct-GFP (green) expressing doublets of 16-cell stage blastomeres. Scale bar 10 µm. (b-c) External (θc), and internal (θ1 and θ2) contact angles (b) and cortical LifeAct-GFP intensities of unpolarized I1 and polarized I2 blastomeres and intensity ratio I1/I2 (c) over time for the doublet shown in (a). Blastomeres isolated at the 8-cell stage can divide asymmetrically to give rise to a polarized blastomere that will envelop its unpolarized sister blastomere (a). The external contact angle θc shows a rapid re-compaction of the cell doublet after division (b). The internal contact angles θ1 and θ2 indicate the progression of the envelopment process (b). As this happens, the cortical intensity of LifeAct-GFP of the internalizing blastomere I1 increases while the one of the enveloping blastomere I2 remains comparably more stable (c). This increases the cortical asymmetry I1/I2 (c). (d) Initial cortical asymmetry over internalization time of doublets of 16-cell stage blastomeres (Pearson R = 0.064, n = 16 doublets from 4 experiments p > 0.1). The initial cortical asymmetry, calculated within 30 min after division, is 1.0 ± 0.1 (Mean ± SD, n = 17 doublets from 4 experiments) and does not control the time it takes for envelopment to occur (d). (e) Intensity ratio as a function of the contact angle θ1 of doublets throughout the 16-cell stage blastomeres (Pearson R = 0.573, 186 measurements on 17 asymmetric doublets (purple), p < 0.001 and Pearson R = 0.266, 69 measurements on 3 symmetric (green) doublets, p < 0.1, from 4 experiments). As the internal contact angles change, the asymmetry in cortical LifeAct-GFP between sister blastomeres with distinct polarity changes. (f) Cortical intensity ratio increase rate as a function of the contact angle θ1 increase rate (Pearson R = 0.824, n = 17 asymmetric (purple), p < 0.001, and Pearson R = 0.393, n = 3 symmetric (green) doublets, p > 0.1, from 4 experiments). (g) Cortical intensity increase rate as a function of the contact angle increase rate for the polarized (orange, Pearson R = -0.026, n = 17 asymmetric doublets, p > 0.1) and unpolarized blastomere (blue, Pearson R = 0.658, n = 17 asymmetric doublets, p < 0.01) of a doublet resulting from asymmetric division or of two polarized cells resulting from a symmetric division (green, Pearson R = -0.011, n = 3 symmetric doublets, p > 0.1), from 4 experiments. The rates are correlated, which suggests that the dynamics of internalization and the dynamics of building up of cortical asymmetries are linked.
Extended Data Figure 3
Extended Data Figure 3. Cell size has no influence on internalization
(a) Phase diagram describing the mechanical equilibrium of a cell within a doublet or embryo as function of the cell size asymmetry parameter β and the tension asymmetry parameter δ, for a fixed compaction parameter α = 0.25. The color code measures the degree of internalization, defined as the proportion of internalized volume Vin/V1, which equals 1 for the internalized cell. The dotted line indicates the threshold value δc at which internalization occurs. An example of internalization with β = 0.5 is indicated in black (from A to E). Changing the volume asymmetry does not change the internalization threshold. (b) Internalization of a doublet with β = 0.5 obtained with the analytical model for the same values of δ as indicated in the diagram from A to E.
Extended Data Figure 4
Extended Data Figure 4. Contractility is required for internalization
(a) Brightfield images of tension measurement on WT (top) and mMyh9 (bottom) 8-cell stage embryos. Scale bar 10 µm. (b) Mean ± SD of 25 blastomeres from 4 WT embryos and 26 blastomeres from 7 mMyh9 embryos from 2 experiments, Student t test p < 10-9.
Extended Data Figure 5
Extended Data Figure 5. Control of pYap and Cdx2 localization by contractility in a dose dependent manner
(a-g) Immunostaining of wild-type embryos treated for 3 h with Bb(+) at 5 (a), 12.5 (c) or 25 (e) µM or with Bb(-) at 5 (b), 12.5 (d) or 25 (f) µM or of mMyh9 embryos (g) showing phosphorylated Yap (pYap, green), Cdx2 (red) and phalloidin (blue). (h-u) Nucleus to cytoplasm intensity ratio of pYap (h-n) or Cdx2 (o-u) as a function of the distance from the surface for WT embryo treated with Bb(+) (outer cells in orange and inner cells in blue) at 5 (h, o, corresponding embryo shown in a), 12.5 (j, q, corresponding embryo shown in c) or 25 (l, s, corresponding embryo shown in e) µM or with Bb(-) (outer cells in red and inner cells in pink) at 5 (i, p, corresponding embryo shown in b), 12.5 (k, r, corresponding embryo shown in d) or 25 (m t, corresponding embryo shown in f) µM and for mMyh9 embryos (n, u, corresponding embryo shown in g). (v-w) Mean ± SEM Pearson correlation values between the nucleus to cytoplasm intensity ratio of pYap (v) or Cdx2 (w) as a function of the distance from the surface from individual embryos. 207 blastomeres from 20 embryos for Bb(+) 5 µM, 252 blastomeres from 29 embryos for Bb(+) 12.5 µM, 179 blastomeres from 18 embryos for Bb(-) 5 µM and 267 blastomeres from 28 embryos for Bb(-) 12.5 µM from 3 experiments each. 281 cells from 28 embryos from 5 experiments for pYap and 136 cells from 13 embryos from 4 experiments for Cdx2 for 25 µM Bb(+), 241 cells from 32 embryos from 5 experiments for pYap and 192 cells from 22 embryos from 4 experiments for Cdx2 for 25 µM Bb(-) and 349 cells from 32 embryos from 6 experiments for pYap and 217 cells from 21 embryos from 3 experiments for Cdx2 for mMyh9. Student t test p values, n. s. for not significant.
Extended Data Figure 6
Extended Data Figure 6. Contractility controls Yap sub-cellular localization
(a-c) Immunostaining of wild-type embryos treated with 25 µM Bb(+) (a, an inactive enantiomere of the inhibitor) or Bb(-) (b, the selective inhibitor of myosin II ATPase activity) for 3 h or mMyh9 embryos (c) showing Yap (green), phosphorylated Yap (pYap, red) and phalloidin (blue). (d-f) Nucleus to cytoplasm intensity ratio of pYap (left) and Yap (right) as a function of the distance from the surface for WT embryo treated with 25 µM Bb(+) (d, outer cells in orange and inner cells in blue, corresponding embryo shown in a) or Bb(-) (e, outer cells in magenta and inner cells in red, corresponding embryo shown in b) or mMyh9 embryo (f, outer cells in dark green and inner cells in light green, corresponding embryo shown in c). (g) Mean ± SEM Pearson correlation values between the nucleus to cytoplasm intensity ratio of Yap as a function of the distance from the surface from individual embryos. 252 cells from 29 embryos for Bb(+), 201 cells from 26 embryos for Bb(-) and 132 cells from 12 embryos for mMyh9 from 3 experiments each. Student t test p value is shown, n. s. for not significant.
Extended Data Figure 7
Extended Data Figure 7. Quantitative comparison between analytical and numerical results
(a) Comparison of the surface areas of the cell-medium (blue) and cell-cell interfaces (green) between the simulations (crosses) and the analytical model (plain lines) for different values of the compaction parameter α between 0 and 1. A schematic diagram of a cell doublet defining the cell-medium and cell-cell surface tensions γ1, γ2 and γc and areas A1, A2 and Ac are shown as an inset. (b) Configurations of doublets as predicted by the analytical model and simulations for the discrete values of α corresponding to the plot in (a). (c) Comparison of the surface areas of the cell-medium interfaces of cell 1 (blue), 2 (orange) and of the cell-cell interface (green) between the simulations (crosses) and the analytical model (plain lines) for different values of the tension asymmetry parameter δ between 1 and 1.6 t fixed compaction parameter α = 0.25. (d) Configurations of doublets as predicted by the analytical model and simulations for the discrete values of δ corresponding to the plot in (b).
Figure 1
Figure 1. Asymmetric inheritance of the apical domain generates blastomeres of different contractility
(a-c) 8-cell stage blastomere expressing mTmG (a) with color-coded surface curvature (b) and corresponding kymograph (c). Apical domain highlighted in orange and non-apical cortex in blue. (d) Proportion of blastomeres for which a contraction period can be detected (17 blastomeres and 23 doublets from 4 and 5 experiments respectively). Mann-Whitney U test p value, n. s. for not significant. (e) Boxplot of contraction amplitudes for apical (orange) and non-apical cortex (blue). 17 blastomeres from 4 experiments, Student t test p value. (f-h) Doublet of 16-cell stage blastomeres expressing mTmG (f) with color-coded surface curvature (g) and corresponding kymograph (h). Polarized blastomere highlighted in orange, unpolarized one in blue. (i) Boxplot of contraction amplitudes for polarized (orange) and unpolarized blastomeres (blue). 23 doublets from 5 experiments, Student t test p value. (j) Amplitude of contractions as a function of the contact angles θ1 for polarized (orange) and θ2 for unpolarized blastomeres (blue, Pearson R = -0.611, n = 46 blastomeres from 5 experiments, p < 0.001). Scale bar 10 µm.
Figure 2
Figure 2. Physical model of cell internalization
(a) Schematic diagram of a cell doublet with surface tensions γ1, γ2 and γc of the cell 1 (blue), 2 (orange) and the contact (green) respectively. Contact angles θ1, θ2 and θc and cell volumes V1 and V2 are also shown. (b) Phase diagram describing the mechanical equilibrium of a doublet as a function of the compaction parameter α and tension asymmetry δ. Color-coded degree of internalization (measured as the relative volume of cell 1 that is internalized Vin/V1), threshold value δc at which internalization occurs (white dotted line) and an example of compaction (A to B) followed by internalization (B to F) in black (Supplementary Video 3-4) are overlaid. (c-d) Analytical (left) and numerical solutions (right) for a doublet (c). Numerical solutions (d) for the compaction of 16 cells with opaque (left) and transparent (right) non-internalizing cells. The compaction parameter α decreases from 0.8 to 0.25, followed by an increase of tension asymmetry δ from 1.0 to 1.6.
Figure 3
Figure 3. Tension heterogeneities drive cell sorting of the inner cell mass
(a) Lineage tracking of polarized (yellow) and unpolarized (blue) daughter cells after surface tension measurement of mTmG (green) H2B-GFP (magenta) expressing embryos. (b) Box plot of surface tension ratio for sister cells with (symmetric) or without (asymmetric) internalization of one of the sister cell. 8 and 7 pairs of cells from 11 embryos from 5 experiments, Student t test p values. (c-g) WT (magenta or cyan) or mMyh9 (green) blastomeres grafted onto host embryos (c, d, f). Simulations of grafting experiments: one cell with δ = 1.6 (e), corresponding to WT onto mMyh9 (d); one cell with δ = 0.5 (g), corresponding to mMyh9 onto WT (f). (h) Internalization frequencies for chimeric embryos (WT-WT (13 mG host embryos and 20 mTmG host embryos from 3 experiments) and WT-mMyh9 (12 mG host embryos and 20 mMyh9 host embryos from 4 experiments)). Black when no internalization occurs, Mann-Whitney U test p values, n. s. for not significant. Scale bar 10 µm.
Figure 4
Figure 4. Contractility couples morphogenesis and fate specification
(a-b) Immunostaining of doublets of 16-cell stage blastomeres treated with 25 µM Blebbistatin (Bb) (+) (a, an inactive enantiomere of the inhibitor) or Bb(-) (b, the selective inhibitor of myosin II ATPase activity) showing pYap (green), Cdx2 (red) and phalloidin (blue). (c-f) Nucleus to cytoplasm intensity ratio of pYap (c) or Cdx2 (e) as a function of the internal contact angle for doublets treated with Bb(+) (outer cells in orange and inner cells in blue, pYap R = -0.630, or Cdx2 R = -0.493, n = 59 doublets from 3 experiments, p < 0.001) or Bb(-) (red, pYap R = 0.158, or Cdx2 R = -0.118, n = 60 doublets from 3 experiments, p > 0.1). Mean ± SEM nucleus to cytoplasm intensity ratio of pYap (d) or Cdx2 (f). Doublets treated with Bb(+) show outer cells in orange, inner cells in blue while Bb(-) treated cells are in red. Student t test p values, n. s. for not significant.

Comment in

References

    1. Wennekamp S, Mesecke S, Nédélec F, Hiiragi T. A self-organization framework for symmetry breaking in the mammalian embryo. Nat Rev Mol Cell Biol. 2013;14:454–461. - PubMed
    1. Anani S, Bhat S, Honma-Yamanaka N, Krawchuk D, Yamanaka Y. Initiation of Hippo signaling is linked to polarity rather than to cell position in the pre-implantation mouse embryo. Development. 2014;141:2813–2824. - PubMed
    1. Samarage CR, et al. Cortical Tension Allocates the First Inner Cells of the Mammalian Embryo. Dev Cell. 2015;34:435–447. - PubMed
    1. Hirate Y, et al. Polarity-Dependent Distribution of Angiomotin Localizes Hippo Signaling in Preimplantation Embryos. Curr Biol. 2013;23:1181–1194. - PMC - PubMed
    1. Dard N, Louvet-Vallée S, Maro B. Orientation of mitotic spindles during the 8- to 16-cell stage transition in mouse embryos. PLoS ONE. 2009;4:e8171. - PMC - PubMed

Publication types

MeSH terms