Association of Lipid Fractions With Risks for Coronary Artery Disease and Diabetes
- PMID: 27487401
- PMCID: PMC5642865
- DOI: 10.1001/jamacardio.2016.1884
Association of Lipid Fractions With Risks for Coronary Artery Disease and Diabetes
Abstract
Importance: Low-density lipoprotein cholesterol (LDL-C) is causally related to coronary artery disease (CAD), but the relevance of high-density lipoprotein cholesterol (HDL-C) and triglycerides (TGs) is uncertain. Lowering of LDL-C levels by statin therapy modestly increases the risk of type 2 diabetes, but it is unknown whether this effect is specific to statins.
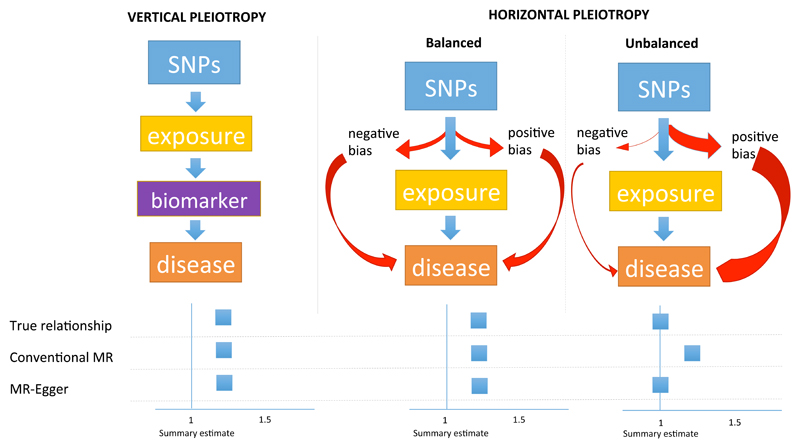
Objective: To investigate the associations of 3 routinely measured lipid fractions with CAD and diabetes through mendelian randomization (MR) using conventional MR and making use of newer approaches, such as multivariate MR and MR-Egger, that address the pleiotropy of genetic instruments where relevant.
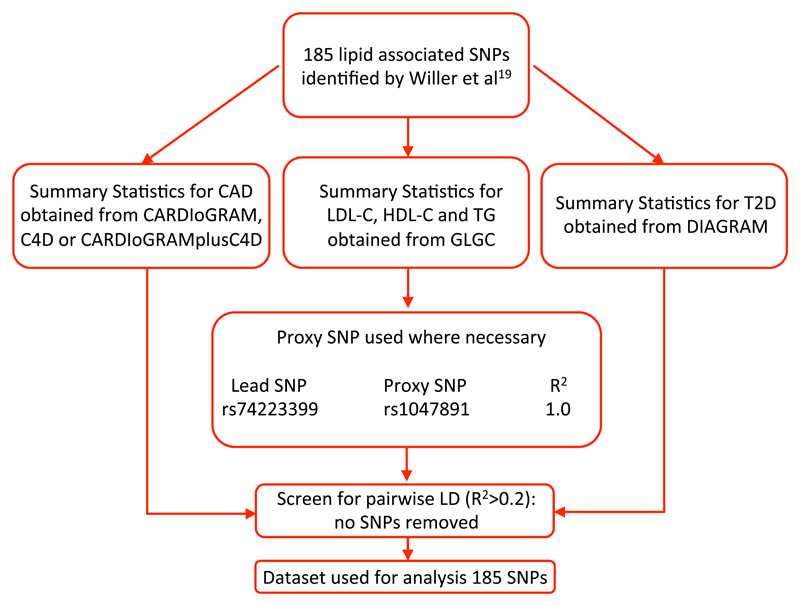
Design, setting, and participants: Published data from genome-wide association studies were used to construct genetic instruments and then applied to investigate associations between lipid fractions and the risk of CAD and diabetes using MR approaches that took into account pleiotropy of genetic instruments. The study was conducted from March 12 to December 31, 2015.
Main outcomes and measures: Coronary artery disease and diabetes.
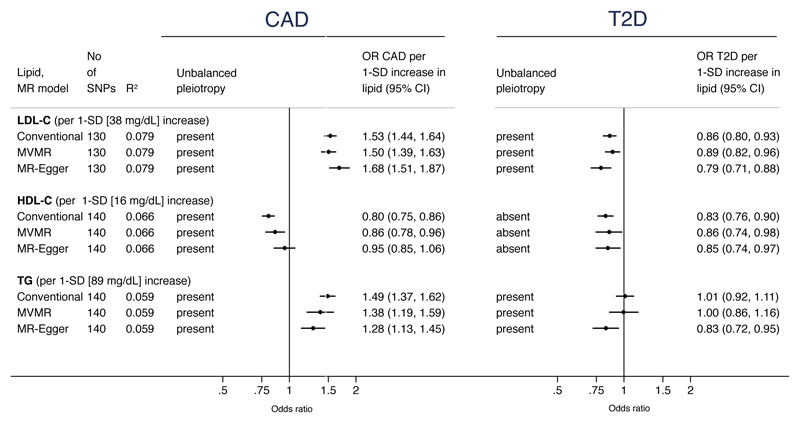
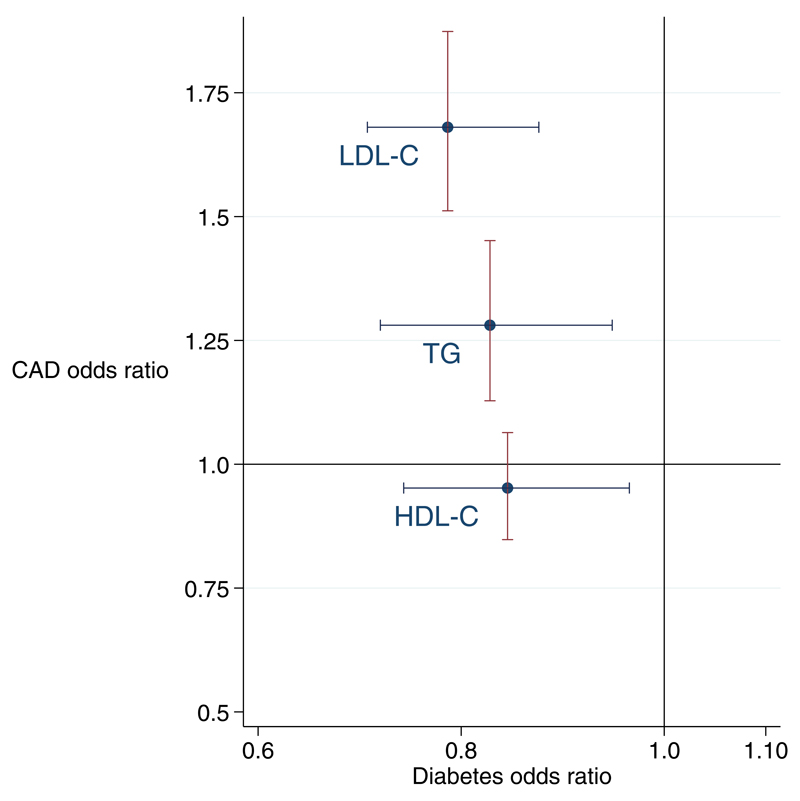
Results: Genetic instruments composed of 130 single-nucleotide polymorphisms (SNPs) were used for LDL-C (explaining 7.9% of its variance), 140 SNPs for HDL-C (6.6% of variance), and 140 SNPs for TGs (5.9% of variance). A 1-SD genetically instrumented elevation in LDL-C levels (equivalent to 38 mg/dL) and TG levels (equivalent to 89 mg/dL) was associated with higher CAD risk; odds ratios (ORs) were 1.68 (95% CI, 1.51-1.87) for LDL-C and 1.28 (95% CI, 1.13-1.45) for TGs. The corresponding OR for HDL-C (equivalent to a 16-mg/dL increase) was 0.95 (95% CI, 0.85-1.06). All 3 lipid traits were associated with a lower risk of type 2 diabetes. The ORs were 0.79 (95% CI, 0.71-0.88) for LDL-C and 0.83 (95% CI, 0.76-0.90) for HDL-C per 1-SD elevation. For TG, the MR estimates for diabetes were inconsistent, with MR-Egger giving an OR of 0.83 (95%CI, 0.72-0.95) per 1-SD elevation.
Conclusions and relevance: Routinely measured lipid fractions exhibit contrasting associations with the risk of CAD and diabetes. Increased LDL-C, HDL-C, and possibly TG levels are associated with a lower risk of diabetes. This information will be relevant to the design of clinical trials of lipid-modifying agents, which should carefully monitor participants for dysglycemia and the incidence of diabetes.
Conflict of interest statement
CTSU (University of Oxford) is the central co-ordinating centre for the REVEAL trial of anacetrapib; REVEAL is funded through a grant to the University of Oxford by Merck Sharp & Dohme Corp but was designed and is being conducted independently of the funder. DIS is a consultant to Pfizer on work unrelated to the present analysis. All other co-authors report no conflicts of interest. NS reports having received honoraria for advisory boards or lectures for Amgen, Sanofi, Boehringer Ingelheim, Novo Nordisk, Merck, Janssen and Astrazeneca.
Figures
Comment in
-
Disentangling the Causal Association of Plasma Lipid Traits and Type 2 Diabetes Using Human Genetics.JAMA Cardiol. 2016 Sep 1;1(6):631-3. doi: 10.1001/jamacardio.2016.2298. JAMA Cardiol. 2016. PMID: 27487162 No abstract available.
-
Difficulties in Testing the Instrument Strength Independent of Direct Effect Assumption in Mendelian Randomization.JAMA Cardiol. 2017 Aug 1;2(8):929-930. doi: 10.1001/jamacardio.2017.1572. JAMA Cardiol. 2017. PMID: 28564679 No abstract available.
References
-
- Stein EA, Mellis S, Yancopoulos GD, et al. Effect of a monoclonal antibody to PCSK9 on LDL cholesterol. The New England journal of medicine. 2012;366:1108–18. - PubMed
-
- Akdim F, Stroes ES, Sijbrands EJ, et al. Efficacy and safety of mipomersen, an antisense inhibitor of apolipoprotein B, in hypercholesterolemic subjects receiving stable statin therapy. Journal of the American College of Cardiology. 2010;55:1611–8. - PubMed
-
- Cannon CP, Blazing MA, Giugliano RP, et al. Ezetimibe Added to Statin Therapy after Acute Coronary Syndromes. The New England journal of medicine. 2015 - PubMed
Publication types
MeSH terms
Substances
Grants and funding
LinkOut - more resources
Full Text Sources
Other Literature Sources
Medical
Miscellaneous