. 2016 Aug 4:17:541.
doi: 10.1186/s12864-016-2848-2.

ABSSeq: a new RNA-Seq analysis method based on modelling absolute expression differences

Affiliations

ABSSeq: a new RNA-Seq analysis method based on modelling absolute expression differences

Wentao Yang et al. BMC Genomics. .

Abstract

Background: The recent advances in next generation sequencing technology have made the sequencing of RNA (i.e., RNA-Seq) an extemely popular approach for gene expression analysis. Identification of significant differential expression represents a crucial initial step in these analyses, on which most subsequent inferences of biological functions are built. Yet, for identification of these subsequently analysed genes, most studies use an additional minimal threshold of differential expression that is not captured by the applied statistical procedures.

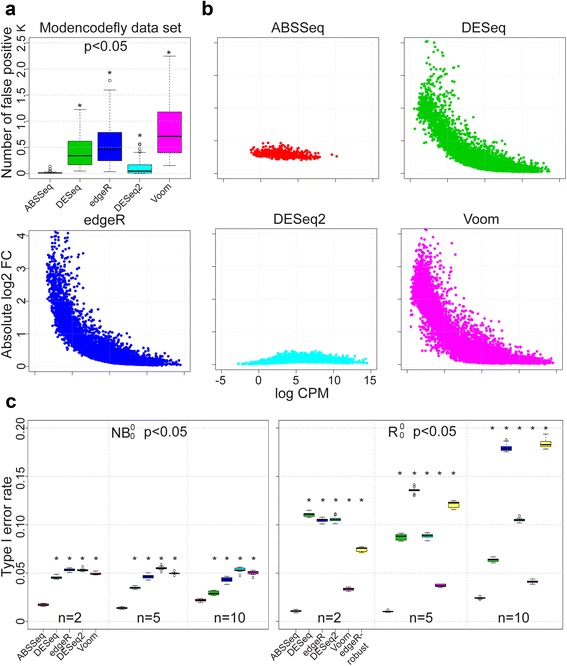
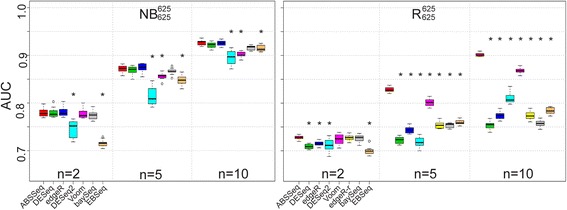
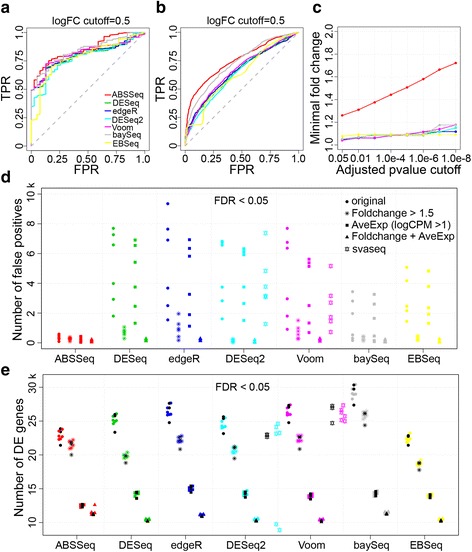
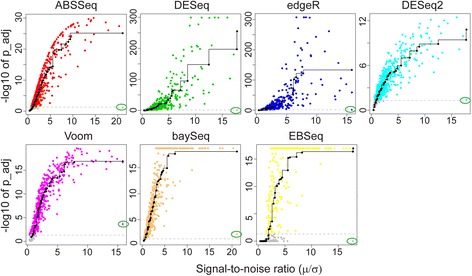
Results: Here we introduce a new analysis approach, ABSSeq, which uses a negative binomal distribution to model absolute expression differences between conditions, taking into account variations across genes and samples as well as magnitude of differences. In comparison to alternative methods, ABSSeq shows higher performance on controling type I error rate and at least a similar ability to correctly identify differentially expressed genes.

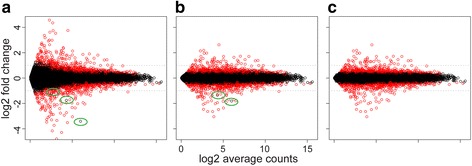
Conclusions: ABSSeq specifically considers the overall magnitude of expression differences, which enhances the power in detecting truly differentially expressed genes by reducing false positives at both very low and high expression level. In addition, ABSSeq offers to calculate shrinkage of fold change to facilitate gene ranking and effective outlier detection.

Keywords: ABSSeq; Differential gene expression; Negative binomial distribution; RNA-Seq; Transcriptome analysis.


Figures

Fig. 1
Fig. 1
Method-dependent variation in type I error. Type I error rates for ABSSeq and five alternative methods using the modencodefly real data set (a) and two simulation settings: Negative Binomial (NB, c left panel), and NB with random outliers (R, c right panel). b Points show the absolute log fold change (FC, y-axis) distribution of false positives against the expression level (logCPM, x-axis). c Each boxplot summarizes the type I error rates across 10 independent simulated data sets. Asterisk indicates a statistically significant difference in type I error between ABSSeq and any of the other methods. n indicates the number of RNA replicates considered in each case (ranging from 2 to 10). Under all conditions, ABSSeq reduced the type I error rate
Fig. 2
Fig. 2
AUC comparison on simulated data. Area under the curve (AUC) for ABSSeq and five alternative methods under two simulation settings: Negative Binomial (NB, left panel) and NB with random outliers (R, right panel). Each boxplot summarizes the AUCs across 10 independently simulated data sets. Asterisk indicates a statistically significant difference in AUC between ABSSeq and any of the other methods. n indicates the number of considered RNA-Seq replicates, from 2 to 10. Under all conditions, ABSSeq is highly effective in correctly identifying differentially expressed genes
Fig. 3
Fig. 3
Comparison of methods using validated real data sets. a-c based on data from the MAQC study; d-e based on the ABRF data set. ROC analysis for (a) TaqMan and (b) PrimePCR data sets at a qRT-PCR absolute log-ratio (logFC) threshold of 0.5. TPR, true positive rate; FPR, false positive rate. ABSSeq performs better than other methods in detecting true differential expression. A gene was considered to be not differentially regulated if its logFC was less than 0.2. c Minimal fold changes under various ajusted p-value cutoffs for the MAQC II data set. d Number of false postives in comparisons of samples from same condition but different lab sites and (e) number of DE genes in comparison of samples from two conditons under additional filtering and confounding factor assessment approaches. Symbols in black show results from comparison of conditions from same laboratory and colored symbols those from comparison of conditions across laboratories. Genes are counted under 5 situations: orginal, without filtering (circle symbols); Foldchange, with a value greater than 1.5 (star symbols); AveExp, with average logCPM greater than 1 (square symbols); combination of Foldchange and AveExp (triangle symbols); and svaseq tested only for DESeq2 and Voom (pentacle symbols)
Fig. 4
Fig. 4
Correlation between signal-to-noise ratio and p-value with true DE present in only one condition. Evaluation is based on a total of 1514 genes that are exclusively expressed in one condition in the MAQC-II data set. Gray points indicate genes with adjusted p-value value ≥ 0.05. The data point highlighted by the green elipse refers to the gene with high signal-to-noise ratio but low expression. The correlation is inferred using isotonic regression (black line)
Fig. 5
Fig. 5
Moderation of log2 fold change. a Raw data (without shrinkage) of the Bottomfly study. b The same data corrected by expression level. c The same data corrected by expression level and gene-specific dispersion. DE genes (adjusted pvalue <0.05) are shown in red. Non-DE genes with high log2 fold change are marked by green elipses

Similar articles

Cited by

References

    1. Anders S, Huber W. Differential expression analysis for sequence count data. Genome Biol. 2010;11(10):R106. doi: 10.1186/gb-2010-11-10-r106. - DOI - PMC - PubMed
    1. Hardcastle TJ, Kelly KA. baySeq: empirical Bayesian methods for identifying differential expression in sequence count data. BMC Bioinformatics. 2010;11(1):422. doi: 10.1186/1471-2105-11-422. - DOI - PMC - PubMed
    1. Robinson MD, McCarthy DJ, Smyth GK. edgeR: a Bioconductor package for differential expression analysis of digital gene expression data. Bioinformatics. 2010;26(1):139–140. doi: 10.1093/bioinformatics/btp616. - DOI - PMC - PubMed
    1. Li J, Witten DM, Johnstone IM, Tibshirani R. Normalization, testing, and false discovery rate estimation for RNA-sequencing data. Biostatistics. 2012;13(3):523–538. doi: 10.1093/biostatistics/kxr031. - DOI - PMC - PubMed
    1. Srivastava S, Chen L. A two-parameter generalized Poisson model to improve the analysis of RNA-seq data. Nucleic Acids Res. 2010;38(17):e170. doi: 10.1093/nar/gkq670. - DOI - PMC - PubMed

Publication types