. 2016 Dec 1;44(21):10091-10105.
doi: 10.1093/nar/gkw684. Epub 2016 Aug 3.

Dissecting relative contributions of cis- and trans-determinants to nucleosome distribution by comparing Tetrahymena macronuclear and micronuclear chromatin

Affiliations

Dissecting relative contributions of cis- and trans-determinants to nucleosome distribution by comparing Tetrahymena macronuclear and micronuclear chromatin

Jie Xiong et al. Nucleic Acids Res. .

Abstract

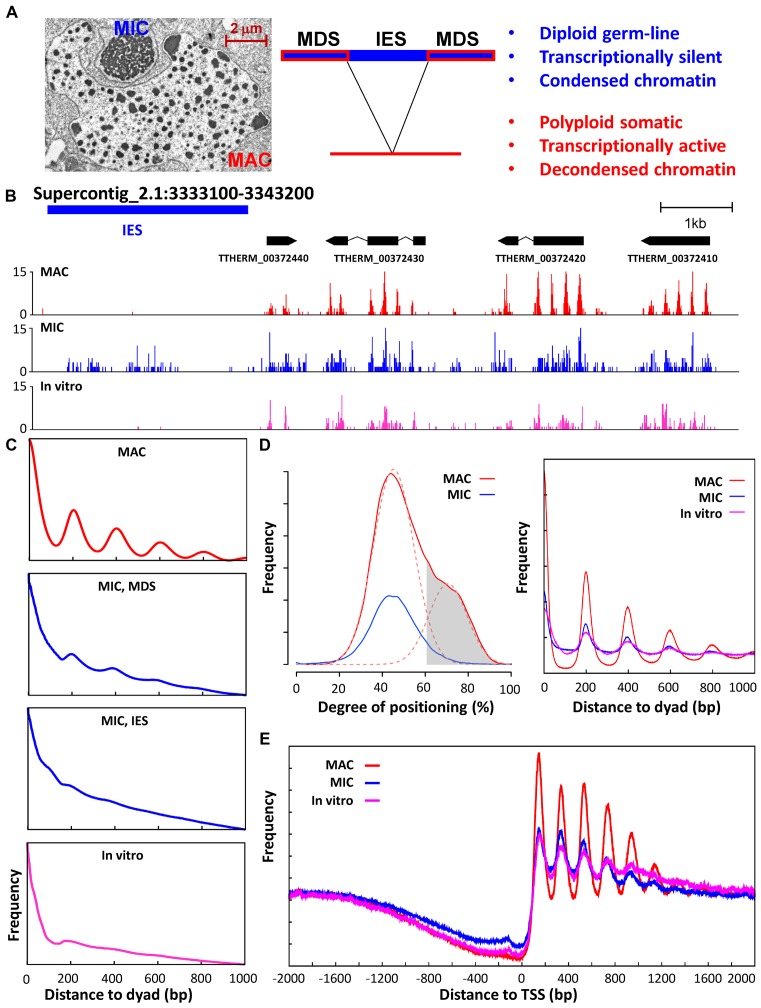
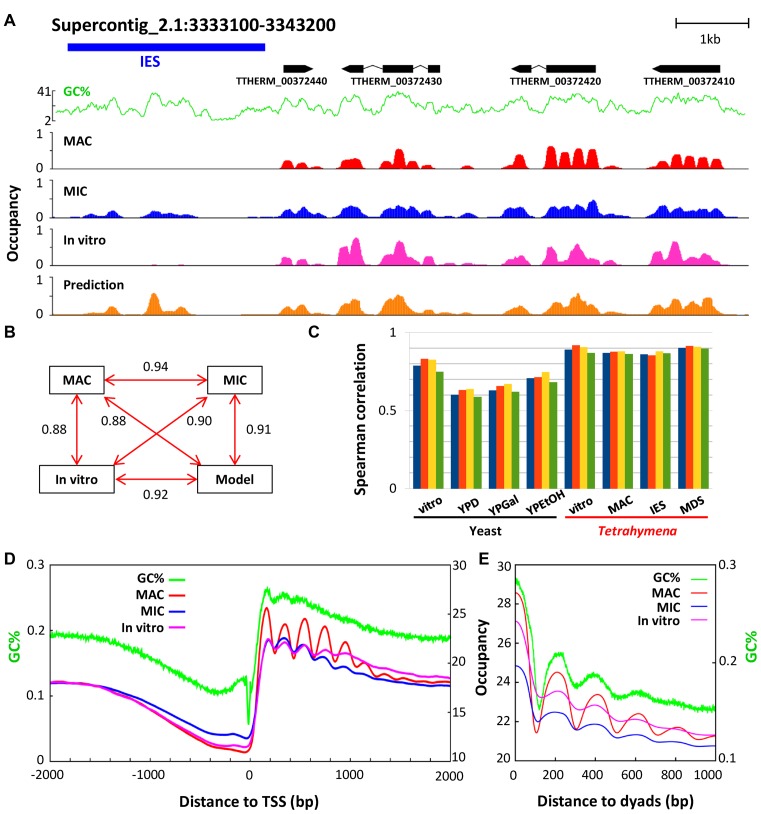
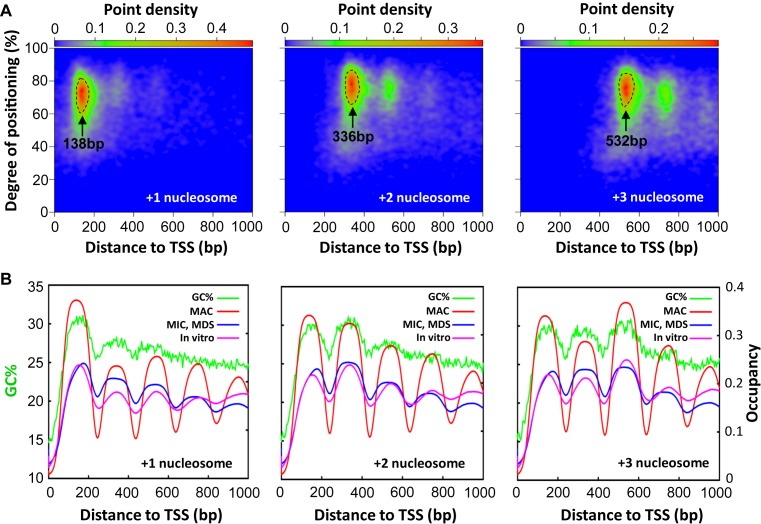
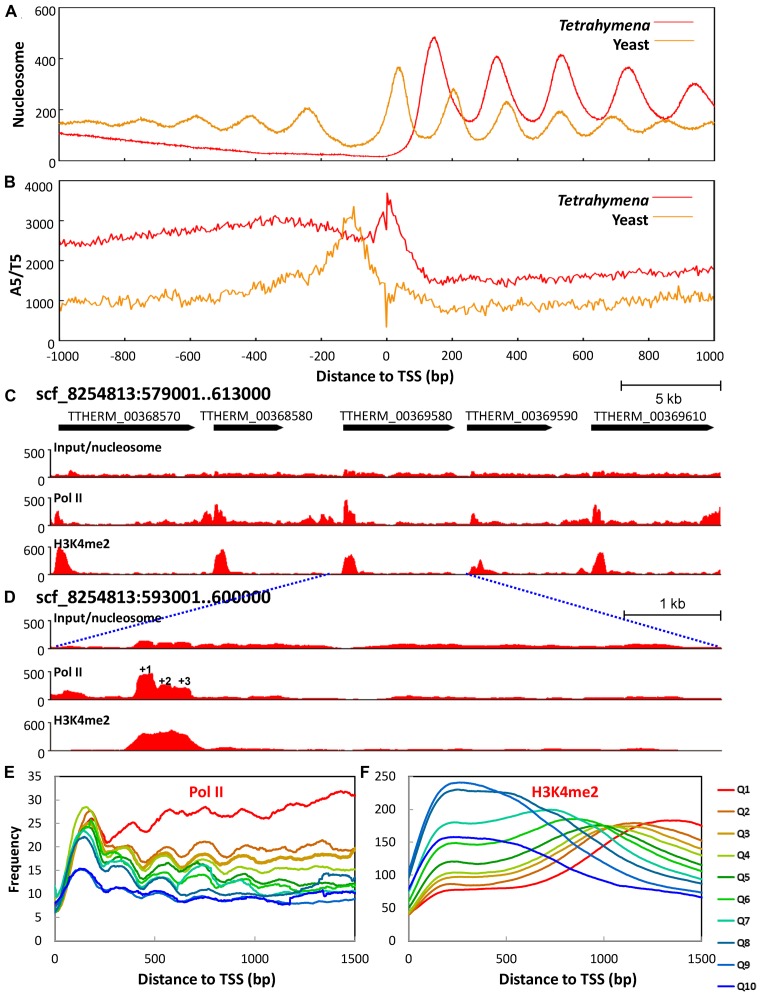
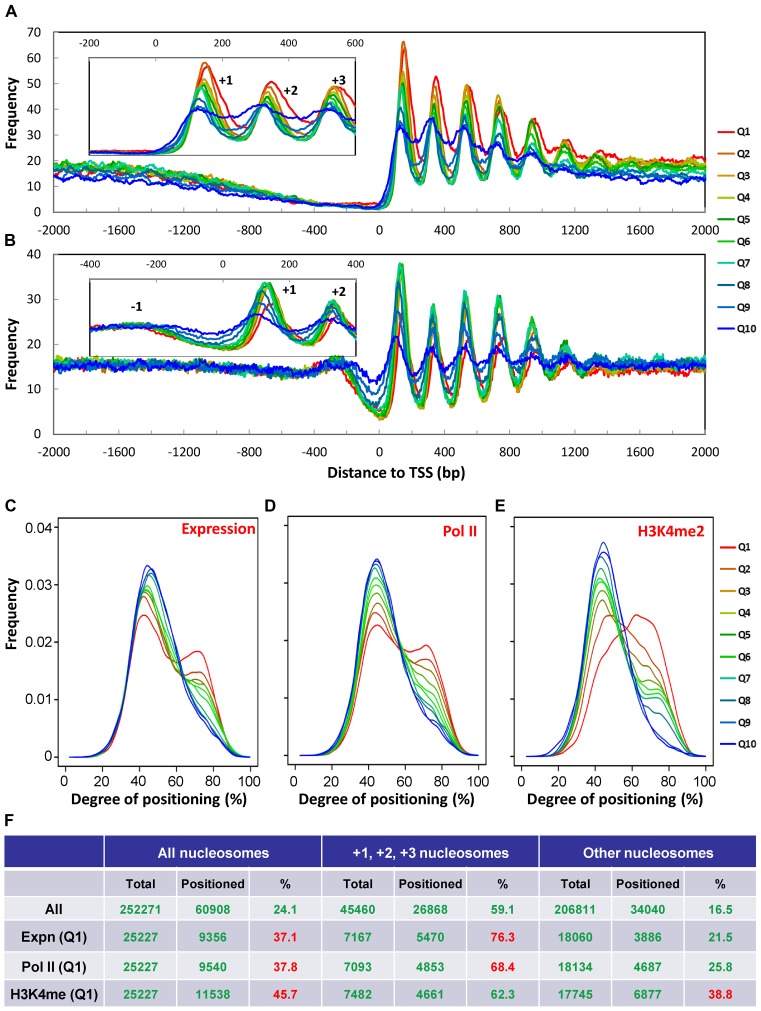
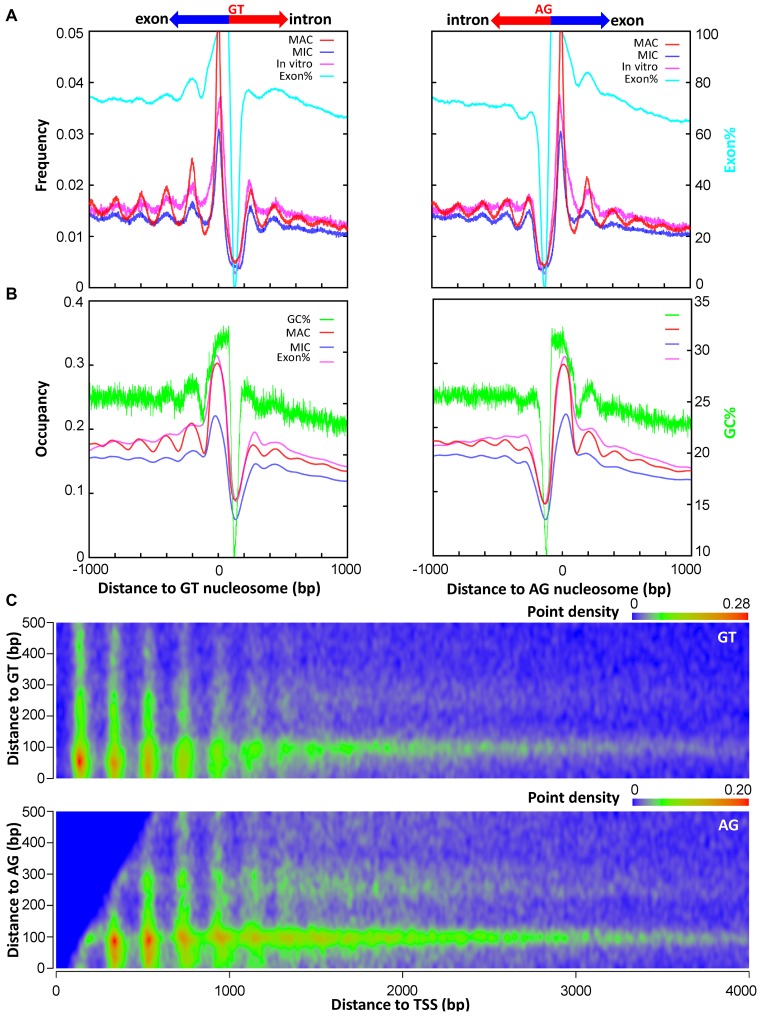
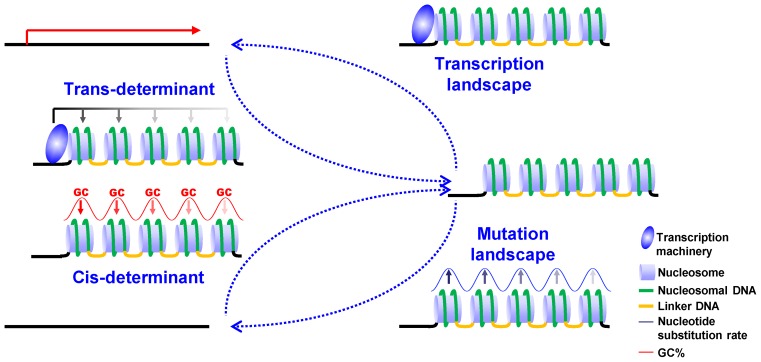
The ciliate protozoan Tetrahymena thermophila contains two types of structurally and functionally differentiated nuclei: the transcriptionally active somatic macronucleus (MAC) and the transcriptionally silent germ-line micronucleus (MIC). Here, we demonstrate that MAC features well-positioned nucleosomes downstream of transcription start sites and flanking splice sites. Transcription-associated trans-determinants promote nucleosome positioning in MAC. By contrast, nucleosomes in MIC are dramatically delocalized. Nucleosome occupancy in MAC and MIC are nonetheless highly correlated with each other, as well as with in vitro reconstitution and predictions based upon DNA sequence features, revealing unexpectedly strong contributions from cis-determinants. In particular, well-positioned nucleosomes are often matched with GC content oscillations. As many nucleosomes are coordinately accommodated by both cis- and trans-determinants, we propose that their distribution is shaped by the impact of these nucleosomes on the mutational and transcriptional landscape, and driven by evolutionary selection.


Figures

Figure 1.
Figure 1.
Positioned nucleosomes are abundant in transcriptionally active MAC, but depleted in transcriptionally silent MIC. (A) Two types of structurally and functionally differentiated nuclei in Tetrahymena. Left, an electron micrograph showing the structurally differentiated macronucleus (MAC) and micronucleus (MIC), enclosed by their own nuclear envelope and contained in the same cytoplasmic compartment. Middle, DNA elimination accompanying MIC to MAC differentiation: IES, internal eliminated sequences, MIC-specific; MDS, MAC-destined sequences, shared between MAC and MIC. Right, functional differentiation of MAC and MIC. (B) Nucleosome distribution in a representative genome region. Paired-end MNase-Seq results from MAC (red), MIC (blue), and in vitro (magenta) (25) are mapped to the MIC genome. Distribution of fragment centers representing nucleosome dyads is plotted, together with models for genes and IES. (C) Phasogram of nucleosome distribution in MAC (red), MIC (blue), and in vitro (magenta) (25). x-axis: distance to fragment center (dyad); y-axis, frequency at a designated distance. MIC result is mapped to MDS and IES separately; MAC and in vitro results are mapped to MDS. (D) Nucleosome positioning and long-range order. Left, Nucleosome positioning in MAC and MIC. The distribution of degrees of nucleosome positioning in MAC (red solid line) can be decomposed into two peaks of normal distribution (red dashed line), with the left peak representing more delocalized nucleosomes and the right peak representing well-positioned nucleosomes. Well-positioned nucleosomes in MAC (gray area, 61% cutoff) are selected for further analysis. They have significantly reduced degrees of translational positioning in MIC (blue), similar to the more delocalized nucleosomes in MAC (red dashed line, left peak). See Methods for details and Supplemental File S1 for a compilation of properties of called nucleosomes. Right, composite analysis of nucleosome positioning in MAC (red), MIC (blue), and in vitro (magenta) (25), aligned to the dyads of well-positioned nucleosomes in MAC. (E) Composite analysis of nucleosome positioning in MAC (red), MIC (blue), and in vitro (magenta) (25), aligned to TSS. Distribution of fragment centers around TSS (±2kb) is aggregated over 15,841 well-modeled genes. See Methods for details and Supplemental File S2 for a compilation of properties of well-modeled genes.
Figure 2.
Figure 2.
Nucleosome occupancy is affected by cis-determinants. (A) Nucleosome occupancy in a representative genomic region (as in Figure 1B), based upon MNase-Seq of MAC (red), MIC (blue) and in vitro (magenta) (25), as well as computational modeling (beige) (10). GC% distribution (green) is superimposed. (B) Pair-wise Spearman's rank correlation coefficients between nucleosome occupancy levels of MAC, MIC (MDS), in vitro (25), and computational modeling (10). (C) Comparison of nucleosome occupancy predicted from different models and data from yeast and Tetrahymena, representing Spearman's rank correlations between the experimental occupancy data and the GC% model (blue), the Segal model (red) (10), the 14-feature model (yellow) (15), the rotational positioning model (green). Four yeast data sets and four Tetrahymena data sets are analyzed. See Methods for details. (D) Nucleosome occupancy in MAC (red), MIC (blue), and in vitro (magenta) (25), aligned to TSS. Nucleosome occupancy around TSS (±2 kb) is aggregated over 15,841 well-modeled genes. GC% distribution (green) is superimposed. (E) In phase oscillations of nucleosome occupancy and GC%. Nucleosome occupancy in MAC (red), MIC (blue) and in vitro (magenta) (25), is aligned to the dyads of the selected well-positioned nucleosomes (as in Figure 1D). GC% distribution (green) is superimposed.
Figure 3.
Figure 3.
Well-positioned nucleosomes in the gene body are coordinated by cis-determinants. (A) Distribution of called nucleosomes in the gene body, according to their distances from TSS (x-axes) and degrees of translational positioning (y-axes). Note the clustering of nucleosome distributions (point density in color scales). These strongly clustered +1, +2 and +3 nucleosomes, their peak positions relative to TSS as indicated, are selected for further analysis (enclosed by dashed lines). See Methods for details and Supplemental File S1 for a compilation of properties of called nucleosomes. (B) In phase oscillations of nucleosome occupancy and GC% downstream of TSS. Nucleosome occupancy in MAC (red), MIC (blue), and in vitro (magenta) (25) is aggregated over the genes containing the selected +1, +2 and +3 nucleosomes enclosed by dashed lines in the top panels. GC% distribution (green) is superimposed.
Figure 4.
Figure 4.
The +1 nucleosome is implicated in Pol II pausing. (A) The +1 nucleosome placement is further downstream of TSS in Tetrahymena than in yeast. Nucleosome distribution around TSS (± 1 kb) is aggregated over 15,841 well-annotated genes in Tetrahymena (Supplemental File S2) and 2231 genes in yeast (71). Note the downstream placement of the +1 nucleosome (yeast: 56 bp; Tetrahymena: 138 bp), increase in NRL (yeast: 167 bp; Tetrahymena: 200 bp), and a lack of nucleosome arrays upstream of TSS, when Tetrahymena is compared with yeast. (B) Poly (dA:dT) tract distribution relative to TSS in Tetrahymena (red) and yeast (beige). A5/T5 (AAAAA or TTTTT) distribution around TSS (± 1kb) is calculated using the 5 bp bin. C) Distribution of nucleosome, Pol II, and H3K4 methylation (from top to bottom) in a genomic region. Raw coverage of the input (nucleosome) and ChIP-Seq DNA fragments (Pol II and H3K4 methylation) was shown. Note the enrichment of Pol II and H3K4 methylation at the 5′ end of the gene body. (D) Zoom-in of a region containing a single gene. Note Pol II enrichment at the +1 nucleosome. (E) Composite analysis of Pol II distribution in the gene body. Well-modeled long genes (≥1.5 kb) are ranked from high to low by their expression levels and divided into 10 quantiles. Normalized Pol II distribution around TSS is aggregated over all genes in a quantile. (F) Composite analysis of H3K4 methylation in the gene body.
Figure 5.
Figure 5.
Transcription-associated trans-determinants promote nucleosome positioning. (A) Stereotypical nucleosome arrays with heavy MNase digestion. 15,841 well-modeled genes are ranked from high to low by their expression levels and divided into 10 quantiles. Nucleosome distribution around TSS is aggregated over all genes in a quantile. Inset: zoom in on the +1, +2 and +3 nucleosomes. (B) Stereotypical nucleosome arrays with light MNase digestion. (C) Nucleosome positioning with different levels of gene expression. Called nucleosomes in the gene body are ranked from high to low by the expression levels of their associated genes, and divided into 10 quantiles. Normalized distributions of degrees of nucleosome positioning are plotted for all 10 quantiles separately. (D) Nucleosome positioning with different levels of Pol II association. (E) Nucleosome positioning with different levels of H3K4 methylation. (F) Relationship between transcription-associated trans-determinants and well-positioned nucleosomes.
Figure 6.
Figure 6.
Splice sites are flanked by positioned nucleosomes. (A) Composite analysis of nucleosome positioning in MAC (red), MIC (blue), and in vitro (magenta) (25), aligned to the dyads of the called nucleosomes flanking splice sites (left: GT, right: AG). The distribution of exon% (pale blue), calculated as the probability that a particular position containing exons, is superimposed. See Methods for details. (B) Composite analysis of nucleosome occupancy in MAC (red), MIC (blue), and in vitro (magenta) (25), aligned to the dyads of the called nucleosomes flanking splice sites (left: GT, right: AG). The distribution of GC% (green) is superimposed. Note the correlation between nucleosome arrays near splice sites and oscillations of GC%. (C) Distribution of called nucleosomes in the gene body, according to their distances from TSS (x-axes) and splice sites (y-axes; top: GT; bottom: AG). Note the clustering of nucleosome distribution along both the x- and y-axes (point density in color scales). See Supplemental File S1 for a compilation of properties of called nucleosomes.
Figure 7.
Figure 7.
Coordinate accommodation of well-positioned nucleosomes in the gene body by cis- and trans-determinants. A positive feedback loop allows optimization of cis-determinants, and their coordination with trans-determinants to accommodate well-positioned nucleosomes in the gene body. See Discussion for details.

References

    1. Kornberg R.D., Lorch Y. Twenty-five years of the nucleosome, fundamental particle of the eukaryote chromosome. Cell. 1999;98:285–294. - PubMed
    1. Hughes A.L., Rando O.J. Mechanisms underlying nucleosome positioning in vivo. Annu. Rev. Biophysi. 2014;43:41–63. - PubMed
    1. Mavrich T.N., Jiang C., Ioshikhes I.P., Li X., Venters B.J., Zanton S.J., Tomsho L.P., Qi J., Glaser R.L., Schuster S.C., et al. Nucleosome organization in the Drosophila genome. Nature. 2008;453:358–362. - PMC - PubMed
    1. Albert I., Mavrich T.N., Tomsho L.P., Qi J., Zanton S.J., Schuster S.C., Pugh B.F. Translational and rotational settings of H2A.Z nucleosomes across the Saccharomyces cerevisiae genome. Nature. 2007;446:572–576. - PubMed
    1. Zhang Z., Pugh B.F. High-resolution genome-wide mapping of the primary structure of chromatin. Cell. 2011;144:175–186. - PMC - PubMed

MeSH terms