Controlled Clinical Trial
. 2016 Sep;104(3):557-65.
doi: 10.3945/ajcn.116.132563. Epub 2016 Aug 3.

Biomarkers of browning of white adipose tissue and their regulation during exercise- and diet-induced weight loss

Affiliations
Controlled Clinical Trial

Biomarkers of browning of white adipose tissue and their regulation during exercise- and diet-induced weight loss

Asif Nakhuda et al. Am J Clin Nutr. 2016 Sep.

Abstract

Background: A hypothesis exists whereby an exercise- or dietary-induced negative energy balance reduces human subcutaneous white adipose tissue (scWAT) mass through the formation of brown-like adipocyte (brite) cells. However, the validity of biomarkers of brite formation has not been robustly evaluated in humans, and clinical data that link brite formation and weight loss are sparse.

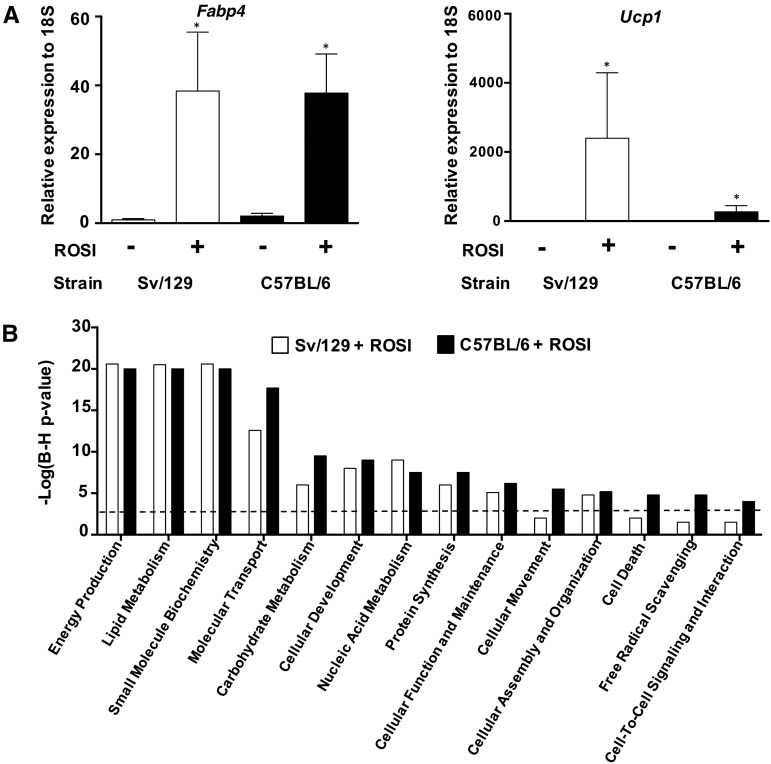
Objectives: We used rosiglitazone and primary adipocytes to stringently evaluate a set of biomarkers for brite formation and determined whether the expression of biomarker genes in scWAT could explain the change in body composition in response to exercise training combined with calorie restriction in obese and overweight women (n = 79).

Design: Gene expression was derived from exon DNA microarrays and preadipocytes from obesity-resistant and -sensitive mice treated with rosiglitazone to generate candidate brite biomarkers from a microarray. These biomarkers were evaluated against data derived from scWAT RNA from obese and overweight women before and after supervised exercise 5 d/wk for 16 wk combined with modest calorie restriction (∼0.84 MJ/d).

Results: Forty percent of commonly used brite gene biomarkers exhibited an exon or strain-specific regulation. No biomarkers were positively related to weight loss in human scWAT. Greater weight loss was significantly associated with less uncoupling protein 1 expression (P = 0.006, R(2) = 0.09). In a follow-up global analysis, there were 161 genes that covaried with weight loss that were linked to greater CCAAT/enhancer binding protein α activity (z = 2.0, P = 6.6 × 10(-7)), liver X receptor α/β agonism (z = 2.1, P = 2.8 × 10(-7)), and inhibition of leptin-like signaling (z = -2.6, P = 3.9 × 10(-5)).

Conclusion: We identify a subset of robust RNA biomarkers for brite formation and show that calorie-restriction-mediated weight loss in women dynamically remodels scWAT to take on a more-white rather than a more-brown adipocyte phenotype.

Keywords: browning; exercise; microarray; obesity; weight loss; white adipose tissue.


Figures

FIGURE 1
FIGURE 1
Characterization of the biology of the ROSI response between Sv/129 and C57BL/6 mice. (A) Mean ± SD RT-qPCR–derived expression changes of adipogenesis marker Fabp4 and thermogenesis marker Ucp1; both genes were measured in inguinal white adipocytes originating from either Sv/129 or C57BL/6 mice, which were treated with or without ROSI and resulted in the following 4 groups: Sv/129 + ROSI, Sv/129 – ROSI, C57BL/6 + ROSI, and C57BL/6 – ROSI. The response from both strains confirmed the induction of browning and the maturation of adipocytes. Each group is composed of n = 4. *Significance between control and ROSI groups, P < 0.05. (B) Significance analysis of microarray was performed on Affymetrix Mouse Exon ST 1.0 (Affymetrix) with the use of RNA independent from the RT-qPCR experiment (Sv/129 + ROSI: n = 4; Sv/129 – ROSI: n = 4; C57BL/7 + ROSI: n = 4; and Sv/129 – ROSI: n = 5) and identified differentially expressed genes during brite formation in both strains. The gene lists from both strains were enriched in very similar pathways that were expectedly associated with metabolism (and thus, the majority of the analysis henceforth relied on the combination of both strains). The black dotted line represents the threshold for significance (B-H–corrected P = 1 × 10⁻³). B-H, Benjamini-Hochberg–corrected; Fabp4, fatty acid binding protein 4; ROSI, rosiglitazone; RT-qPCR, reverse transcriptase–quantitative polymerase chain reaction; Ucp1, uncoupling protein 1.
FIGURE 2
FIGURE 2
Establishment of reliable brite markers. The Affymetrix Exon ST 1.0 (Affymetrix) arrays that were used for pathway enrichment (Figure 1B) also provided exon-level changes that occurred with ROSI in detectable genes and were used to extract specific expression values corresponding to primers used in de Jong et al. (15) to calculate the mean ± SD percentage of change in expression in response to ROSI (n = 9) from the control (n = 8). All phenotypic adipocyte markers except for Cidea [which is not a valid adipocyte subtype marker in humans (9)] were measured. Only phenotypic adipocyte markers that reached significance are shown, whereas remaining phenotypic adipocyte-marker data are shown in Supplemental Figure 1A. $Expression changes from de Jong et al. (15) are shown and were estimated from the original publication that used NMRI mice (15), which indicated that not all brite markers share the same directionality across studies. Student’s unpaired t test was performed with the use of linear expression intensities. *,**,***Significance: *P < 0.05, **P < 0.01, ***P < 0.001. Car4, carbonic anhydrase 4; Eva1; epithelial V-like antigen 1; Fbxo31, F-box protein 31; Fgf21, fibroblast growth factor 21; Hoxc8, Homeobox C8; Hoxc9, Homeobox C9; Lhx8, LIM homeobox protein 8; NMRI, Naval Medical Research Institute; Pat2, proton/amino acid transporter 2; Prdm16, PR domain 16; P2rx5, purinergic receptor P2X 5; Ucp1, uncoupling protein 1; Zic1, zinc finger protein of the cerebellum 1.
FIGURE 3
FIGURE 3
Effects of 16 wk of exercise and dieting on body composition. Subjects from Josse et al. (18, 19) were all premenopausal and overweight or obese women, and an overview of clinical characteristics is shown in Supplemental Table 2. Body-composition data (measured with the use of dual-energy X-ray absorptiometry) from each subject (with complete biopsies and body-composition data) were compared before and after the intervention and led to significant fat mass loss (A) and total body weight loss (B). Data are shown for all subjects (n = 79). Each dot and its respective connected dot represent data from a single subject. Student’s paired t test was performed; ****P < 0.0001.
FIGURE 4
FIGURE 4
Evaluation of reliable brite markers and ROSI-regulated genes in white adipose tissue in response to exercise and dieting. HumanHT-12 V4.0 Expression BeadChip (Illumina) were used to measure gene-expression changes in 79 individuals before and after a 16-wk intervention. The data set was used to extract mean ± SD linear expression intensities corresponding to brite markers (A) that were consistent across Sv/129, C57BL/6, and NMRI mice, but no changes were shown. Note that CA4 is the human ortholog of Car4. ROSI-regulated genes were measured in human subcutaneous white adipose tissue, but neither the most-upregulated ROSI genes (B) nor the most-downregulated ROSI genes (C) changed with intervention. Note that not all ROSI-responsive genes identified in mice had one-to-one orthologs, and certain Illumina probes hit multiple genomic regions, and thus, genes that fall into either of these categories were not included. n = 79 paired samples. Student’s paired t test was performed with the use of linear expression intensity (AU), but no significance was shown. B3GALT2, beta-1,3-galactosyltransferase 2; CA4, carbonic anhydrase 4; CIDEC, cell death inducing DFFA like effector c; ELOVL3, fatty acid elongase 3; EVA1, epithelial V-like antigen 1; FABP3, fatty acid binding protein 3; FGF21, fibroblast growth factor 21; GABRE, gamma-amiobutyric acid type A epsilon subunit; GYS2, glycogen synthase 2; HPSE, heparanase; HSD11B1, hydroxysteroid 11-beta dehydrogenase 1; IL6, interleukin 6; IL1RL1, interleukin 1 receptor like 1; LHX8, LIM homeobox 8; NAT8L, N-acetyltransferase 8 like; NMRI, naval medical research institute; PAT2, proton/amino acid transporter 2; PRDM16, PR domain containing 16; P2RX5, purinergic receptor P2X 5; ROSI, rosiglitazone; SERPINB2, serpin family B member 2; SLC16A3, solute carrier family 16 member 3; SPTLC3, serine palmitoyltransferase, long chain base subunit 3; UCP1, uncoupling protein 1.
FIGURE 5
FIGURE 5
Relation between brite markers or rosiglitazone-responsive genes with combined exercise- and diet-induced weight loss. Of the 22 genes that were assessed (Figure 4) only UCP1 (P = 0.006, R2 = 0.09) (A) and NAT8L (P = 0.003, R2 = 0.11) (B), a brite marker and a rosiglitazone up-regulated gene, respectively, showed a significant correlation between weight loss and a gene-expression change. In addition, both of these correlations went in the opposite direction because they both decreased with weight loss, which was the opposite effect if brite formation occurred. Another popular gene that is associated with brite formation is FGF21 (P = 0.89, R2 = 0.0002) (C), but it showed no link with weight loss, whereas TNFRS21 (P < 0.0001, R2 = 0.23) (D), which was identified with the use of quantitative significance analysis of microarray along with 180 other genes, showed a much-stronger correlation, implying that molecular changes are occurring with weight loss and are not linked to brite formation, at least in human subcutaneous white adipose tissue. A Pearson correlation was carried out between the change in linear expression intensity (AU) and the percentage of change in weight loss from paired samples with the use of subjects considered in the creation of Figure 4 (n = 79), and significance was determined at P < 0.05. FGF21, fibroblast growth factor 21; NAT8L, N-acetyltransferase 8 like; TNFRSF21, tumor necrosis factor receptor superfamily, member 21; UCP1, uncoupling protein 1.
FIGURE 6
FIGURE 6
Upstream regulatory analysis of weight-loss–associated genes identified strong C/EBPα activation. With the use of 161 genes that were correlated with weight loss, their respective Pearson correlation coefficients were used in an ingenuity pathway analysis: upstream analysis, which identified potential regulators that either are responsible or mimic the effect of exercise- and diet-induced weight loss (Supplemental Table 4). A strong activation of C/EBPα (z score = 2, P = 6.6 × 10⁻⁷) occurred, which led to numerous downstream signalings that ultimately affected adipogenesis. *Significantly regulated by C/EBPα in multiple species. ACACA, acetyl-CoA carboxylase alpha; ACLY, ATP citrate lyase; AGPAT2, 1-acylglycerol-3-phosphate O-acyltransferase 2; AKR1C3, aldo-keto reductase family 1, member C3; APLNR, apelin receptor; CEBPA, CCAAT/enhancer binding protein α C/EBPα, CCAAT/enhancer binding protein α EPHX1, epoxide hydrolase 1; LEP, leptin; NRP1, neuropilin 1; PGD, phosphogluconate; PPL, periplakin; SCD, stearoyl-CoA desaturase; SERPINI1, serpin family I member 1; TUBB2A, tubulin beta 2A class IIa; VCL, vinculin.

Comment in

References

    1. Timmons JA, Wennmalm K, Larsson O, Walden TB, Lassmann T, Petrovic N, Hamilton DL, Gimeno RE, Wahlestedt C, Baar K, et al. . Myogenic gene expression signature establishes that brown and white adipocytes originate from distinct cell lineages. Proc Natl Acad Sci USA 2007;104:4401–6. - PMC - PubMed
    1. Petrovic N, Walden TB, Shabalina IG, Timmons JA, Cannon B, Nedergaard J. Chronic peroxisome proliferator-activated receptor γ (PPARγ) activation of epididymally derived white adipocyte cultures reveals a population of thermogenically competent, UCP1-containing adipocytes molecularly distinct from classic brown adipocytes. J Biol Chem 2010;285:7153–64. - PMC - PubMed
    1. Seale P, Bjork B, Yang W, Kajimura S, Chin S, Kuang S, Scime A, Devarakonda S, Conroe HM, Erdjument-Bromage H, et al. . PRDM16 controls a brown fat/skeletal muscle switch. Nature 2008;454:961–7. - PMC - PubMed
    1. Moulin K, Truel N, André M, Arnauld E, Nibbelink M, Cousin B, Dani C, Pénicaud L, Casteilla L. Emergence during development of the white-adipocyte cell phenotype is independent of the brown-adipocyte cell phenotype. Biochem J 2001;356:659–64. - PMC - PubMed
    1. Digby JE, Montague CT, Sewter CP, Sanders L, Wilkison WO, O’Rahilly S, Prins JB. Thiazolidinedione exposure increases the expression of uncoupling protein 1 in cultured human preadipocytes. Diabetes 1998;47:138–41. - PubMed

Publication types

MeSH terms