. 2016 Aug 3;11(1):59.
doi: 10.1186/s13024-016-0124-1.

Predominant expression of Alzheimer's disease-associated BIN1 in mature oligodendrocytes and localization to white matter tracts

Affiliations

Predominant expression of Alzheimer's disease-associated BIN1 in mature oligodendrocytes and localization to white matter tracts

Pierre De Rossi et al. Mol Neurodegener. .

Erratum in

Abstract

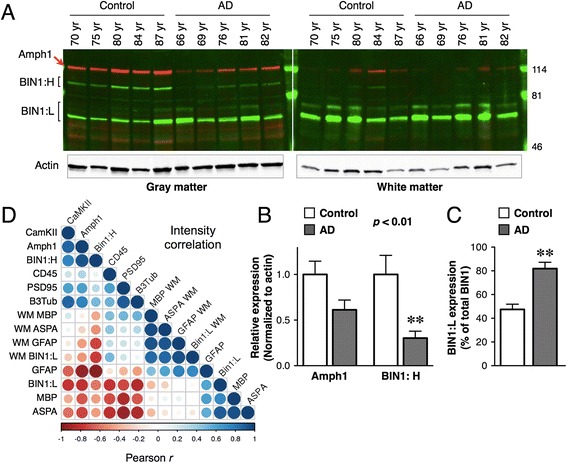
Background: Genome-wide association studies have identified BIN1 within the second most significant susceptibility locus in late-onset Alzheimer's disease (AD). BIN1 undergoes complex alternative splicing to generate multiple isoforms with diverse functions in multiple cellular processes including endocytosis and membrane remodeling. An increase in BIN1 expression in AD and an interaction between BIN1 and Tau have been reported. However, disparate descriptions of BIN1 expression and localization in the brain previously reported in the literature and the lack of clarity on brain BIN1 isoforms present formidable challenges to our understanding of how genetic variants in BIN1 increase the risk for AD.

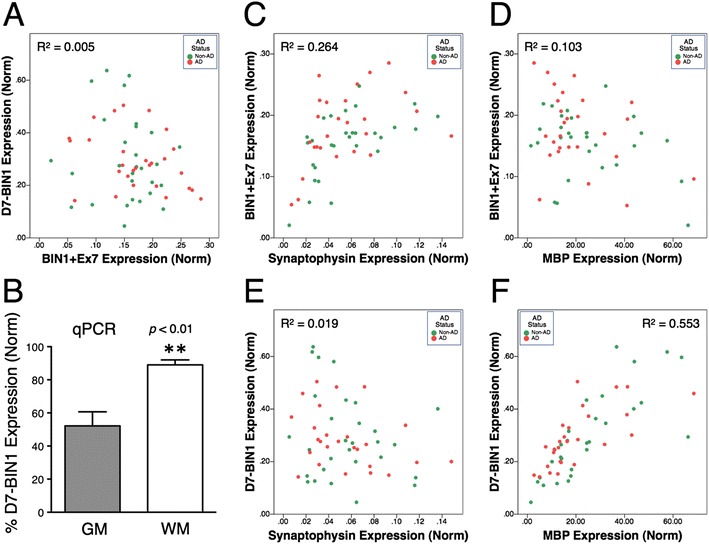
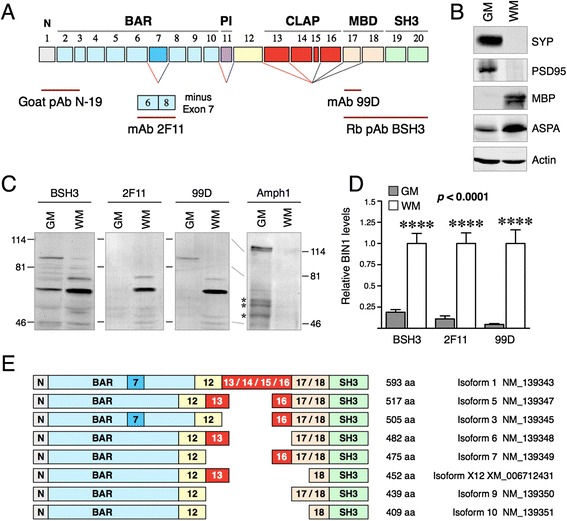
Methods: In this study, we analyzed BIN1 mRNA and protein levels in human brain samples from individuals with or without AD. In addition, we characterized the BIN1 expression and isoform diversity in human and rodent tissue by immunohistochemistry and immunoblotting using a panel of BIN1 antibodies.

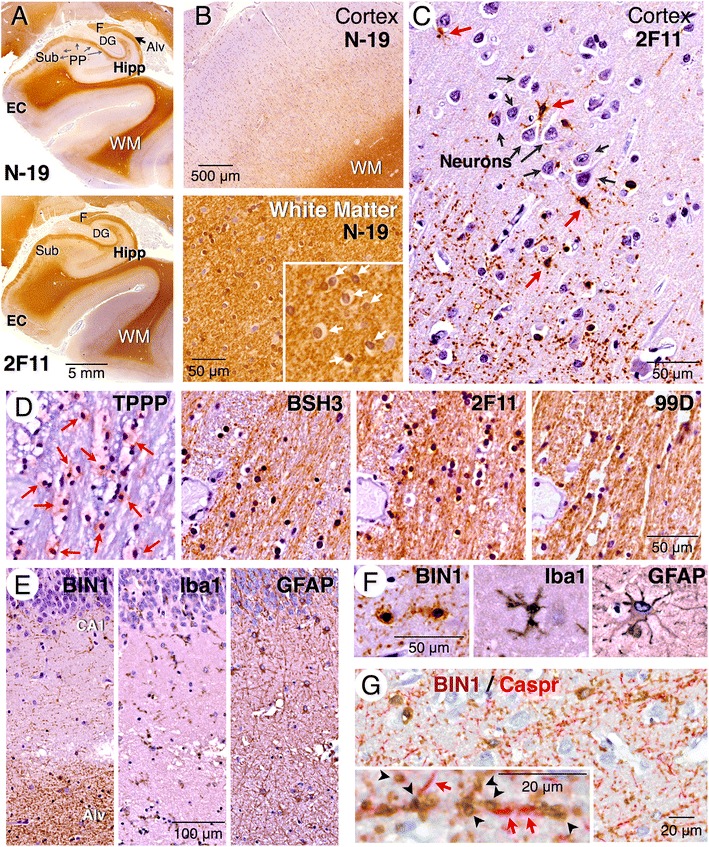
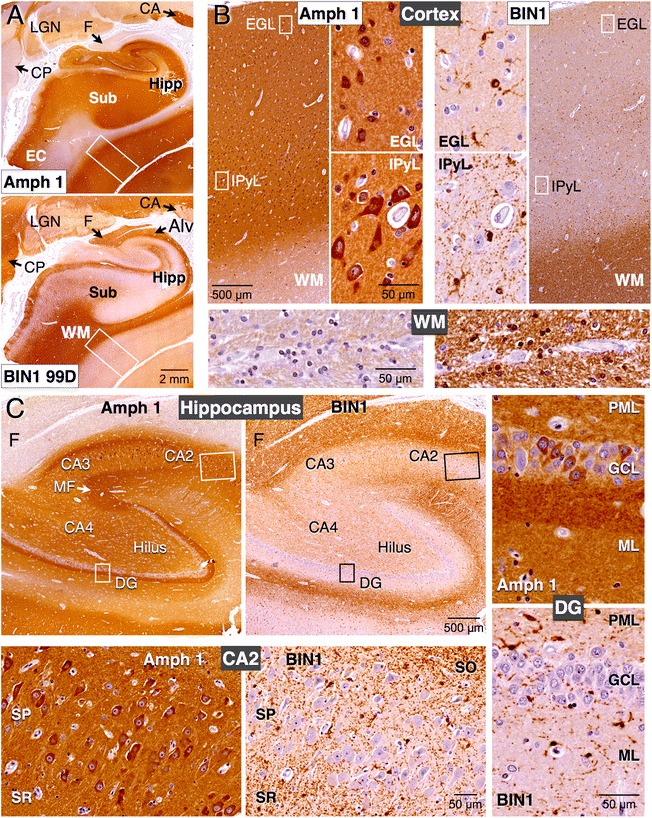
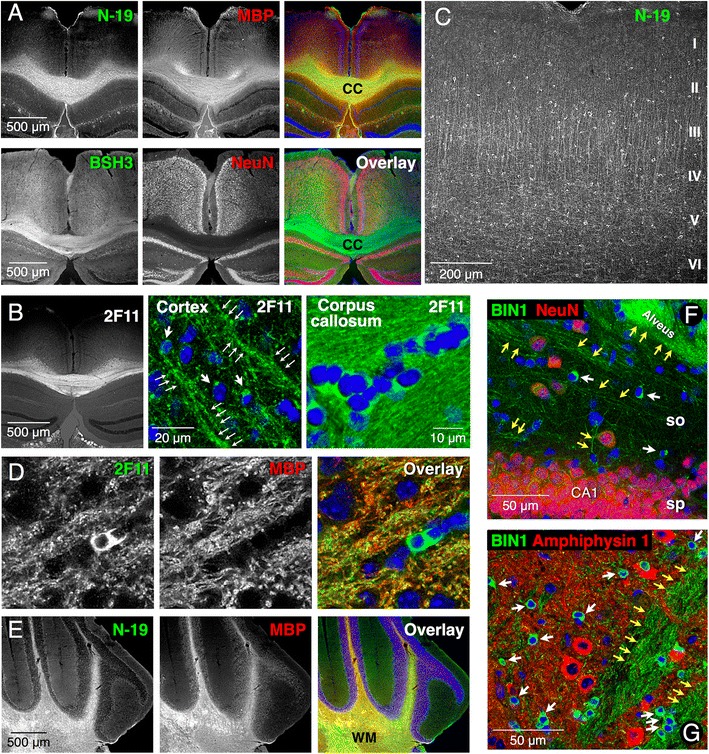
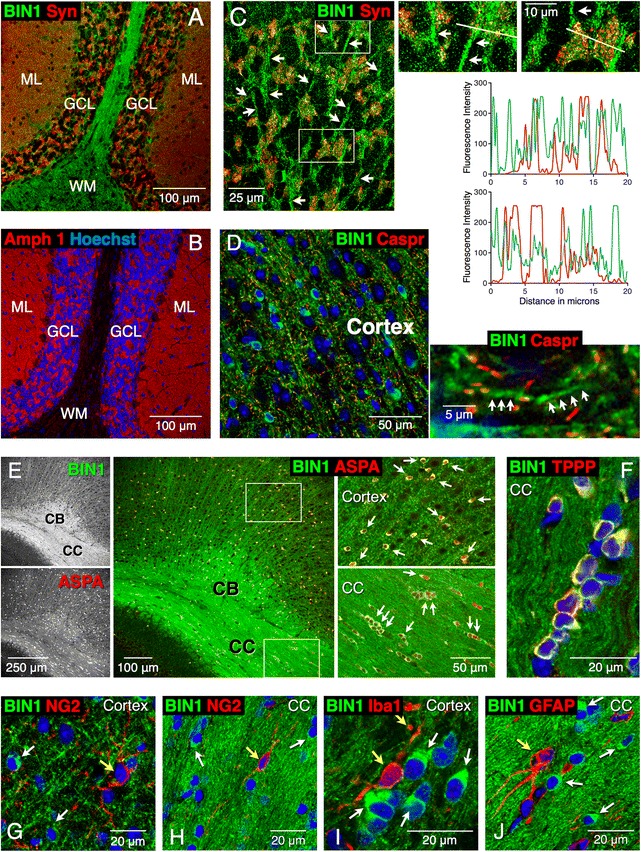
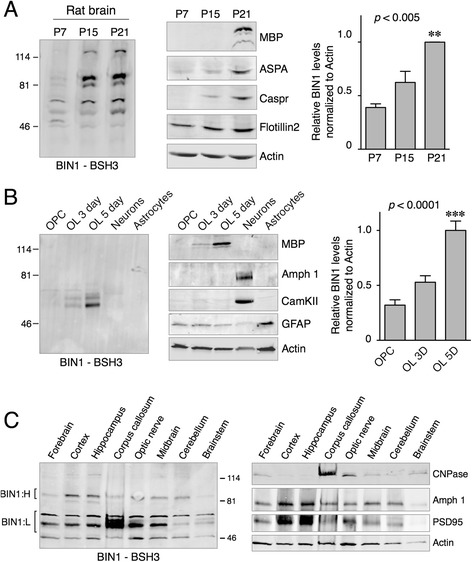
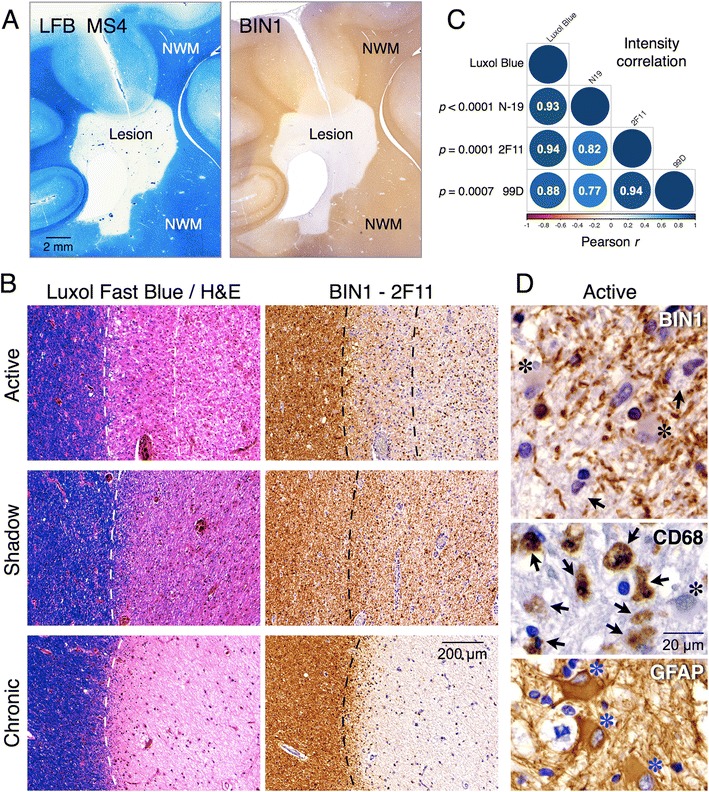
Results: Here, we report on BIN1 isoform diversity in the human brain and document alterations in the levels of select BIN1 isoforms in individuals with AD. In addition, we report striking BIN1 localization to white matter tracts in rodent and the human brain, and document that the large majority of BIN1 is expressed in mature oligodendrocytes whereas neuronal BIN1 represents a minor fraction. This predominant non-neuronal BIN1 localization contrasts with the strict neuronal expression and presynaptic localization of the BIN1 paralog, Amphiphysin 1. We also observe upregulation of BIN1 at the onset of postnatal myelination in the brain and during differentiation of cultured oligodendrocytes. Finally, we document that the loss of BIN1 significantly correlates with the extent of demyelination in multiple sclerosis lesions.

Conclusion: Our study provides new insights into the brain distribution and cellular expression of an important risk factor associated with late-onset AD. We propose that efforts to define how genetic variants in BIN1 elevate the risk for AD would behoove to consider BIN1 function in the context of its main expression in mature oligodendrocytes and the potential for a role of BIN1 in the membrane remodeling that accompanies the process of myelination.

Keywords: Alternative splicing; Alzheimer’s disease; Amphiphysin 1; BIN1; Immunohistochemistry; Isoform diversity; Late-onset Alzheimer’s disease; Multiple sclerosis; Myelination; Oligodendrocyte.


Figures

Fig. 1
Fig. 1
Quantification of BIN1 transcript levels in brains with and without AD. a Scatter plot of the normalized levels of BIN1 isoforms generated by alternative splicing of exon 7 in each sample (quantified by qPCR analysis) reveals a lack of correlation between D7 + Ex7 and D7-BIN1 expression. b qPCR analysis of BIN1 exon 7 alternative splicing in the human brain shows a significantly higher proportion of BIN1 transcripts lacking exon 7 in white matter (WM) as compared with gray matter (GM). cf Scatter plots of BIN1 + Ex7 and D7-BIN1 expression compared to SYP (synaptophysin) and MBP expression. AD = AD; Norm = normalized expression. The indicated R2 values (A, C-F) are adjusted R2 values, reflecting the presence of two independent variables in the analysis, i.e., AD status and BIN1, SYP or MBP expression
Fig. 2
Fig. 2
Immunoblot and RT-PCR analysis of BIN1 isoform diversity in the human brain. a The schematic structure of BIN1 indicating the epitopes of the antibodies used in this study. b Immunoblot analysis of neuronal and oligodendrocyte marker protein levels in extracts prepared from the human brain gray matter and white matter. c Immunoblot analysis of BIN1 and Amphiphysin 1 levels. The pAb BSH3 reacts with all BIN1 isoforms whereas mAb 2 F11 and 99D react with D7-BIN1 and + exon 17 BIN1 isoforms, respectively. The asterisks indicate non-specific signals. d The signal intensities of BIN1 were quantified using the Li-COR system, normalized to actin and plotted as mean ± SEM (n = 8). Statistical significance was assessed by ANOVA. e Schematic illustration of the alternatively spliced human brain BIN1 isoforms identified in this study. Five independent human brain samples were subjected to RT-PCR analysis by using primers corresponding to sequences within exons 12 and 18 and the resulting amplicons were fractionated by electrophoresis. The bands were excised and individually sequenced to identify the major isoforms generated by alternate splicing of exons 13–17. The exclusion of BIN1 exon 11 in brain and inclusion of exon 7 in isoforms 1 and 3 were inferred from the published literature and the RT-PCR and immunoblot results of our study
Fig. 3
Fig. 3
AD-associated changes in the levels of BIN1 isoforms. a Immunoblot analysis of BIN1 and Amphiphysin 1 levels in the brain samples from controls and AD cases. The age of each individual is listed. The blots were simultaneously probed with BIN1 and Amphiphysin 1 antibodies. The levels of actin were used as the control for loading. Note that the gray and white matter blots were scanned using different conditions to achieve equivalent signals. b The levels of Amphiphysin 1 and BIN1 isoforms in the gray matter were quantified using the Li-COR system and normalized to the levels of actin. The relative expression levels of Amphiphysin 1 and BIN1: H (~90 kDa) were plotted as mean ± SEM (n = 5). The statistical significance was analyzed by ANOVA. c The plot shows the percentage of BIN1:L (~65-75 kDa) isoform relative to all BIN1 isoforms in the gray matter of each tissue sample. d Pearson r correlation matrix analysis. The levels of multiple cellular markers were quantified as described above and the relative expression level differences in AD samples relative to the controls were used to generate the correlation matrix. Larger blue-colored circles represent a higher degree of correlation, and larger red-colored circles represent an inverse correlation. Smaller neutral-colored circles represent a lack of correlation. A color scale is drawn at the bottom. GM = gray matter; WM = white matter; Amph 1 = Amphiphysin 1
Fig. 4
Fig. 4
White matter localization and oligodendrocyte expression of BIN1 in the human brain. a Immunohistochemical staining of the hippocampus and parahippocampal gyrus using goat pAb N-19 (top) and mAb 2 F11 (bottom) reveal prominent white matter labeling. In the hippocampus, the perforant path axons and the alveus are labeled. b Higher magnification images of N-19 shows relatively weaker labeling in the cortex and intense labeling in the white matter. Note the labeling of mature oligodendrocytes (white arrows) in the enlarged area. c Higher magnification of mAb 2 F11 labeling reveals intense BIN1 labeling of smaller cells with a radial morphology and ramified processes (red arrows), and only a weak labeling of larger neuronal cell bodies (black arrows). In addition punctate and discontinuous staining along fine linear processes is also visible. d TPPP immunolabeling identifies mature oligodendrocytes in cerebral peduncle (red arrows). Analysis of adjacent serial sections reveal BIN1 labeling of mature oligodendrocytes and traversing myelinated fibers. e, f Immunohistochemical analysis of adjacent sections of hippocampal CA1 region reveals that the BIN1 cellular labeling pattern is distinct from that of microglia (Iba1) and astrocytes (GFAP). g Two-color immunostaining of BIN1 and Caspr. The inset shows a magnified area where the localization of BIN1 (brown) and Caspr (red) along adjacent segments of the axon tracts can be seen. BIN1 immunolabeling of annular structures likely represents cross sections of myelinated axons that lie perpendicular to the plane of the section. WM = white matter; Alv = alveus; Hipp = hippocampus; EC = entorhinal cortex; F = fimbria; DG = dentate gyrus; Sub = subiculum; PP = perforant path; CA1 = Cornu Ammonis area 1
Fig. 5
Fig. 5
Distinct cellular localization of BIN1 and Amphiphysin 1 in the human brain. a Immunohistochemical labeling of adjacent sections of the hippocampus and parahippocampal gyrus using mAb against Amphiphysin 1 or BIN1 (99D) reveals near complementary pattern of labeling. Amphiphysin 1 antibody does not stain the white matter whereas intense BIN1 labeling is observed in the white matter. b Amphiphysin 1 and BIN1 immunolabeling of the cortex (the boxed area in panel A) and a section of the white matter are shown at a higher magnification. Boxed regions in the external granule layer and internal pyramidal layer are also shown at further magnification to visualize the cells that are immunoreactive. Amphiphysin 1 and BIN1 labeling of morphologically distinct neurons and oligodendrocytes, respectively, are quite obvious. c Amphiphysin 1 and BIN1 labeling of the hippocampal area. A higher magnification of the boxed area of CA2 and dentate gyrus is shown at the bottom and on the right, respectively. In all areas, Amphiphysin 1 mAb stains the neuronal soma and the neuropil whereas BIN1 mAb stains smaller cells and profuse branched processes. Very little BIN1 signal is found in neurons. Amphiphysin 1 but not BIN1 localizes to the terminal fields of hippocampal mossy fibers, which are non-myelinated. Amph 1 = Amphiphysin 1; WM = white matter; Alv = alveus; Hipp = hippocampus; Sub = subiculum; EC = entorhinal cortex; CA = caudate nucleus; CP = cerebral peduncle; F = fimbria; LGN = lateral geniculate nucleus; EGL = external granular layer; IPyL = internal pyramidal layer; DG = dentate gyrus; CA2-CA4 = Cornu Ammonis areas 2–4; MF = mossy fibers; PML = polymorphic layer; GCL = granule cell layer; ML = molecular layer; SO = stratum oriens; SP = stratum pyramidale; SR = stratum raidatum
Fig. 6
Fig. 6
The distribution of BIN1 in mouse brain. BIN1 immunolabeling is in green and the marker labeling is in red. Nuclear staining with Hoechst is in blue. a Immunofluorescence labeling of coronal sections with antibodies against BIN1 (N-19 or BSH3) shows overlap with MBP but not with NeuN labeling. bg Confocal microscopy analysis of BIN1 immunolabeling. b A low magnification image of BIN1 labeling with mAb 2 F11. A higher magnification of the cortex and corpus callosum is shown in the middle and right panels. Thick and thin arrows point to BIN1 labeling of the cell body and barbarized processes in the cortex. c N-19 labeling reveals BIN1-positive cells dispersed throughout the cortical layers. d and e BIN1 and MBP labeling overlap along corticostriatal projections and in the cerebellar white matter. f BIN1 and NeuN labeling are largely distinct in the hippocampus and striatum. BIN1-positive cell bodies (white arrows) and processes in stratum oriens or fiber bundles in alveus (yellow arrows) are indicated. g BIN1 immunolabeling of cell bodies (white arrows) and fiber bundles (yellow arrows) in the striatum does not overlap with neuronal and neuropil labeling of Amphiphysin 1. CC = corpus callosum; CA1 = Cornu Ammonis area 1; SO = stratum oriens; SP = stratum pyramidale
Fig. 7
Fig. 7
Expression of BIN1 in mature oligodendrocytes. BIN1 immunolabeling is in green and the marker labeling is in red. Nuclear staining with Hoechst is in blue. a-c Sagittal sections of the cerebellum were labeled with the indicated antibodies. BIN1 labeling is prominent in the white matter whereas no labeling for Amphiphysin was observed in the white matter. Synaptophysin and Amphiphysin 1 labeling are prominent in the molecular layer synaptic terminals and in the granule cell layer mossy fibers. Higher magnification of the granule cell layer reveals BIN1-positive processes (arrows) around synaptophysin-positive mossy fibers c. The areas indicated by the rectangles are enlarged on the right. Line-scan analysis of BIN1 and synaptophysin fluorescence intensities plotted as graphs shows that the proteins localize to distinct structures. d BIN1 labeling in the cortex is found along the internodal segments of processes (arrows) adjacent to the paranodal localization of Caspr. e and f All BIN1-positive cells (arrows) are also positive for ASPA and TPPP, which are markers of mature oligodendrocytes. A higher magnification of the boxed areas is shown. gj BIN labeling in cortex and corpus callosum (white arrows) does not overlap with NG2-labeled OPCs, Iba1-labeled microglia or GFAP-labeled astrocytes (yellow arrows). Syn = synaptophysin; Amph 1 = Amphiphysin 1; WM = white matter; ML = molecular layer; GCL = granule cell layer; CC = corpus callosum; CB = cingulum bundle
Fig. 8
Fig. 8
Immunoblot analysis of BIN1 expression in rodent brain and cultured oligodendrocytes. a The post-natal increase in BIN1 expression. Immunoblots of brain lysates from the indicated developmental periods were analyzed by Western blots using the indicated antibodies. The levels of flotillin 2 and actin were assessed as loading controls. The graph represents quantification of BIN1 signal intensities normalized to actin. b The increase of BIN1 expression during in vitro oligodendrocyte differentiation. Lysates of cultured rat OPCs, mature oligodendrocytes (OL) following 3 or 5 days of differentiation, mature neurons, and astrocytes were analyzed by immunoblots. The levels of MBP, CamKII, and GFAP were analyzed as markers for mature oligodendrocytes, neurons, and astrocytes, respectively. BIN1 is highly expressed in mature oligodendrocytes whereas Amphiphysin 1 is abundant in mature neurons. The graph represents quantification of BIN1 signal intensities normalized to actin. c Enrichment of BIN1:L in the corpus callosum. Adult rat brain was microdissected into different regions and homogenates were analyzed by immunoblotting using BSH3 and cellular marker antibodies. Amph 1 = Amphiphysin 1
Fig. 9
Fig. 9
Loss of BIN1 parallels myelin loss in multiple sclerosis brain lesions. a Staining of adjacent serial autopsy brain sections with Luxol fast blue (left) and BIN1 antibody (right) shows myelin loss that parallels striking loss of BIN1 labeling intensity within a chronic/inactive multiple sclerosis plaque. b Adjacent sections of samples from multiple sclerosis patients were analyzed by histology or immunohistochemistry. Images correspond to an active lesion (top), shadow plaque (middle) and chronic plaque (bottom). Dashed lines mark the lesion border. c Luxol fast blue (not shown) and BIN1 antibody staining intensities were quantified from digitized images. The percentage difference in the staining intensities within lesions in comparison to adjacent normal white matter was calculated. Correlation matrix analysis reveals a significant correlation between myelin loss and reduction in BIN1 immunolabeling intensities. d Higher magnification of the border of an active lesion depicting myelin fragmentation and loss of BIN1 immunoreactivity. CD68 staining of foamy macrophages (arrows) and GFAP staining of hypertrophic astrocytes (asterisks) are also shown in the bottom panels. NWM = normal white matter

Similar articles

Cited by

References

    1. Prokic I, Cowling BS, Laporte J. Amphiphysin 2 (BIN1) in physiology and diseases. J Mol Med. 2014;92:453–463. doi: 10.1007/s00109-014-1138-1. - DOI - PubMed
    1. Sakamuro D, Elliott KJ, Wechsler-Reya R, Prendergast GC. BIN1 is a novel MYC-interacting protein with features of a tumour suppressor. Nat Genet. 1996;14:69–77. doi: 10.1038/ng0996-69. - DOI - PubMed
    1. Lichte B, Veh RW, Meyer HE, Kilimann MW. Amphiphysin, a novel protein associated with synaptic vesicles. EMBO J. 1992;11:2521–2530. - PMC - PubMed
    1. Butler MH, David C, Ochoa GC, Freyberg Z, Daniell L, Grabs D, Cremona O, De Camilli P. Amphiphysin II (SH3P9; BIN1), a member of the amphiphysin/Rvs family, is concentrated in the cortical cytomatrix of axon initial segments and nodes of ranvier in brain and around T tubules in skeletal muscle. J Cell Biol. 1997;137:1355–1367. doi: 10.1083/jcb.137.6.1355. - DOI - PMC - PubMed
    1. Ramjaun AR, Micheva KD, Bouchelet I, McPherson PS. Identification and characterization of a nerve terminal-enriched amphiphysin isoform. J Biol Chem. 1997;272:16700–16706. doi: 10.1074/jbc.272.26.16700. - DOI - PubMed

Publication types

MeSH terms