

The LMS and Z scale growth reference for Saudi school-age children and adolescents
- PMID: 27488329
- PMCID: PMC4991205
- DOI: 10.4103/1319-3767.187608
The LMS and Z scale growth reference for Saudi school-age children and adolescents
Abstract
Background/aim: To establish L, M, and S parameters and z score reference for the assessment of nutrition and growth of Saudi school-age children and adolescents.
Subjects and methods: Data from the original cross-sectional study were reanalyzed. The L, M, and S parameters and z scores were calculated for weight, height and body mass index for school-age children and adolescents.
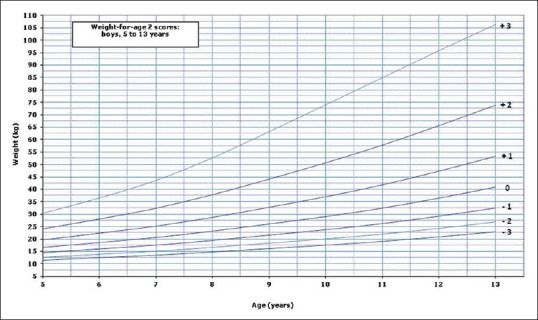
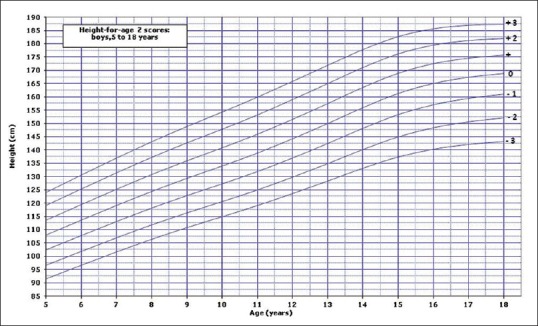
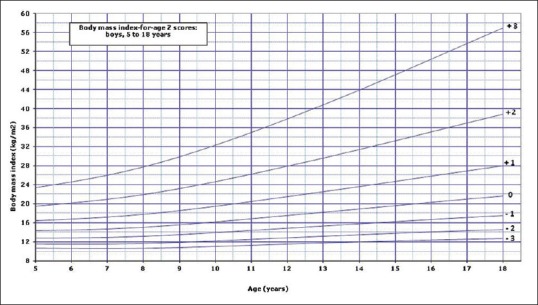
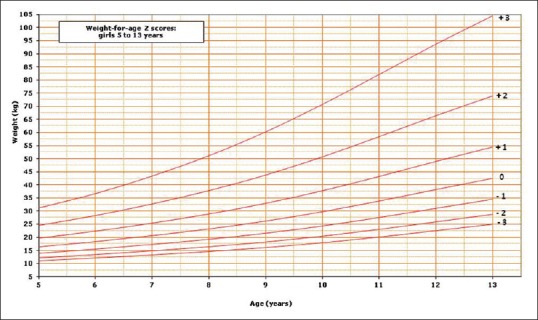
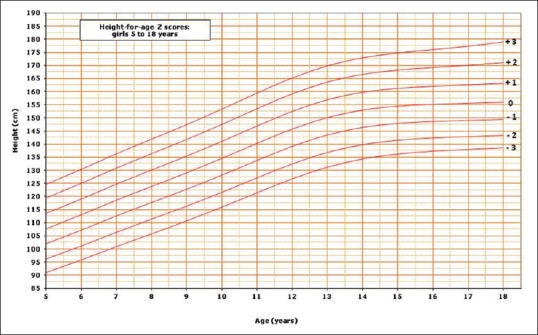
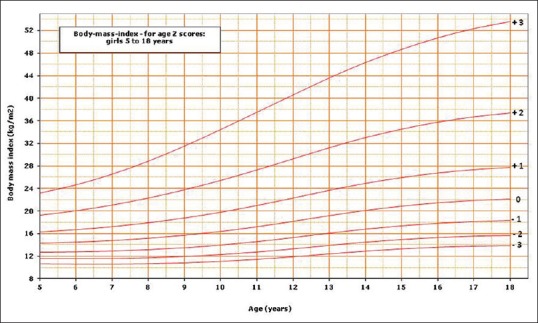
Results: A total of 19,299 subjects from 5 to 18 years of age were included. All were Saudi nationals and 9,827 (50.9%) were boys. The L M S parameters and z scores for weight for age, height for age, and BMI for age for boys and girls are presented in detailed tables across the age of commonly used z scores (+3, +2, +1, 0, -1, -2, -3). Graphs corresponding to the same parameters (weight, height, and BMI) showing the main z scores across all ages from 5 to 18 years are illustrated.
Conclusion: This report provides the first reference for nutritional status and growth of Saudi school-age children and adolescents. This tool is essential for more accurate assessment of growth and nutrition in various clinical conditions and research.
Figures
References
-
- Hamill PV, Drizd TA, Johnson CL, Reed RB, Roche AF, Moore WM. Physical growth: National Center for Health Statistics percentiles. Am J Clin Nutr. 1979;32:607–29. - PubMed
-
- Physical status: The use and interpretation of anthropometry. Report of a WHO Expert Committee. World Health Organ Tech Rep Ser. 1995;854:1–452. - PubMed
-
- Kuczmarski RJ, Ogden CL, Guo SS, Grummer-Strawn LM, Flegal KM, Mei Z, et al. 2000 CDC Growth Charts for the United States: Methods and development. Vital Health Stat. 2002;11:1–190. - PubMed
-
- de Onis M, Onyango A, Borghi E, Siyam A, Pinol A. Department of Nutrition for Health and Development. Geneva, Switzerland: WHO; 2006. The WHO Child Growth Standard: Methods and Development.
MeSH terms
LinkOut - more resources
Full Text Sources
Other Literature Sources
Medical