. 2016 Nov;46(12):1728-1735.
doi: 10.1007/s00247-016-3677-9. Epub 2016 Aug 3.

Evaluation of motion and its effect on brain magnetic resonance image quality in children

Affiliations

Evaluation of motion and its effect on brain magnetic resonance image quality in children

Onur Afacan et al. Pediatr Radiol. 2016 Nov.

Abstract

Background: Motion artifacts pose significant problems for the acquisition of MR images in pediatric populations.

Objective: To evaluate temporal motion metrics in MRI scanners and their effect on image quality in pediatric populations in neuroimaging studies.

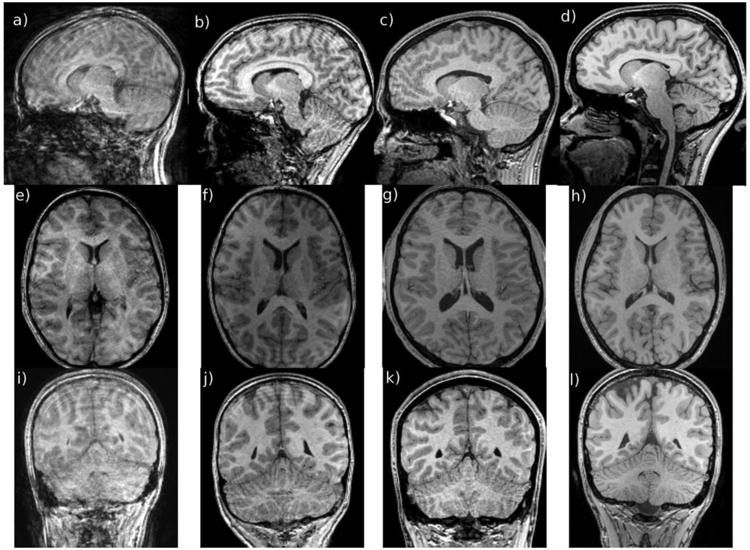
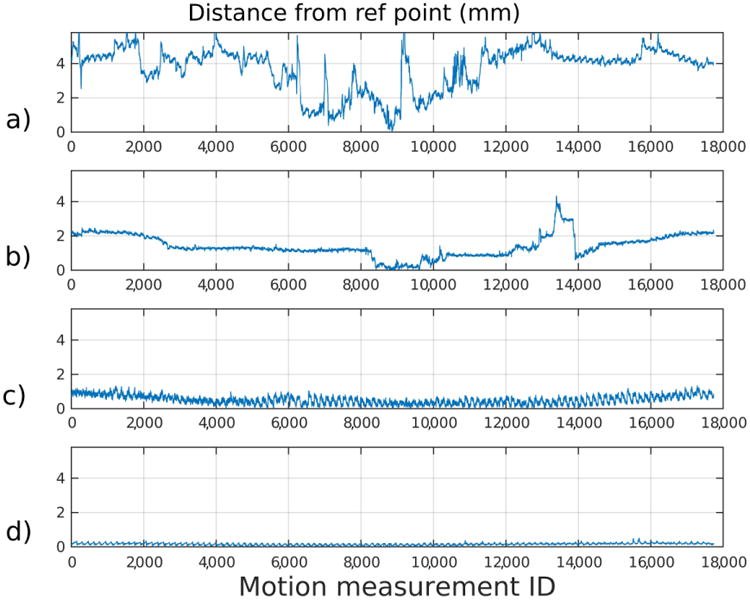
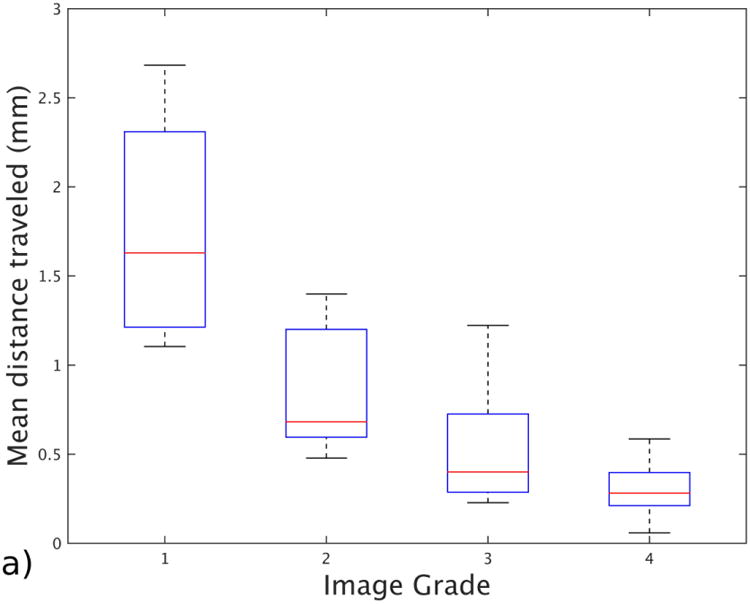
Materials and methods: We report results from a large pediatric brain imaging study that shows the effect of motion on MRI quality. We measured motion metrics in 82 pediatric patients, mean age 13.4 years, in a T1-weighted brain MRI scan. As a result of technical difficulties, 5 scans were not included in the subsequent analyses. A radiologist graded the images using a 4-point scale ranging from clinically non-diagnostic because of motion artifacts to no motion artifacts. We used these grades to correlate motion parameters such as maximum motion, mean displacement from a reference point, and motion-free time with image quality.

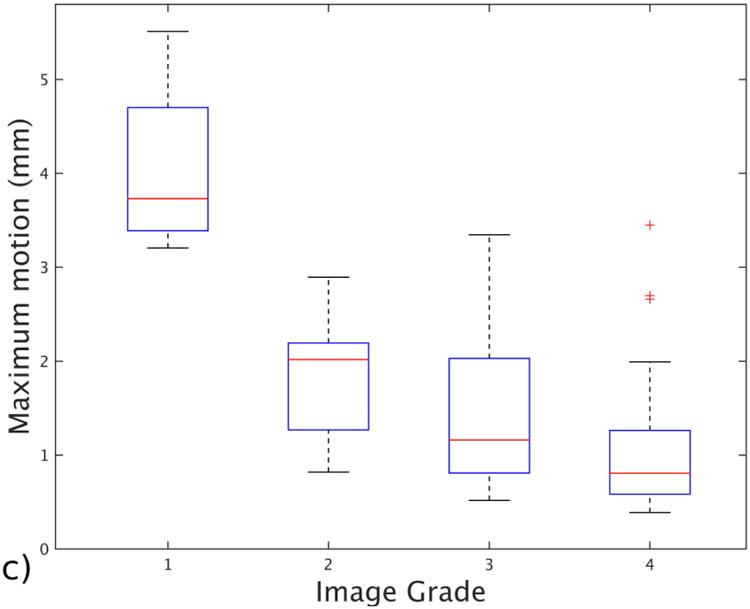
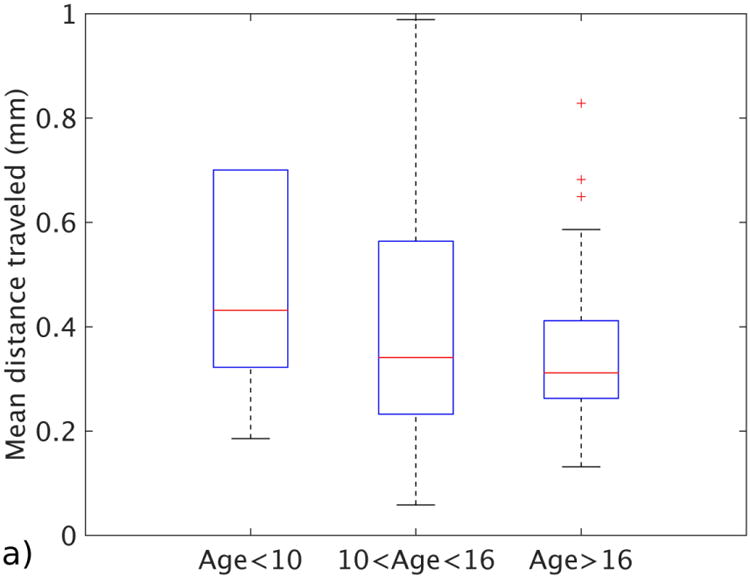
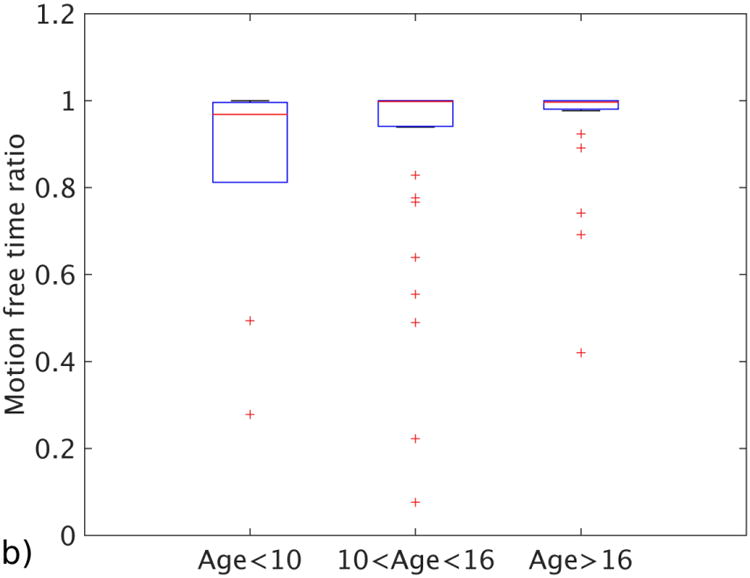
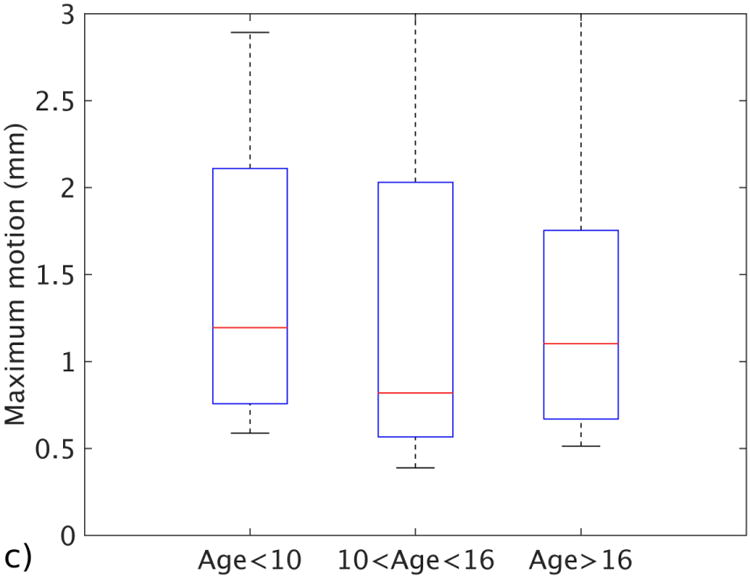
Results: Our results show that both motion-free time (as a ratio of total scan time) and average displacement from a position at a fixed time (when the center of k-space was acquired) were highly correlated with image quality, whereas maximum displacement was not as good a predictor. Among the 77 patients whose motion was measured successfully, 17 had average displacements of greater than 0.5 mm, and 11 of those (14.3%) resulted in non-diagnostic images. Similarly, 14 patients (18.2%) had less than 90% motion-free time, which also resulted in non-diagnostic images.

Conclusion: We report results from a large pediatric study to show how children and young adults move in the MRI scanner and the effect that this motion has on image quality. The results will help the motion-correction community in better understanding motion patterns in pediatric populations and how these patterns affect MR image quality.

Keywords: Artifacts; Brain; Children; Magnetic resonance imaging; Motion; Motion measurements.


Conflict of interest statement

Compliance with ethical standards: Conflicts of interest None

Figures

Fig. 1
Fig. 1
Examples of images with different motion grades, as evaluated by a radiologist with more than 15 years of experience, shown in sagittal (a–d), axial (e–h) and coronal (i–l) orientations. Image grade increases from left (1, meaning non-diagnostic because of motion artifacts, here in a 13-year-old boy) to right (4, meaning no visible motion artifacts, here in a 17-year-old boy). Image grades corresponding to 2 and 3 were from a 14-year-old boy and a 16-year-old girl
Fig. 2
Fig. 2
Sensor motion displayed in millimeters (mm) from the same children as shown in Fig. 1, ordered vertically according to image grade (a grade 1, b grade 2, c grade 3, d grade 4). The y-axis shows the sensor displacement from the reference position for the whole scan. The x-axis shows the time sample index. The motion shown in (a) resulted in a non-diagnostic image (in a 13-year-old boy), whereas the motion shown (d) resulted in an image evaluated as containing “no visible motion artifacts” (in a 17-year-old boy). Image grades corresponding to 2 and 3 were from 14-year old male and 16-year old female.
Fig. 3
Fig. 3
Box and whisker plot shows the effect of different motion statistics on image grade assigned by a radiologist with more than 15 years of experience. a Image shows mean distance traveled from the reference point for each grade group. b Image shows motion-free time as a ratio for each grade. c Image shows maximum displacement recorded for patients in each grade group. The bars show the 25th and 75th percentiles of each motion measurement for each motion grade, and brackets show the 95% confidence intervals
Fig. 3
Fig. 3
Box and whisker plot shows the effect of different motion statistics on image grade assigned by a radiologist with more than 15 years of experience. a Image shows mean distance traveled from the reference point for each grade group. b Image shows motion-free time as a ratio for each grade. c Image shows maximum displacement recorded for patients in each grade group. The bars show the 25th and 75th percentiles of each motion measurement for each motion grade, and brackets show the 95% confidence intervals
Fig. 4
Fig. 4
Motion statistics plotted against different age groups. a Image shows mean distance traveled for each age group. b Image shows motion-free time as a ratio for each age group. c Image shows the maximum displacement for patients in each age group. The bars show the 25th and 75th percentiles of each motion measurement for each motion grade, and brackets show the 95% confidence intervals
Fig. 4
Fig. 4
Motion statistics plotted against different age groups. a Image shows mean distance traveled for each age group. b Image shows motion-free time as a ratio for each age group. c Image shows the maximum displacement for patients in each age group. The bars show the 25th and 75th percentiles of each motion measurement for each motion grade, and brackets show the 95% confidence intervals

References

    1. Cote CJ, Wilson S Work Group on Sedation. Guidelines for monitoring and management of pediatric patients during and after sedation for diagnostic and therapeutic procedures: an update. Paediatr Anaesth. 2008;18:9–10. - PubMed
    1. Becke K, Landsleitner B, Reinhold P, et al. Diagnostic and interventional operations in childhood: anesthesiology management. Anaesthesist. 2010;59:1013–1020. - PubMed
    1. Krauss B, Green SM. Training and credentialing in procedural sedation and analgesia in children: lessons from the United States model. Paediatr Anaesth. 2008;18:30–35. - PubMed
    1. Schulte-Uentrop L, Goepfert MS. Anaesthesia or sedation for MRI in children. Curr Opin Anaesthesiol. 2010;23:513–517. - PubMed
    1. Havidich JE, Beach M, Dierdorf SF, et al. Preterm versus term children: analysis of sedation/anesthesia adverse events and longitudinal risk. Pediatrics. 2016;137:1–9. - PMC - PubMed