. 2016 Aug 3;36(31):8210-27.
doi: 10.1523/JNEUROSCI.2783-15.2016.

A Subtype of Olfactory Bulb Interneurons Is Required for Odor Detection and Discrimination Behaviors

Affiliations

A Subtype of Olfactory Bulb Interneurons Is Required for Odor Detection and Discrimination Behaviors

Hiroo Takahashi et al. J Neurosci. .

Abstract

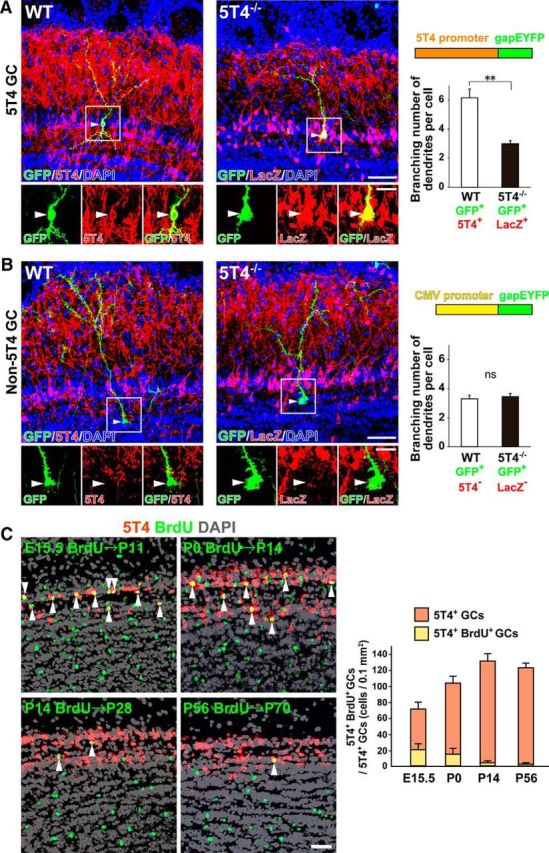
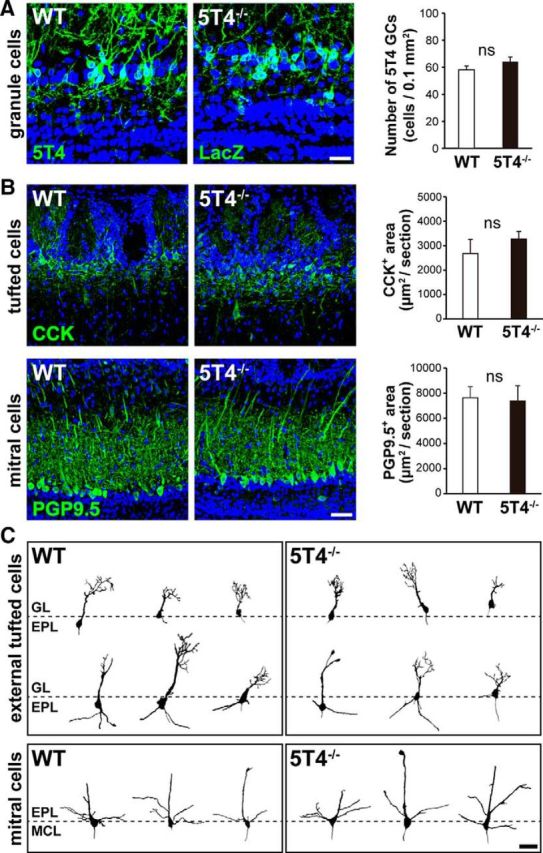
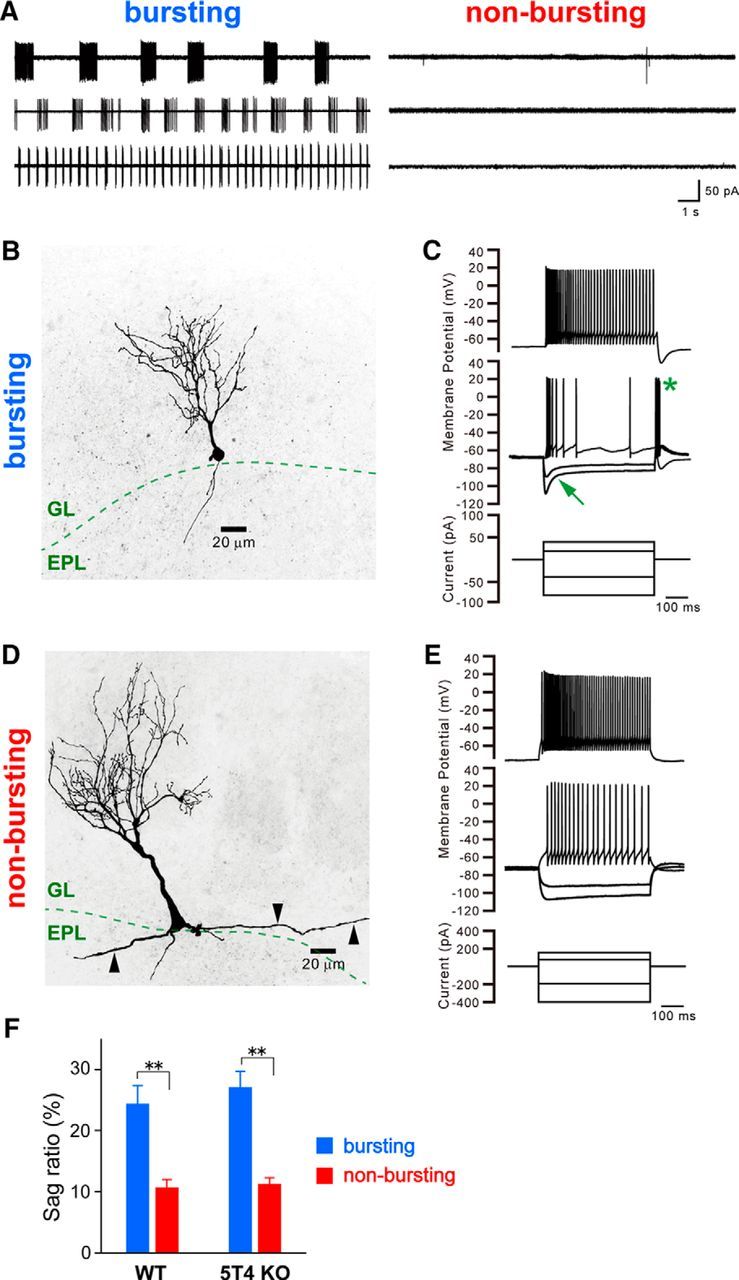
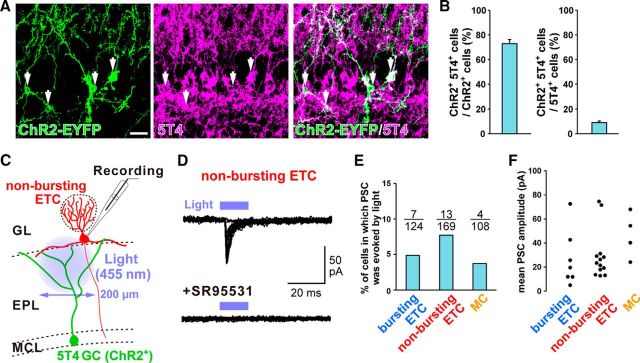
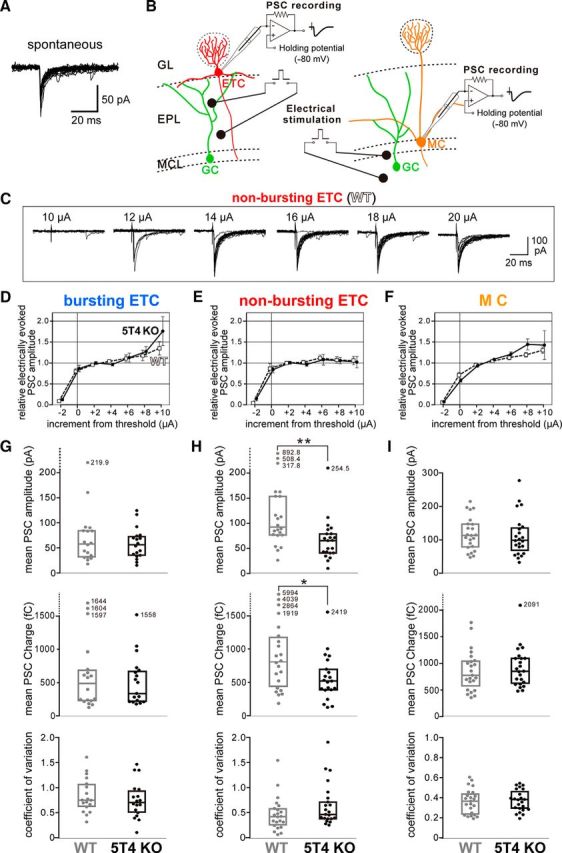
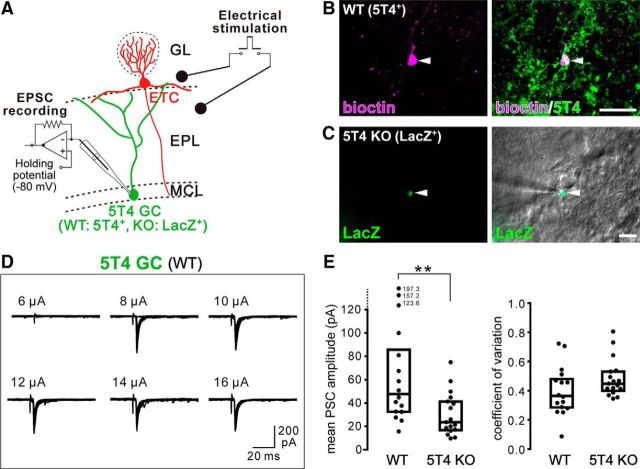
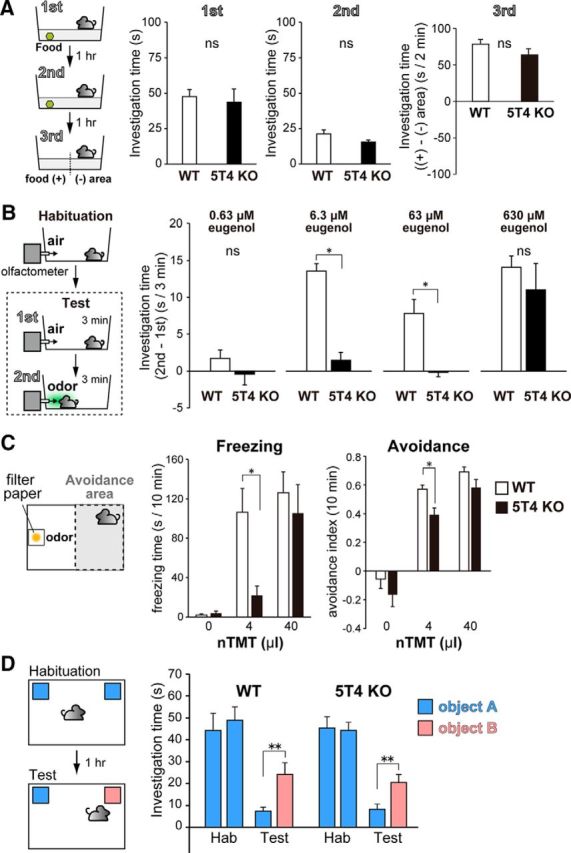
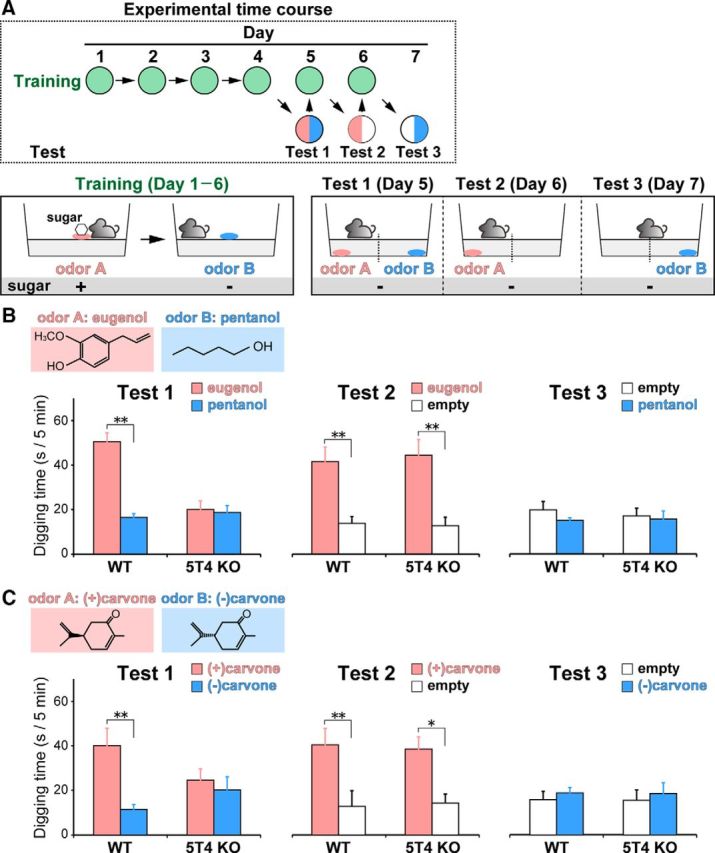
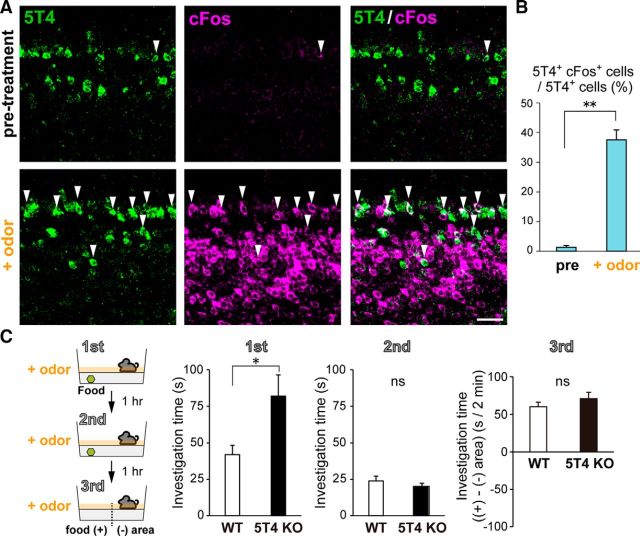
Neural circuits that undergo reorganization by newborn interneurons in the olfactory bulb (OB) are necessary for odor detection and discrimination, olfactory memory, and innate olfactory responses, including predator avoidance and sexual behaviors. The OB possesses many interneurons, including various types of granule cells (GCs); however, the contribution that each type of interneuron makes to olfactory behavioral control remains unknown. Here, we investigated the in vivo functional role of oncofetal trophoblast glycoprotein 5T4, a regulator for dendritic arborization of 5T4-expressing GCs (5T4 GCs), the level of which is reduced in the OB of 5T4 knock-out (KO) mice. Electrophysiological recordings with acute OB slices indicated that external tufted cells (ETCs) can be divided into two types, bursting and nonbursting. Optogenetic stimulation of 5T4 GCs revealed their connection to both bursting and nonbursting ETCs, as well as to mitral cells (MCs). Interestingly, nonbursting ETCs received fewer inhibitory inputs from GCs in 5T4 KO mice than from those in wild-type (WT) mice, whereas bursting ETCs and MCs received similar inputs in both mice. Furthermore, 5T4 GCs received significantly fewer excitatory inputs in 5T4 KO mice. Remarkably, in olfactory behavior tests, 5T4 KO mice had higher odor detection thresholds than the WT, as well as defects in odor discrimination learning. Therefore, the loss of 5T4 attenuates inhibitory inputs from 5T4 GCs to nonbursting ETCs and excitatory inputs to 5T4 GCs, contributing to disturbances in olfactory behavior. Our novel findings suggest that, among the various types of OB interneurons, the 5T4 GC subtype is required for odor detection and discrimination behaviors.

Significance statement: Neuronal circuits in the brain include glutamatergic principal neurons and GABAergic interneurons. Although the latter is a minority cell type, they are vital for normal brain function because they regulate the activity of principal neurons. If interneuron function is impaired, brain function may be damaged, leading to behavior disorder. The olfactory bulb (OB) possesses various types of interneurons, including granule cells (GCs); however, the contribution that each type of interneuron makes to the control of olfactory behavior remains unknown. Here, we analyzed electrophysiologically and behaviorally the function of oncofetal trophoblast glycoprotein 5T4, a regulator for dendritic branching in OB GCs. We found that, among the various types of OB interneuron, the 5T4 GC subtype is required for odor detection and odor discrimination behaviors.

Keywords: dendritic arborization; odor detection; odor discrimination; olfactory bulb interneuron; optogenetics; transmembrane protein.


Figures

Figure 1.
Figure 1.
5T4 affects dendritic development in 5T4 GCs, but not in non-5T4 GCs. A, B, Dendritic branching in 5T4 GCs (A) and non-5T4 GCs (B). A lentiviral vector carrying CMVp-gapEYFP was injected into the LVs of WT and 5T4−/− mice at P3, and OB sections were immunostained with the GFP antibody (green) and the 5T4 or LacZ antibody (red) at P21. Scale bars, 50 μm. Enlarged photos of the area enclosed by a white square in an upper panel are shown below. Scale bars, 20 μm. White arrowheads indicate the cell bodies of 5T4 GCs and non-5T4 GCs. Right, The branching number of GC dendrites is expressed as the mean ± SEM (p = 0.6511, ns, and **p = 0.0002 between WT and 5T4−/− mice, Student's t test; n = 20 cells from three animals of each line). C, IHC and ISH of WT OB sections with the BrdU antibody (green) and 5T4 probe (red), respectively. Scale bar, 40 μm. Right, Numbers of 5T4+ GCs and BrdU+ 5T4+ GCs are shown as the mean ± SEM (n = 6 sections per bar in the graph from 3 animals). Note that 5T4 GCs are generated mainly during the embryonic (E15.5) and neonatal (P0) stages.
Figure 2.
Figure 2.
The morphology of OB projection neurons is not affected in 5T4 KO mice. A, IHC of OB sections from the WT and 5T4−/− mice at P56 with antibodies against 5T4 and LacZ, respectively. Right, Number of 5T4 GCs (5T4 or LacZ-positive) is expressed as the mean ± SEM (p = 0.201, ns, between WT and 5T4−/− mice, Student's t test; n = 6 sections per bar from three animals). Scale bar, 20 μm. B, IHC of OB sections from the WT and 5T4−/− mice at P56 with antibodies against cholecystokinin (CCK) and PGP9.5. Scale bar, 40 μm. Right, Areas of CCK+ and PGP9.5+ are expressed as the mean ± SEM [p = 0.864 (CCK+) and 0.392 (PGP9.5+) between WT and 5T4−/− mice, Student's t test; n = 6 sections per bar from 3 animals]. Note that the densities of MCs (PGP9.5-positive) and TCs (CCK-positive) are not remarkably different between WT and 5T4−/− mice. C, Golgi–Cox staining of OB sections from the WT and 5T4−/− mice at P56–P84. GL, glomerular layer; EPL, external plexiform layer; MCL, mitral cell layer. Scale bar, 40 μm.
Figure 3.
Figure 3.
Electrophysiological recordings classify ETCs into two types. A, Sample current traces in the cell-attached configuration showing firing bursts recorded from three different bursting and nonbursting ETCs. B, D, Two-dimensional projection of morphologies in a biocytin-labeled bursting (B) or nonbursting (D) ETC. Basal dendrites extending laterally in the superficial EPL are indicated by arrowheads. Scale bars, 20 μm. C, E, Voltage traces in current-clamp mode from the bursting (C) and nonbursting (E) ETCs shown in B and D, respectively. Spike trains elicited by depolarizing current injections showed noticeable accommodation. Voltage responses induced by hyperpolarizing current injections exhibited prominent sags (arrow) upon membrane hyperpolarization and rebound depolarization accompanied by burst firings (asterisk). F, Sag ratios in two types of ETCs from WT and 5T4 KO mice. The bursting ETCs showed a significantly higher sag ratio to 30 mV hyperpolarization than the nonbursting ETCs in both WT and 5T4−/− OBs (**p < 0.0001 bursting vs nonbursting ETCs; WT: bursting ETC, n = 17, nonbursting ETC, n = 20; 5T4 KO: bursting ETC, n = 17, nonbursting ETC, n = 19).
Figure 4.
Figure 4.
Optogenetic stimulation of ChR2-expressing 5T4 GCs in OB slices. A, Expression of ChR2-EYFP in Ai32 mice injected with the 5T4p-Cre lentiviral vector. IHC of OB sections with antibodies against GFP (green) and 5T4 (magenta). Scale bar, 40 μm. B, Ratios of EYFP + 5T4+ GCs in EYFP + cells (left) and EYFP+ 5T4+ GCs in 5T4+ GCs (right) are shown as the mean ± SEM (n = 6 sections from 2 animals). C, Schematic diagram of light-evoked GABAA-PSCs recorded from an ETC. A superficial, upper half of the EPL near the recorded ETC was irradiated by light (10–15 ms in duration) to activate the ramified dendritic tufts of ChR2-expressing GCs. D, Representative traces of light-evoked GABAA-PSCs recorded from a nonbursting ETC. Thirteen traces including failures are superimposed. A horizontal bar represents light (455 nm) irradiation to the EPL. Note that the GABAA-PSCs in nonbursting ETCs (top) were completely abolished by SR95531 (an inhibitor of the GABAA receptor) (bottom). E, Ratios of cells showing light-evoked GABAA-PSCs in bursting ETCs, nonbursting ETCs, and MCs. F, Distribution of GABAA-PSC amplitudes in bursting ETCs, nonbursting ETCs, and MCs. Note that the mean amplitudes of GABAA-PSCs were indistinguishable between the three types.
Figure 5.
Figure 5.
GABAergic inputs are reduced in nonbursting ETCs from 5T4 KO mice. A, Superimposed traces of spontaneous GABAA-PSCs with an amplitude larger than 40 pA recorded from a nonbursting ETCs in WT mice. Each trace is lined up at onset. B, Schematic diagram of electrically evoked GABAA-PSCs recorded from an ETC (left) or an MC (right). GCs were stimulated with a constant current (200 μs in duration) using a bipolar platinum electrode (50 μm in diameter) placed in the EPL. Evoked GABAA-PSCs were recorded from an ETC or an MC at a holding potential of −80 mV. C, Representative traces of evoked GABAA-PSCs recorded at different stimulus intensities (10–20 μA) from the nonbursting ETC. For each stimulus intensity, 20 traces are superimposed. DF, Plots for the amplitude of electrically evoked GABAA-PSCs versus the stimulus intensity (increment from a threshold current) in bursting ETCs (D), nonbursting ETCs (E), and MCs (F) between WT (dotted lines) and 5T4 KO mice (solid lines). The amplitude of GABAA-PSCs is expressed as ratios to the mean amplitude of stable minimal PSCs. GI, Scatter plots for the mean amplitude (top), integrated charge (center), and coefficient of variation (bottom) of evoked GABAA-PSCs recorded from bursting ETCs (G), nonbursting ETCs (H), and MCs (I) in WT and 5T4 KO mice (**p < 0.01, *p < 0.05 WT vs 5T4 KO mice, Mann–Whitney rank-sum test; bursting ETCs: n = 18 cells from each line; nonbursting ETCs: n = 22 WT and n = 21 5T4 KO cells; MCs: n = 23 cells from each line). Outlying data are shown as individual points with each numerical value. The internal bar and height of the box represent the median and interquartile range, respectively.
Figure 6.
Figure 6.
Excitatory inputs are reduced in 5T4 GCs from 5T4 KO mice. A, Schematic diagram of electrically evoked EPSCs recorded from a 5T4 GC. ETCs were stimulated with a constant current (200 μs in duration) using a bipolar platinum electrode (50 μm in diameter) placed in the EPL. Evoked EPSCs were recorded from a 5T4 GC at a holding potential of −80 mV. B, In WT OB slices, recorded cells were injected with biocytin (magenta) with a pipette and subjected to whole-mount IHC with the 5T4 antibody (green) to identify 5T4 GCs. Scale bar, 20 μm. C, In 5T4−/− OB slices, in which cells had been loaded with the LacZ substrate using a recording pipette, LacZ-positive GCs, namely, 5T4-derived GCs, were recorded. Differential interference contrast (right) and fluorescent (left) images of a LacZ-positive GC in the MCL are indicated under the conventional whole-cell configuration. Note that fluorescence became apparent after rupturing the cell membrane. Scale bar, 20 μm. D, Representative traces of electrically evoked EPSCs recorded at different stimulus intensities (6–16 μA) from 5T4 GCs. For each stimulus intensity, 20 traces are superimposed. E, Scatter plots for the mean amplitude (left) and coefficient of variation (right) of electrically evoked EPSCs recorded from 5T4-derived GCs in WT and 5T4 KO mice (**p = 0.0077 WT vs 5T4 KO mice, Mann–Whitney rank-sum test; n = 16 WT and n = 17 5T4 KO cells).
Figure 7.
Figure 7.
Detection thresholds for odors are higher in 5T4 KO mice. A, Food-finding test for WT and 5T4 KO mice. Center, In the first and second trials, times spent by the fasted mice in finding a food pellet buried at the same position under the bedding on one side of the test cage were measured at 1 h intervals between the 2 trials. One hour later, the third trial was performed without a food pellet and the investigation time in each area during the 2 min test was measured. Right, Bars depict the difference in time taken by the mice to investigate each area of the cage in the third trial. Note that WT and 5T4 KO mice could not be distinguished based on food-seeking times, expressed as the mean ± SEM [p = 0.709, ns. (first), 0.082 (second), and 0.186 (third)] between WT and 5T4 KO mice (Welch t test with Holm–Bonferroni correction; n = 7 WT and n = 8 5T4 KO animals). B, Olfactory habituation–dishabituation test for the WT and 5T4 KO mice. First, clean air was supplied into the test cage and mice were habituated for 15 min. In the first trial, clean air was supplied for 3 min. Differences in investigation times between the first trial and second trial with eugenol are expressed as the mean ± SEM [p = 0.275, ns (0.63 μm) and p = 0.463 (630 μm); *p = 0.000001, significant (6.3 μm) and p = 0.007 (63 μm)] between WT and 5T4 KO mice (Welch t test with Holm–Bonferroni correction; n = 5 animals in each condition). C, Olfactory avoidance test for WT and 5T4 KO mice. Mice were transferred to the test cage and exposed to a filter paper scented with 3 different amounts (0, 4, and 40 μl) of nTMT. Freezing time and avoidance index during the 10 min test are expressed as the mean ± SEM (*p = 0.008 freezing and p = 0.014 avoidance WT vs 5T4 KO mice; Welch t test with Holm–Bonferroni correction; n = 5 animals in each condition). D, Object recognition test for WT and 5T4 KO mice. Object exploration times for animals presented with either two identical (habituation phase: object A) or two different (test phase: objects A and B) objects are expressed as the mean ± SEM (*p = 0.006 WT and p = 0.008 5T4 KO right vs left objects; Wilcoxon signed-rank test; n = 11 WT and n = 9 5T4 KO animals).
Figure 8.
Figure 8.
Discrimination learning between two different odors is impaired in 5T4 KO mice. A, Odor discrimination learning test. The top schema indicates the experimental time course. In the training phase on days 1–6, WT and 5T4 KO mice learned to associate the sugar reward with odor A. In the test phase on days 5–7, the sugar reward was removed from odor A, followed by odor discrimination learning (Tests 1–3). The time taken by the mice to dig at each side of the test cage was measured. B, Digging times during the 5 min test (Tests 1–3) are represented as bar graphs: eugenol paired with the sugar reward (red) and pentanol unpaired (blue). In Tests 2 and 3, digging times in the area without odors (white bars) are expressed as the mean ± SEM (**p = 0.000001 Test 1, WT; p = 0.00001 Test 2, WT; p = 0.000006 Test 2, 5T4 KO between both areas in each test; two-way repeated-measures ANOVA; n = 5 animals from each line). C, Digging times during the 5 min test (Tests 1–3) are represented as bar graphs: (+) carvone paired with the sugar reward (red) and (−) carvone unpaired (blue). Digging times are expressed as the mean ± SEM (**p = 0.001 Test 1, WT; p = 0.008, Test 2, WT; *p = 0.0169, Test 2, 5T4 KO between both areas in each test; two-way repeated-measures ANOVA; n = 5 animals from each line).
Figure 9.
Figure 9.
5T4 KO mice cannot discriminate food odor in the presence of a background odor. A, Double ISH with RNA probes to 5T4 (green) and cFos (neuronal activity marker, magenta) genes in OB sections from P21 odor-stimulated mice. cFos expression was induced immediately in 5T4 GCs after stimulation with the odorant amyl acetate for 30 min. Scale bar, 40 μm. B, Ratios of cFos+ 5T4+ GCs in 5T4 + GCs are shown as the mean ± SEM (**p = 0.00009 vs pretreatment condition, Student's t test; n = 6 sections per bar from three animals). C, Food-finding test was performed in the presence of the food-unrelated odorant amyl acetate. Center, In the first and second trials, the times taken by the fasted mice to find a food pellet buried at the same position under the bedding in one side of the test cage were measured at a 1 h interval between them. One hour later, the third trial was performed without a food pellet and the time spent by the mice in each side of the cage was measured during the 2 min test. Right, Bars depict the difference in time taken by the mice to investigate each area of the cage in the third trial. Compared with WT mice, 5T4 KO mice needed longer food-seeking times, which are expressed as the mean ± SEM [p = 0.371, ns (second); p = 0.426 (third); *p = 0.010 between WT and 5T4 KO mice, Welch t test with Holm–Bonferroni correction; n = 13 WT and n = 8 5T4 KO animals).
Figure 10.
Figure 10.
Olfactory behaviors are also impaired in OB-specific 5T4 KD mice. A, 5T4 protein production in WT and OB-specific 5T4 KD mice. Lentiviral vectors carrying three kinds of H1p-5T4-shRNAs were injected into both LVs and OBs of WT mice at P1. OB sections were immunostained with the 5T4 antibody (green) at P21. Scale bar, 40 μm. Right, Signal intensity of 5T4 within the EPL is expressed as the mean ± SEM (**p = 0.009 vs control OBs; Student's t test; n = 6 sections from three animals in each line). B, Two successive olfactory habituation–dishabituation tests for 5T4 KD mice. Differences in investigation times between the first trial and second trial using eugenol at two different concentrations (Test 1, 6.3 μm; Test 2, 630 μm) are expressed as the mean ± SEM (p = 0.508, ns; *p = 0.0007 control vs 5T4 KD mice, Welch t test with Holm–Bonferroni correction; n = 12 control and n = 11 5T4 KD animals). C, Olfactory avoidance test for 5T4 KD mice. Mice were transferred to the test cage and exposed to a filter paper scented with nTMT in 3 different amounts (0, 4, and 40 μl). Freezing time and avoidance index during the 10 min test period are expressed as the mean ± SEM (*p = 0.002 control vs 5T4 KD mice, Welch t test with Holm–Bonferroni correction; n = 5 animals in each condition). D, Odor discrimination learning test for 5T4 KD mice. Digging times during the 5 min test (Tests 1–3) are represented as bar graphs: eugenol paired with the sugar reward (red) and pentanol unpaired (blue). Digging times are expressed as the mean ± SEM (**p = 0. 00005, Test 1, control; p = 0.00005, Test 2, control; p = 0.00002, Test 2, 5T4 KD between both areas in each test; two-way repeated-measures ANOVA; n = 5 animals from each line).

References

    1. Abraham NM, Egger V, Shimshek DR, Renden R, Fukunaga I, Sprengel R, Seeburg PH, Klugmann M, Margrie TW, Schaefer AT, Kuner T. Synaptic inhibition in the olfactory bulb accelerates odor discrimination in mice. Neuron. 2010;65:399–411. doi: 10.1016/j.neuron.2010.01.009. - DOI - PMC - PubMed
    1. Adam Y, Mizrahi A. Circuit formation and maintenance - perspectives from the mammalian olfactory bulb. Curr Opin Neurobiol. 2010;20:134–140. doi: 10.1016/j.conb.2009.11.001. - DOI - PubMed
    1. Alonso M, Lepousez G, Sebastien W, Bardy C, Gabellec MM, Torquet N, Lledo PM. Activation of adult-born neurons facilitates learning and memory. Nat Neurosci. 2012;15:897–904. doi: 10.1038/nn.3108. - DOI - PubMed
    1. Antal M, Eyre M, Finklea B, Nusser Z. External tufted cells in the main olfactory bulb form two distinct subpopulations. Eur J Neurosci. 2006;24:1124–1136. doi: 10.1111/j.1460-9568.2006.04988.x. - DOI - PMC - PubMed
    1. Banerjee A, Marbach F, Anselmi F, Koh MS, Davis MB, Garcia da Silva P, Delevich K, Oyibo HK, Gupta P, Li B, Albeanu DF. An interglomerular circuit gates glomerular output and implements gain control in the mouse olfactory bulb. Neuron. 2015;87:193–207. doi: 10.1016/j.neuron.2015.06.019. - DOI - PMC - PubMed

Publication types