. 2016 Aug 4:7:12402.
doi: 10.1038/ncomms12402.

Ionic imbalance induced self-propulsion of liquid metals

Affiliations

Ionic imbalance induced self-propulsion of liquid metals

Ali Zavabeti et al. Nat Commun. .

Abstract

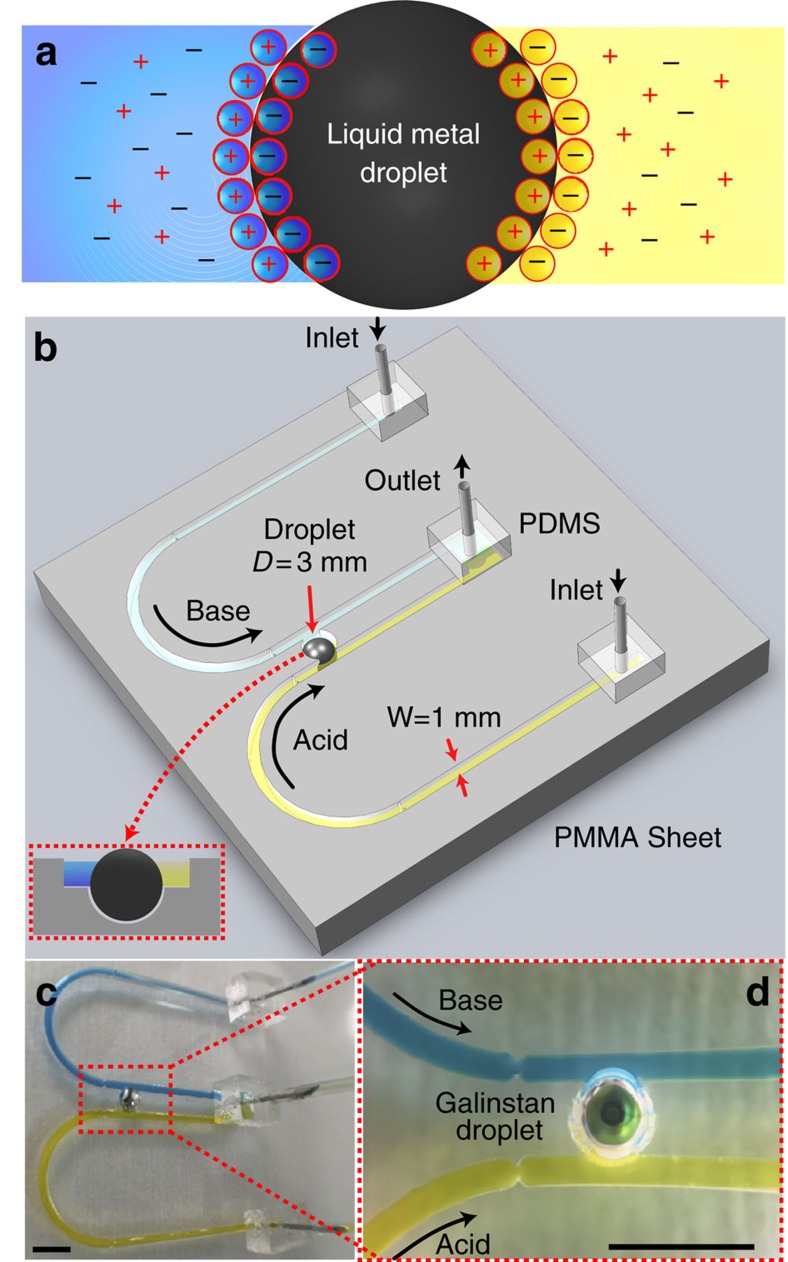
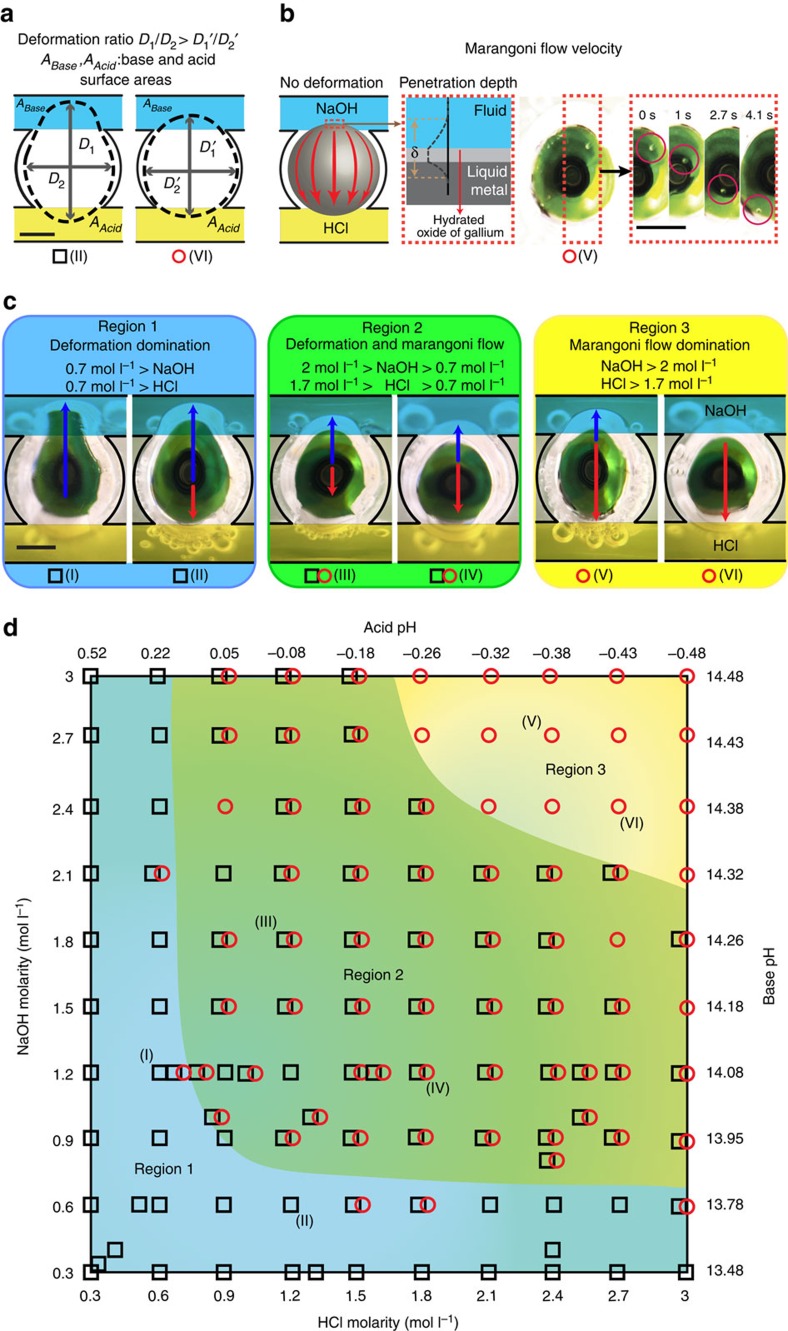
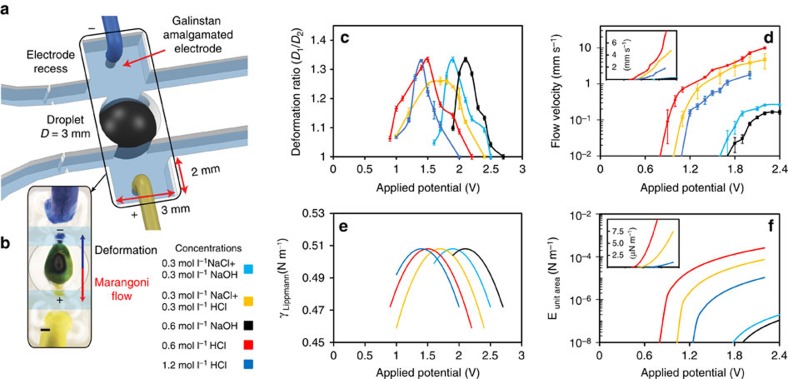
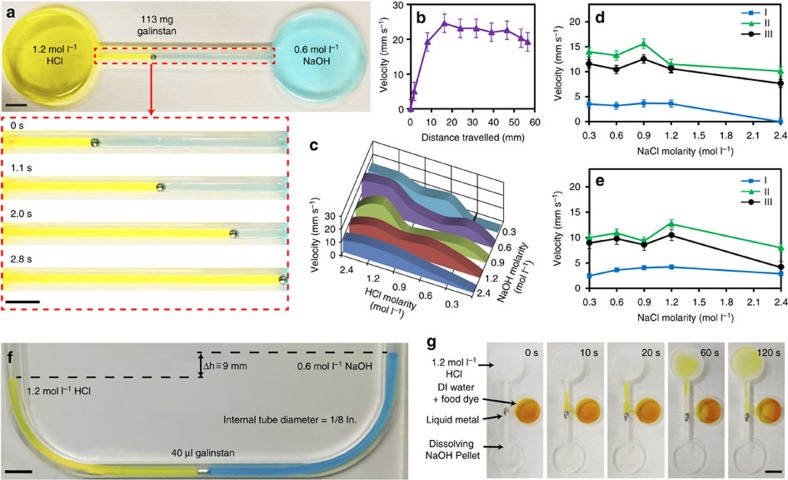
Components with self-propelling abilities are important building blocks of small autonomous systems and the characteristics of liquid metals are capable of fulfilling self-propulsion criteria. To date, there has been no exploration regarding the effect of electrolyte ionic content surrounding a liquid metal for symmetry breaking that generates motion. Here we show the controlled actuation of liquid metal droplets using only the ionic properties of the aqueous electrolyte. We demonstrate that pH or ionic concentration gradients across a liquid metal droplet induce both deformation and surface Marangoni flow. We show that the Lippmann dominated deformation results in maximum velocity for the self-propulsion of liquid metal droplets and illustrate several key applications, which take advantage of such electrolyte-induced motion. With this finding, it is possible to conceive the propulsion of small entities that are constructed and controlled entirely with fluids, progressing towards more advanced soft systems.


Figures

Figure 1
Figure 1. Framework for analysing liquid metal droplet dynamics under ionic imbalance.
(a) Top view schematic of the droplet and arrangement of ions, forming the EDL. (b) Schematic of the experimental setup showing two U-shaped open-top (see inset) polymethyl methacrylate (PMMA) inlet channels, which extend in parallel and join at an outlet. Two channels carry different types of electrolytes represented in distinct colours, acidic in yellow and basic in blue. Two parallel flows come in contact with the Galinstan droplet of 3 mm diameter residing in a recess. (c) Actual experimental set up. (d) Close-up view of c. Scale bars, 5 mm.
Figure 2
Figure 2. Dynamics of the liquid metal droplets under different HCl and NaOH concentrations.
(a) Schematic of the deformation ratio measurements for D1/D2 assessment. ‘Black square' indicates experiments with deformation dominating the dynamics and Marangoni flow dominant experiments are represented by ‘red circles'. (b) Demonstration of Marangoni flow and sequential snap shots shows a micro particle transferring from NaOH to HCl. The tangential skin flow displaced component, as a result of the Marangoni effect, contains a Galinstan layer near the surface of the droplet, an oxide layer and a layer of electrolyte also near the surface. A thickness of δ is used to define the effective thickness of this layer. (c) Selected enlarged images showing droplet deformation (in black arrows) towards NaOH, while Marangoni flow (in red arrows) direction is towards HCl. (d) Reference diagram of liquid metal droplet dynamics under a pH imbalance. Each ‘black square' or ‘red circle' presents an experiment with measurable deformation ratio or Marangoni flow, respectively (overlapped ‘black square' and ‘red circle' indicates experiments with both measurable Marangoni flow and deformation ratios without a distinct dominating effect), in various ionic concentrations of HCl and NaOH between 0.3 and 3 mol l−1 (pH ∼0.5 to ∼−0.5 for HCl and ∼13.5 to ∼14.5 for NaOH, respectively). The background of the reference diagram is coloured blue, green and yellow accordingly, to represent each of the regions (deformation, deformation–Marangoni and Marangoni regions) discussed in the text. Scale bars, 1 mm.
Figure 3
Figure 3. Changes of deformation and Marangoni flow under different conditions.
(a) Graph of the experimental measurements with varying NaOH and constant HCl molarities. Error bars are s.e.m. (N=6). (b) Graph of the experimental measurements with varying HCl and constant NaOH molarities. Black and red lines indicate droplet deformation ratio and Marangoni flow rates, respectively. Background colours correspond to regions of the reference diagram in Fig. 2c. Error bars are s.e.m. (N=6). (cf) Graphs present the deformation ratio and Marangoni flow in varying concentrations of NaCl, while concentrations of NaOH and HCl are kept constant. NaCl is mixed with NaOH in all experiments. Error bars are s.e.m. (N=6).
Figure 4
Figure 4. Characterization of droplet dynamics with an external applied electrical potential.
(a) Electrodes are covered with Galinstan and placed in rectangular recesses. (b) Marangoni flow and deformation direction of droplet created by the electrical potential. Scale bar, 0.5 cm. (c) Deformation ratios under the applied electrical potential. Error bars indicate s.e.m. (N=6). (d) Marangoni flow velocities under the applied electrical potential. Applied potentials that are greater than presented here cause the oxidation of the liquid metal. Error bars indicate s.e.m. (N=6). Calculated: (e) surface tension of the Galinstan droplet using Lippmann's equation (PZC value for EGaIn has been used in the simulation as the PZC of Galinstan27) and (f) the kinetic energies of Marangoni flows per unit area of a surface's cross-section. Insets in d and f show graphs in linear scales.
Figure 5
Figure 5. Liquid metal self-propulsion.
(a) Droplet propels from 1.2 mol l−1 HCl to 0.6 mol l−1 NaOH reservoir. (b) The instantaneous droplet velocity profile of experiment a. Error bars indicate the s.e.m. (N=2). (c) Average velocity of droplets under different acidic and basic solutions. (d,e) Droplet velocities at different NaCl concentrations. Error bars indicate the s.e.m. (N=3). I, II, III in d indicate constant 0.6 mol l−1 NaOH (pH ∼13.8) and 0.6, 1.2 and 2.4 mol l−1 HCl (pH 0.2, ∼−0.1 and ∼−0.4), respectively. I, II, III in e indicate constant 1.2 mol l−1 NaOH (pH ∼14.1) and 0.6, 1.2 and 2.4 mol l−1 HCl (pH ∼0.2, ∼−0.1 and ∼−0.4), respectively. (f) Metal droplet pushes the liquid to produce a 6.5 mm difference in height. According to the ρgh (in which ρ is the density, g is the gravitation acceleration constant and h is the liquid height), this amount of liquid equates to a pressure exceeding ∼1 mbar for 1/8 inch diameter tubing. By reducing the area, this headpressure can be significantly increased. (g) The concept of a switch based on the motion induced by the electrolyte difference on either side of the droplet. The pH difference across the liquid metal droplet induces a motion towards the basic liquid and opens the inlet to the liquid with DI water/yellow dye after 10 s. The liquid in the middle reservoir then mixes with the acidified liquid in the top reservoir. Snapshots taken at: 0, 10, 20, 60 and 120 s. Scale bars, 1 cm.

References

    1. Sackmann E. K., Fulton A. L. & Beebe D. J. The present and future role of microfluidics in biomedical research. Nature 507, 181–189 (2014). - PubMed
    1. Whitesides G. M. The origins and the future of microfluidics. Nature 442, 368–373 (2006). - PubMed
    1. Fan X. & White I. M. Optofluidic microsystems for chemical and biological analysis. Nat. Photonics 5, 591–597 (2011). - PMC - PubMed
    1. Mitchell P. Microfluidics - downsizing large-scale biology. To what extent has microfluidics technology fulfilled life science researchers' expectations of creating a viable “lab-on-a-chip”? Nat. Biotechnol. 19, 717–721 (2001). - PubMed
    1. Elvira K. S., Casadevall i Solvas X., Wootton R. C. & deMello A. J. The past, present and potential for microfluidic reactor technology in chemical synthesis. Nat. Chem. 5, 905–915 (2013). - PubMed