. 2016 Oct 1;27(19):2935-45.
doi: 10.1091/mbc.E16-05-0322. Epub 2016 Aug 3.

The sequential activation of the mitotic microtubule assembly pathways favors bipolar spindle formation

Affiliations

The sequential activation of the mitotic microtubule assembly pathways favors bipolar spindle formation

Tommaso Cavazza et al. Mol Biol Cell. .

Abstract

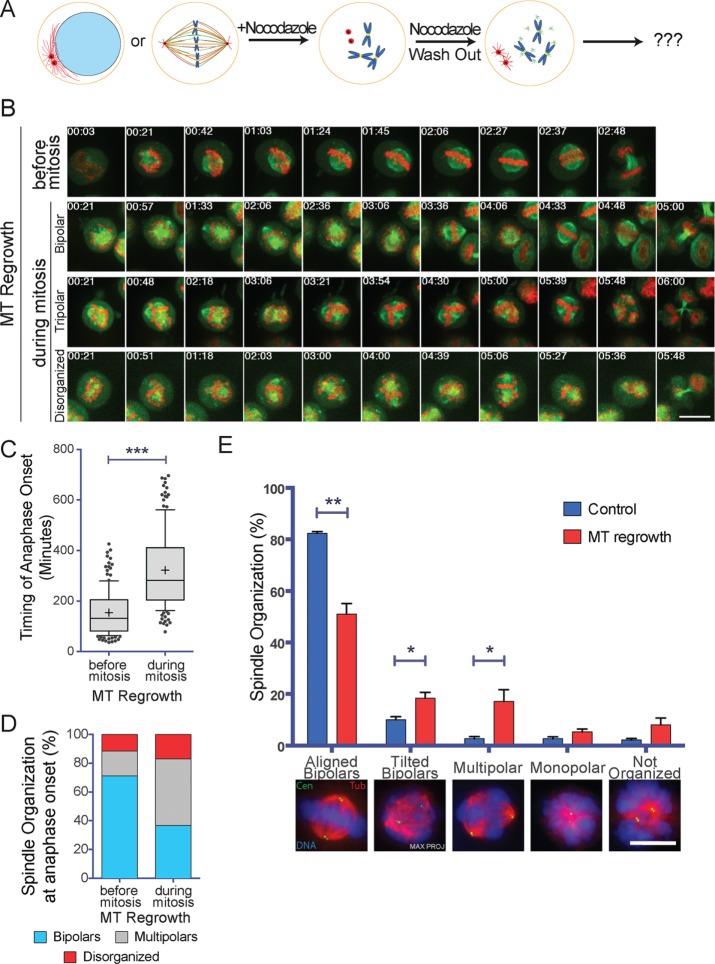
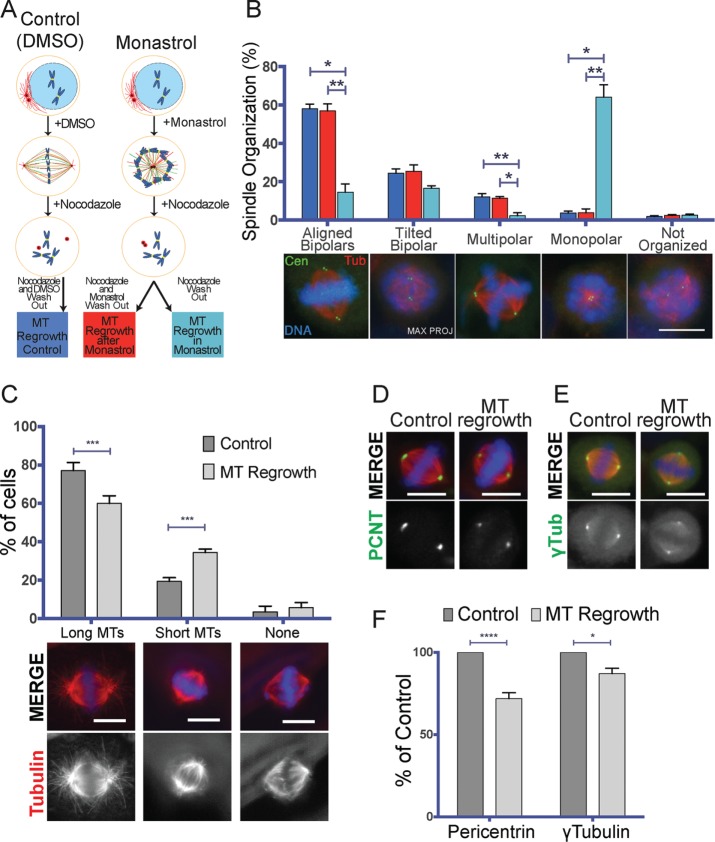
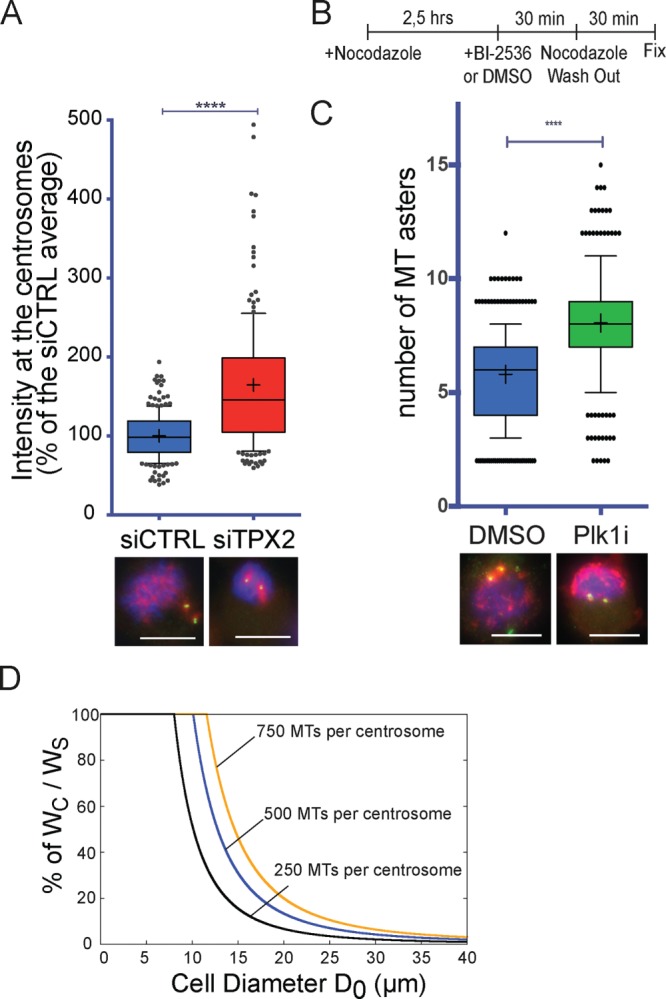
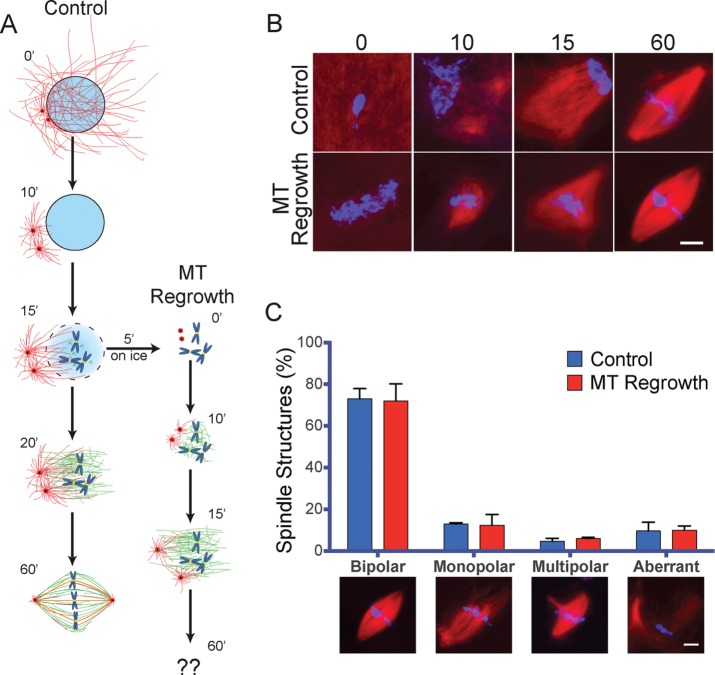
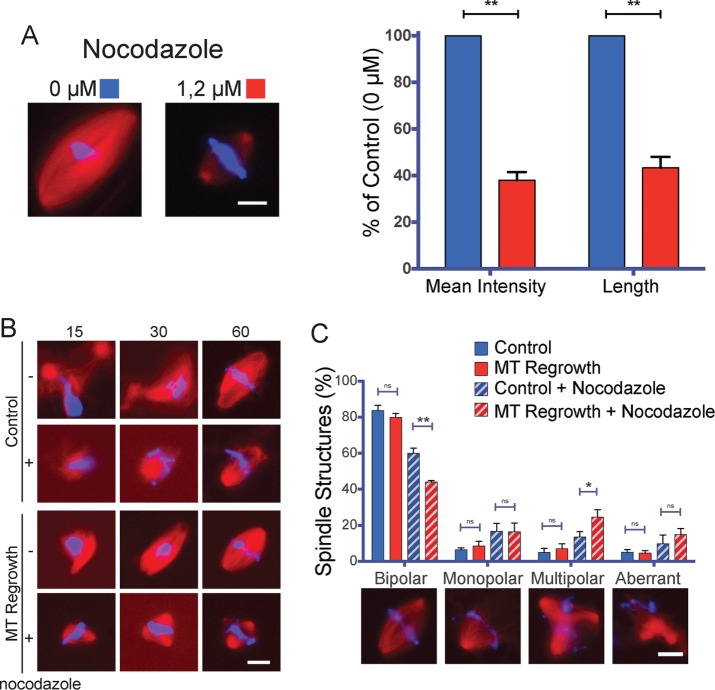
Centrosome maturation is the process by which the duplicated centrosomes recruit pericentriolar components and increase their microtubule nucleation activity before mitosis. The role of this process in cells entering mitosis has been mostly related to the separation of the duplicated centrosomes and thereby to the assembly of a bipolar spindle. However, spindles can form without centrosomes. In fact, all cells, whether they have centrosomes or not, rely on chromatin-driven microtubule assembly to form a spindle. To test whether the sequential activation of these microtubule assembly pathways, defined by centrosome maturation and nuclear envelope breakdown, plays any role in spindle assembly, we combined experiments in tissue culture cells and Xenopus laevis egg extracts with a mathematical model. We found that interfering with the sequential activation of the microtubule assembly pathways compromises bipolar spindle assembly in tissue culture cells but not in X. laevis egg extracts. Our data suggest a novel function for centrosome maturation that determines the contribution of the chromosomal microtubule assembly pathway and favors bipolar spindle formation in most animal cells in which tubulin is in limiting amounts.


Figures

FIGURE 1:
FIGURE 1:
Spindle assembly is compromised in mitotic cells that undergo MT regrowth. (A) Experimental design. Centrosome MTs are in red, chromatin dependent MTs are in green. (B) Images from time-lapse movies of H2B-eGFP/α-tubulin-mRFP HeLa cells undergoing mitosis after nocodazole washout. Top, control cell (MT Regrowth before mitosis). The three bottom rows show arrested mitotic cells going through mitosis after nocodazole washout (MT Regrowth during mitosis). In the two bottom rows, the cells enter anaphase after >5 h with a tripolar and a disorganized spindle. Tubulin is in green and H2B in red. Time is in hours:minutes. Time 0 corresponds to NEBD for the control cell and to nocodazole washout for MT Regrowth cells. Scale bar, 10 μm. (C) Time required for H2B-eGFP/α-tubulin-mRFP HeLa cells to enter anaphase after nocodazole washout. For control cells (MT Regrowth before mitosis), the values correspond to the time from NEBD to anaphase entry. For mitotic cells undergoing MT regrowth (MT Regrowth during mitosis), the values correspond to the time from nocodazole washout to anaphase entry. Box-and-whiskers plot. A total of 185 control cells and 149 MT regrowth cells were analyzed in four independent experiments. ***p < 0.001. (D) Spindle organization at anaphase onset. The proportion of bipolar (light blue), multipolar (gray), and disorganized (red) spindles was quantified for the cells analyzed in C. Mitotic cells undergoing MT regrowth (MT Regrowth) assemble significantly more multipolar and disorganized spindles than control cells (Control; p < 0.05). (E) Spindle organization in mitotic HeLa cells (Control, blue) or HeLa cells undergoing MT regrowth (MT Regrowth, red). Proportion of different spindle organizations 30 min after nocodazole washout or in control cells. MT regrowth cells have significantly fewer bipolar spindles properly oriented and a higher number of tilted and multipolar spindles than control cells. Representative IF images of different spindle organizations are shown below the graph. Data from 847 controls cells and 864 MT regrowth cells from four independent experiments, counting in each at least 200 cells/condition. DNA is in blue, centrin in green, and tubulin in red. Scale bar, 10 μm. Error bars, SEM. *p < 0.05; **p < 0.01.
FIGURE 2:
FIGURE 2:
The spindle assembly defects observed upon nocodazole washout are not directly related to centrosome positioning, whereas they correlate with lower levels of PCM components at the centrosomes. (A) Experimental design of the experiments shown in B. (B) Spindle organization in cells preincubated in DMSO (MT Regrowth Control, blue) or monastrol followed by nocodazole incubation and washout in the absence (MT Regrowth after Monastrol, red) or presence of monastrol (MT Regrowth in Monastrol, cyan). Proportion of different spindle organizations 30 min after nocodazole washout. Representative IF images of different spindle organizations are shown below the graph. Data from 694 control cells, 672 MT regrowth after monastrol cells, and 630 MT regrowth in monastrol cells from three independent experiments, counting in each at least 200 cells/condition. DNA is in blue, centrin in green, and tubulin in red. Scale bar, 10 μm. Error bars, SEM. *p < 0.05; **p < 0.01. (C) Cells undergoing MT regrowth form astral MTs less efficiently. Quantification of the proportion of control cells (dark gray) and MT regrowth–treated cells (light gray) having long astral MTs (Long MTs), short astral MTs (Short MTs), or no detectable astral MT (None). Representative IF images of different spindle organizations are shown below the graph. Data from 854 control cells and 802 MT regrowth cells from four independent experiments, counting in each at least 200 cells/condition. DNA is in blue, centrin in green, and tubulin in red. Scale bar, 10 μm. Error bars, SEM. ***p < 0.001. (D) On MT regrowth, centrosomes recruit less pericentrin. Representative IF images of two spindles assembled in control cells or in MT regrowth–treated cells. DNA is in blue, pericentrin in green, and tubulin in red. The pericentrin staining is reported also in gray scale. Scale bar, 10 μm. (E) On MT regrowth, centrosomes recruit less γ-tubulin. Representative IF images of two spindles assembled in control cells or in MT regrowth–treated cells. DNA is in blue, γ-tubulin in green, and tubulin in red. The γ-tubulin staining is reported also in gray scale. Scale bar, 10 μm. (F) Quantification of the pericentrin and γ-tubulin signal to the mitotic centrosomes of control cells (dark gray) and MT regrowth–treated cells (light gray). The signals of both proteins are significantly reduced in MT regrowth–treated cells. Data from 370 cells for pericentrin control, 371 cells for pericentrin MT regrowth, 371 cells for γ-tubulin control, and 363 cells for γ-tubulin MT regrowth from six independent experiments, counting in each at least 50 cells/condition. Error bars, SEM. *p < 0.05; ****p < 0.0001.
FIGURE 3:
FIGURE 3:
The MT assembly pathway activities are interdependent. (A) Tubulin signal on the mitotic centrosomes 1 min, 30 s after nocodazole washout in mitotic cells silenced using a scrambled siRNA (siCTRL, blue) or a TPX2 siRNA (siTPX2, red). Box-and-whiskers plot showing the intensity of the tubulin signal associated with the mitotic centrosome expressed as percentage of the average of the control. Representative IF images of siCTRL and siTPX2 are shown below the graph. DNA is in blue, centrin in green, and tubulin in red. Data from 205 siCTRL cells and 196 siTPX2 cells from four independent experiments, counting in each at least 40 cells/condition. To pool experiments, in each experiment, the mean tubulin signal of the control condition was considered as 100%. ****p < 0.0001. Scale bar, 10 μm. (B) Experimental design of the MT regrowth performed in Plk1-inhibited cells. (C) Number of MT asters generated 3 min after nocodazole washout in cells treated with DMSO (blue) or BI-2536 (Plk1i, green) as in B. Box-and-whiskers plot showing number of MT asters counted in each condition. Representative IF images of DMSO and Plk1i cells are shown below the graph. DNA is in blue, pericentrin in green, and tubulin in red. Data from 339 DMSO cells and 346 Plk1i cells from three independent experiments counting in each at least 100 cells/condition. ****p < 0.0001. Scale bar, 10 μm. (D) Percentage of the theoretical ratio of tubulin incorporated into centrosomal MTs (WC) to the total tubulin that will constitute the spindle MTs (WS), depending on cell diameter. Three theoretical levels of centrosome maturation (defined as number of MTs nucleated by the centrosomes) were modeled: 250, 500, and 750 MTs per centrosome with average MT length of 3 μm (respectively, black, blue, and orange curves). As the cell size increases, centrosomes use proportionally less of the total tubulin available for the spindle MTs. For cell diameters within 10–30 μm, altering the level of centrosome maturation has a dramatic consequence on the availability of tubulin for the chromosomal pathway. Most dividing animal cells are in this range (Milo and Phillips, 2015), and thus the model suggests that centrosome maturation at NEBD may be a tightly controlled process.
FIGURE 4:
FIGURE 4:
MT regrowth does not impair spindle assembly in X. laevis egg extracts. (A) Schematic representation of spindle assembly in cycled Xenopus egg extract (Control) and upon MT regrowth after cold treatment (MT Regrowth). Time is in minutes. (B) Representative images of mitotic structures assembled in Xenopus egg extracts in control conditions and after cold-induced MT depolymerization (MT Regrowth) at the indicated times (in minutes) as shown in A. At 60 min, bipolar spindles assemble in both conditions. DNA is in blue and tubulin in red. Scale bar, 10 μm. (C) Control and MT regrowth extracts assemble spindles with similar efficiency. Spindle organization in control egg extracts (blue) or cold-treated egg extracts (MT Regrowth, red). Proportion of spindle organizations after 60 min of incubation. Representative images are shown below the graph. Data from 321 control structures and 312 MT regrowth structures from three independent experiments, counting in each at least 100 mitotic structures/condition. Error bars, SEM. DNA is in blue and tubulin in red. Scale bar, 10 μm. No statistically significant difference was detected between conditions.
FIGURE 5:
FIGURE 5:
Reduced tubulin amounts impair spindle assembly in X. laevis egg extracts undergoing MT regrowth. (A) Spindles assembled in the presence of 1.2 μM nocodazole are shorter and have reduced tubulin density. Left, representative images of spindles assemble in control extract (0 μM, blue) and nocodazole-treated extract (1.2 μM, red). Right, mean tubulin density and mean spindle length as percentage of control (0 μM). Data from 172 control and 158 nocodazole-treated spindles from three independent experiments, quantifying in each at least 50 spindles/condition. DNA is in blue and tubulin in red. Scale bar, 10 μm. **p < 0.01. (B) Representative images of mitotic structures assembled in Xenopus egg extracts treated or not with 1.2 μM nocodazole in control (Control) conditions and after cold-induced MT depolymerization (MT Regrowth) at the indicated times (in minutes), treated as shown in Figure 5A. At 60 min, bipolar spindles assemble in all conditions but with different efficiencies. DNA is in blue and tubulin in red. Scale bar, 10 μm. (C) MT regrowth compromises spindle assembly only in extracts treated with nocodazole. Spindle organization in control egg extracts (blue) or cold-treated egg extracts (MT Regrowth red), treated (diagonal lines pattern) or not (no pattern) with 1.2 μM nocodazole as indicated. Proportion of spindle organizations after 60 min of incubation. Representative images are shown below the graph. Data from 479 control structures, 648 MT regrowth structures, 706 control in the presence of nocodazole, and 778 MT regrowth in the presence of nocodazole structures from four independent experiments, counting in each at least 100 mitotic structures/condition. Error bars: SEM. DNA is in blue and tubulin in red. Scale bar, 10 μm. *p < 0.05 and **p < 0.01.

References

    1. Andersen SS. Spindle assembly and the art of regulating microtubule dynamics by MAPs and Stathmin/Op18. Trends Cell Biol. 2000;10:261–267. - PubMed
    1. Burke TA, Christensen JR, Barone E, Suarez C, Sirotkin V, Kovar DR. Homeostatic actin cytoskeleton networks are regulated by assembly factor competition for monomers. Curr Biol. 2014;24:579-585. - PMC - PubMed
    1. Cai S, O’Connell C, Khodjakov AL, Walczak CE. Chromosome congression in the absence of kinetochore fibres. Nat Cell Biol. 2009;11:832–838. - PMC - PubMed
    1. Cimini D, Howell B, Maddox P, Khodjakov A, Degrassi F, Salmon ED. Merotelic kinetochore orientation is a major mechanism of aneuploidy in mitotic mammalian tissue cells. J Cell Biol. 2001;153:517–527. - PMC - PubMed
    1. Collins ES, Balchand SK, Faraci JL, Wadsworth P, Lee WL. Cell cycle-regulated cortical dynein/dynactin promotes symmetric cell division by differential pole motion in anaphase. Mol Biol Cell. 2012;23:3380–3390. - PMC - PubMed

Publication types

LinkOut - more resources