

Responses of non-eye-movement central vestibular neurons to sinusoidal yaw rotation in compensated macaques after unilateral semicircular canal plugging
- PMID: 27489364
- PMCID: PMC5144719
- DOI: 10.1152/jn.00212.2016
Responses of non-eye-movement central vestibular neurons to sinusoidal yaw rotation in compensated macaques after unilateral semicircular canal plugging
Abstract
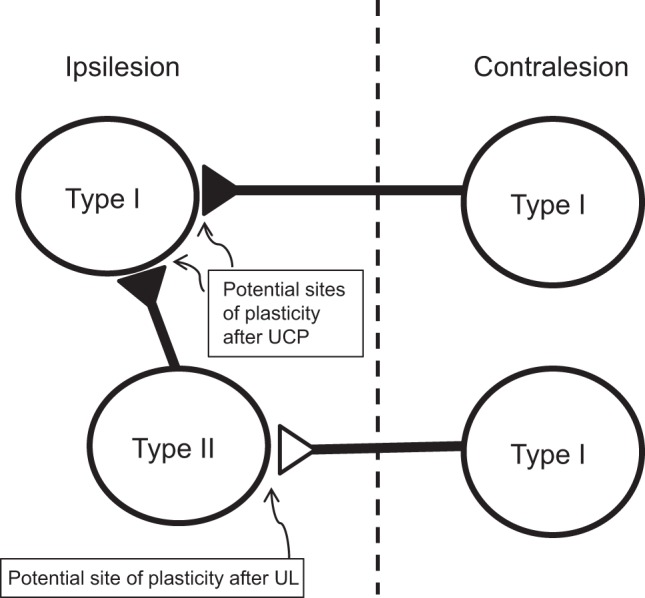
After vestibular labyrinth injury, behavioral measures of vestibular performance recover to variable degrees (vestibular compensation). Central neuronal responses after unilateral labyrinthectomy (UL), which eliminates both afferent resting activity and sensitivity to movement, have been well-studied. However, unilateral semicircular canal plugging (UCP), which attenuates angular-velocity detection while leaving afferent resting activity intact, has not been extensively studied. The current study reports response properties of yaw-sensitive non-eye-movement rhesus macaque vestibular neurons after compensation from UCP. The responses at a series of frequencies (0.1-2 Hz) and peak velocities (15-210°/s) were compared between neurons recorded before and at least 6 wk after UCP. The gain (sp/s/°/s) of central type I neurons (responding to ipsilateral yaw rotation) on the side of UCP was reduced relative to normal controls at 0.5 Hz, ±60°/s [0.48 ± 0.30 (SD) normal, 0.32 ± 0.15 ipsilesion; 0.44 ± 0.2 contralesion]. Type II neurons (responding to contralateral yaw rotation) after UCP have reduced gain (0.40 ± 0.27 normal, 0.35 ± 0.25 ipsilesion; 0.25 ± 0.18 contralesion). The difference between responses after UCP and after UL is primarily the distribution of type I and type II neurons in the vestibular nuclei (type I neurons comprise 66% in vestibular nuclei normally; 51% ipsilesion UCP; 59% contralesion UCP; 38% ipsilesion UL; 65% contralesion UL) and the magnitude of the responses of type II neurons ipsilateral to the lesion. These differences suggest that the need to compensate for unilateral loss of resting vestibular nerve activity after UL necessitates a different strategy for recovery of dynamic vestibular responses compared to after UCP.
Keywords: brainstem; threshold; vestibular nucleus.
Copyright © 2016 the American Physiological Society.
Figures


Similar articles
-
Responses of central vestibular neurons to sinusoidal yaw rotation in compensated macaques after unilateral labyrinthectomy.J Neurophysiol. 2013 Oct;110(8):1822-36. doi: 10.1152/jn.00365.2013. Epub 2013 Jul 17. J Neurophysiol. 2013. PMID: 23864379 Free PMC article.
-
Relationship of static and dynamic mechanisms in vestibuloocular reflex compensation.Laryngoscope. 2005 Feb;115(2):191-204. doi: 10.1097/01.mlg.0000154718.80594.2e. Laryngoscope. 2005. PMID: 15689735
-
Responses of non-eye movement central vestibular neurons to sinusoidal horizontal translation in compensated macaques after unilateral labyrinthectomy.J Neurophysiol. 2014 Jul 1;112(1):9-21. doi: 10.1152/jn.00748.2013. Epub 2014 Apr 9. J Neurophysiol. 2014. PMID: 24717349 Free PMC article.
-
Otolith and canal integration on single vestibular neurons in cats.Exp Brain Res. 2005 Jul;164(3):271-85. doi: 10.1007/s00221-005-2341-7. Epub 2005 Jul 1. Exp Brain Res. 2005. PMID: 15991028 Review.
-
Mechanisms of recovery following unilateral labyrinthectomy: a review.Brain Res Brain Res Rev. 1989 Apr-Jun;14(2):155-80. doi: 10.1016/0165-0173(89)90013-1. Brain Res Brain Res Rev. 1989. PMID: 2665890 Review.
References
-
- Abend WK. Functional organization of the superior vestibular nucleus of the squirrel monkey. Brain Res 132: 65–84, 1977. - PubMed
-
- Abend WK. Response to constant angular accelerations of neurons in the monkey superior vestibular nucleus. Exp Brain Res 31: 459–473, 1978. - PubMed
-
- Böhmer A, Henn V, Suzuki J. Vestibulo-ocular reflexes after selective plugging of the semicircular canals in the monkey–response plane determinations. Brain Res 326: 291–298, 1985. - PubMed
-
- Boyle R. Activity of medial vestibulospinal tract cells during rotation and ocular movement in the alert squirrel monkey. J Neurophysiol 70: 2176–2180, 1993. - PubMed
Publication types
MeSH terms
Grants and funding
LinkOut - more resources
Full Text Sources
Other Literature Sources
Medical