

Intra-Animal Comparison between Three-dimensional Molecularly Targeted US and Three-dimensional Dynamic Contrast-enhanced US for Early Antiangiogenic Treatment Assessment in Colon Cancer
- PMID: 27490690
- PMCID: PMC5283869
- DOI: 10.1148/radiol.2016160032
Intra-Animal Comparison between Three-dimensional Molecularly Targeted US and Three-dimensional Dynamic Contrast-enhanced US for Early Antiangiogenic Treatment Assessment in Colon Cancer
Abstract
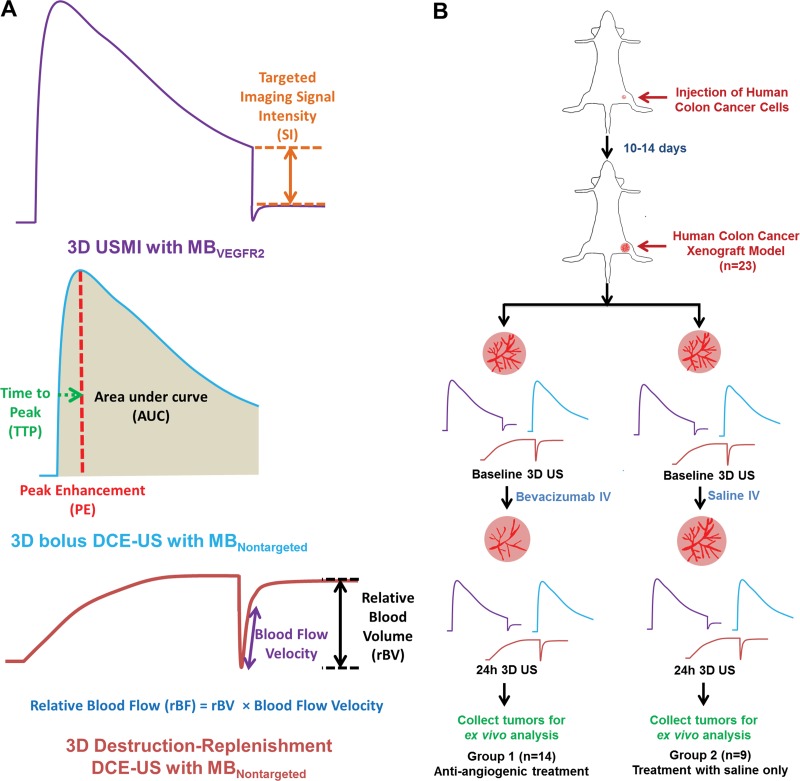
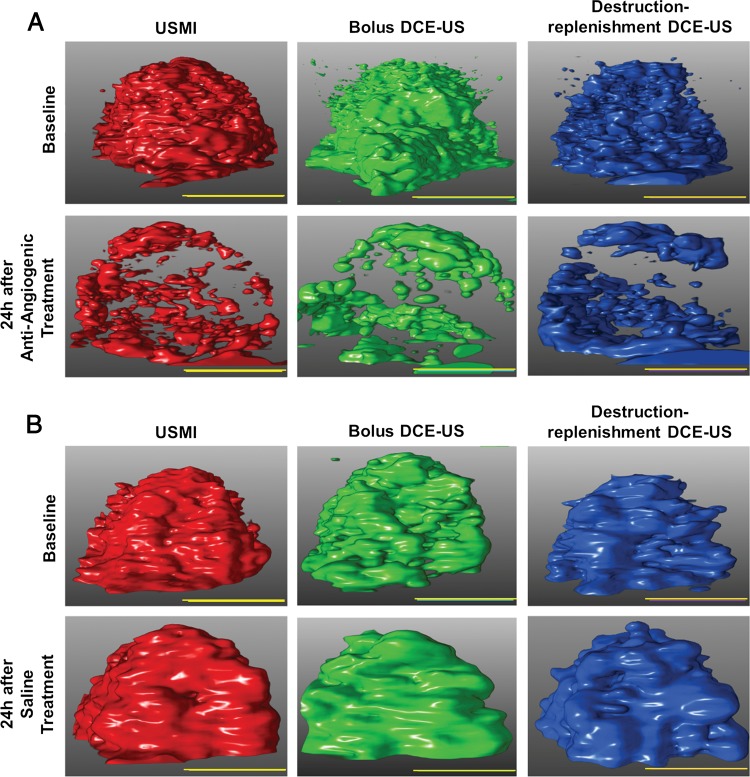
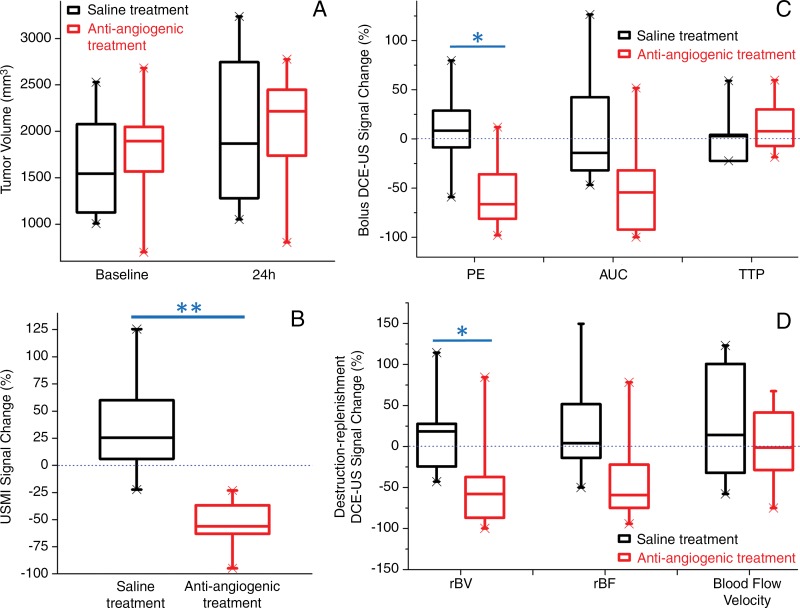
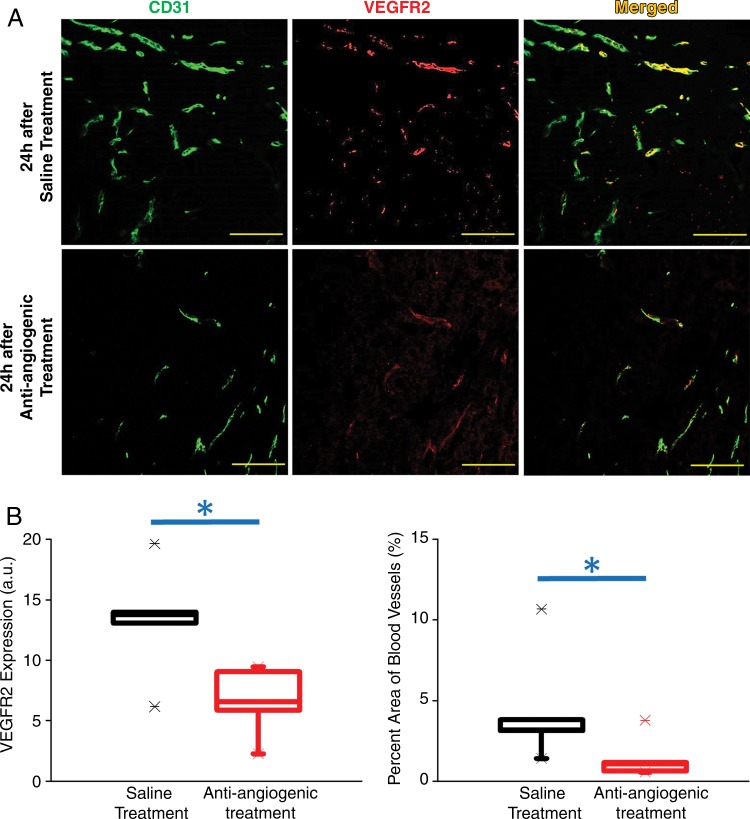
Purpose To perform an intra-animal comparison between (a) three-dimensional (3D) molecularly targeted ultrasonography (US) by using clinical-grade vascular endothelial growth factor receptor 2 (VEGFR2)-targeted microbubbles and (b) 3D dynamic contrast material-enhanced (DCE) US by using nontargeted microbubbles for assessment of antiangiogenic treatment effects in a murine model of human colon cancer. Materials and Methods Twenty-three mice with human colon cancer xenografts were randomized to receive either single-dose antiangiogenic treatment (bevacizumab, n = 14) or control treatment (saline, n = 9). At baseline and 24 hours after treatment, animals were imaged with a clinical US system equipped with a clinical matrix array transducer by using the following techniques: (a) molecularly targeted US with VEGFR2-targeted microbubbles, (b) bolus DCE US with nontargeted microbubbles, and (c) destruction-replenishment DCE US with nontargeted microbubbles. VEGFR2-targeted US signal, peak enhancement, area under the time-intensity curve, time to peak, relative blood volume (rBV), relative blood flow, and blood flow velocity were quantified. VEGFR2 expression and percentage area of blood vessels were assessed ex vivo with quantitative immunofluorescence and correlated with corresponding in vivo US parameters. Statistical analysis was performed with Wilcoxon signed rank tests and rank sum tests, as well as Pearson correlation analysis. Results Molecularly targeted US signal with VEGFR2-targeted microbubbles, peak enhancement, and rBV significantly decreased (P ≤ .03) after a single antiangiogenic treatment compared with those in the control group; similarly, ex vivo VEGFR2 expression (P = .03) and percentage area of blood vessels (P = .03) significantly decreased after antiangiogenic treatment. Three-dimensional molecularly targeted US signal correlated well with VEGFR2 expression (r = 0.86, P = .001), and rBV (r = 0.71, P = .01) and relative blood flow (r = 0.78, P = .005) correlated well with percentage area of blood vessels, while other US perfusion parameters did not. Conclusion Three-dimensional molecularly targeted US and destruction-replenishment 3D DCE US provide complementary molecular and functional in vivo imaging information on antiangiogenic treatment effects in human colon cancer xenografts compared with ex vivo reference standards. © RSNA, 2016 Online supplemental material is available for this article.
Conflict of interest statement
of Conflicts of Interest: H.W. disclosed no relevant relationships. A.M.L. disclosed no relevant relationships. D.H. disclosed no relevant relationships. L.T. disclosed no relevant relationships. J.K.W. Activities related to the present article: disclosed no relevant relationships. Activities not related to the present article: author received payment from Bracco for consulting; author received a grant from Philips. Other relationships: disclosed no relevant relationships.
Figures
Similar articles
-
Three-dimensional Dynamic Contrast-enhanced US Imaging for Early Antiangiogenic Treatment Assessment in a Mouse Colon Cancer Model.Radiology. 2015 Nov;277(2):424-34. doi: 10.1148/radiol.2015142824. Epub 2015 May 22. Radiology. 2015. PMID: 26020439 Free PMC article.
-
Three-dimensional ultrasound molecular imaging of angiogenesis in colon cancer using a clinical matrix array ultrasound transducer.Invest Radiol. 2015 May;50(5):322-9. doi: 10.1097/RLI.0000000000000128. Invest Radiol. 2015. PMID: 25575176 Free PMC article.
-
Contrast-Enhanced Ultrasound with VEGFR2-Targeted Microbubbles for Monitoring Regorafenib Therapy Effects in Experimental Colorectal Adenocarcinomas in Rats with DCE-MRI and Immunohistochemical Validation.PLoS One. 2017 Jan 6;12(1):e0169323. doi: 10.1371/journal.pone.0169323. eCollection 2017. PLoS One. 2017. PMID: 28060884 Free PMC article.
-
[Imaging and angiogenesis: DCE-US (dynamic contrast enhanced-ultrasonography)].Bull Cancer. 2007 Jul;94 Spec No:S247-53. Bull Cancer. 2007. PMID: 17846011 Review. French.
-
Dynamic contrast-enhanced ultrasonography (DCE-US) with quantification of tumor perfusion: a new diagnostic tool to evaluate the early effects of antiangiogenic treatment.Eur Radiol. 2007 Dec;17 Suppl 6:F89-98. doi: 10.1007/s10406-007-0233-6. Eur Radiol. 2007. PMID: 18376462 Review.
Cited by
-
Bursting Microbubbles: How Nanobubble Contrast Agents Can Enable the Future of Medical Ultrasound Molecular Imaging and Image-Guided Therapy.Curr Opin Colloid Interface Sci. 2021 Aug;54:101463. doi: 10.1016/j.cocis.2021.101463. Epub 2021 May 2. Curr Opin Colloid Interface Sci. 2021. PMID: 34393610 Free PMC article.
-
Characterization of spatially mapped volumetric molecular ultrasound signals for predicting response to anti-vascular therapy.Sci Rep. 2023 Jan 30;13(1):1686. doi: 10.1038/s41598-022-26273-0. Sci Rep. 2023. PMID: 36717575 Free PMC article.
-
Quantifying Molecular Changes in the Preeclamptic Rat Placenta with Targeted Contrast-Enhanced Ultrasound Imaging.Mol Imaging Biol. 2025 Apr;27(2):274-284. doi: 10.1007/s11307-025-01988-4. Epub 2025 Feb 27. Mol Imaging Biol. 2025. PMID: 40014198 Free PMC article.
-
A new preclinical ultrasound platform for widefield 3D imaging of rodents.Rev Sci Instrum. 2018 Jul;89(7):075107. doi: 10.1063/1.5026430. Rev Sci Instrum. 2018. PMID: 30068108 Free PMC article.
-
68Ga-TRAP-(RGD)3 Hybrid Imaging for the In Vivo Monitoring of αvß3-Integrin Expression as Biomarker of Anti-Angiogenic Therapy Effects in Experimental Breast Cancer.PLoS One. 2016 Dec 19;11(12):e0168248. doi: 10.1371/journal.pone.0168248. eCollection 2016. PLoS One. 2016. PMID: 27992512 Free PMC article.
References
-
- American Cancer Society . Cancer facts & figures. Atlanta, Ga: American Cancer Society. 2015.
-
- Bennouna J, Sastre J, Arnold D, et al. . Continuation of bevacizumab after first progression in metastatic colorectal cancer (ML18147): a randomised phase 3 trial. Lancet Oncol 2013;14(1):29–37. - PubMed
-
- Wilson SR, Burns PN. Microbubble-enhanced US in body imaging: what role? Radiology 2010;257(1):24–39. - PubMed
-
- Williams R, Hudson JM, Lloyd BA, et al. . Dynamic microbubble contrast-enhanced US to measure tumor response to targeted therapy: a proposed clinical protocol with results from renal cell carcinoma patients receiving antiangiogenic therapy. Radiology 2011;260(2):581–590. - PubMed
Publication types
MeSH terms
Substances
Grants and funding
LinkOut - more resources
Full Text Sources
Other Literature Sources
