. 2016 Aug 4;12(8):e1006236.
doi: 10.1371/journal.pgen.1006236. eCollection 2016 Aug.

Interaction with PALB2 Is Essential for Maintenance of Genomic Integrity by BRCA2

Affiliations

Interaction with PALB2 Is Essential for Maintenance of Genomic Integrity by BRCA2

Suzanne A Hartford et al. PLoS Genet. .

Abstract

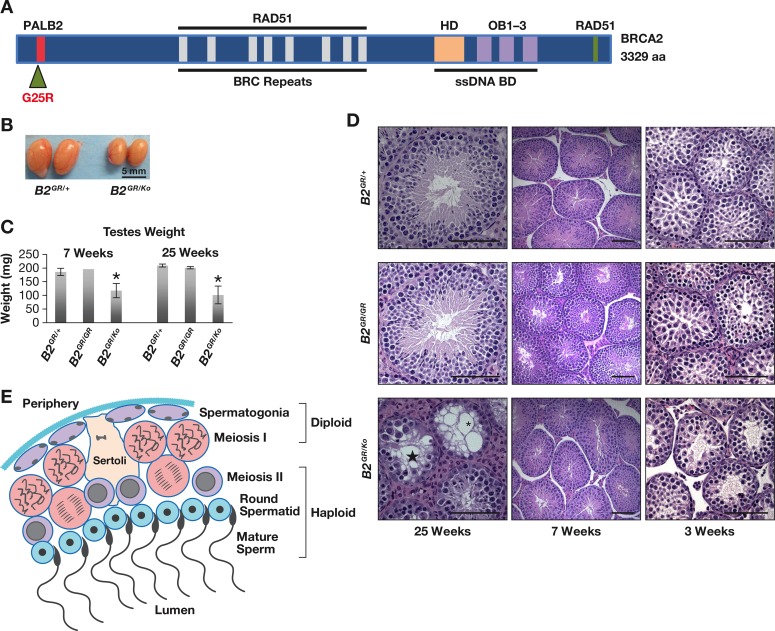
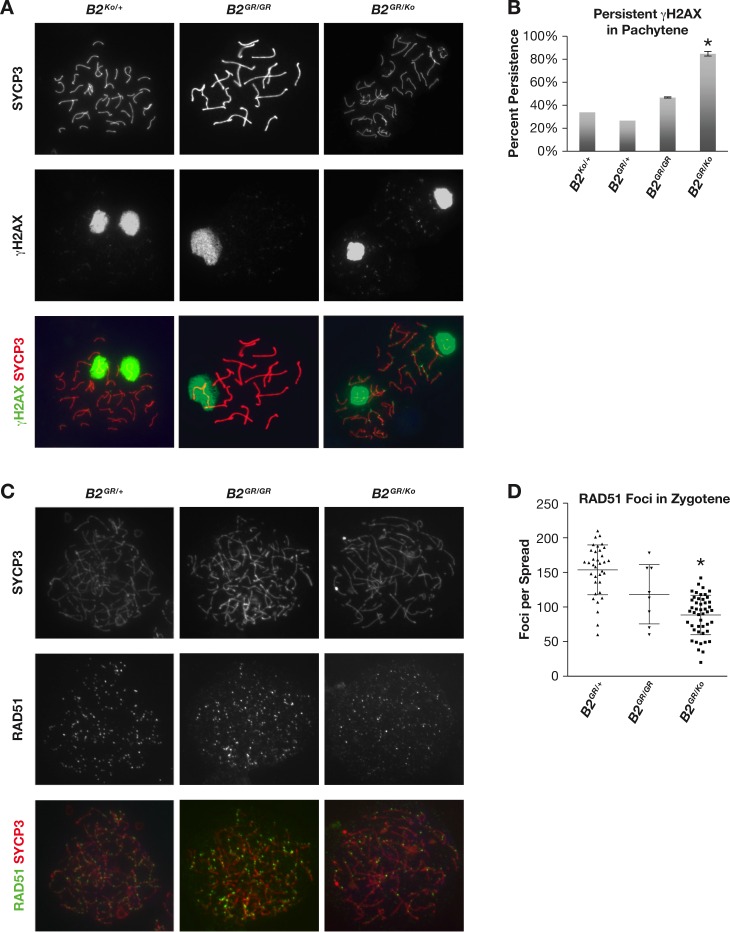
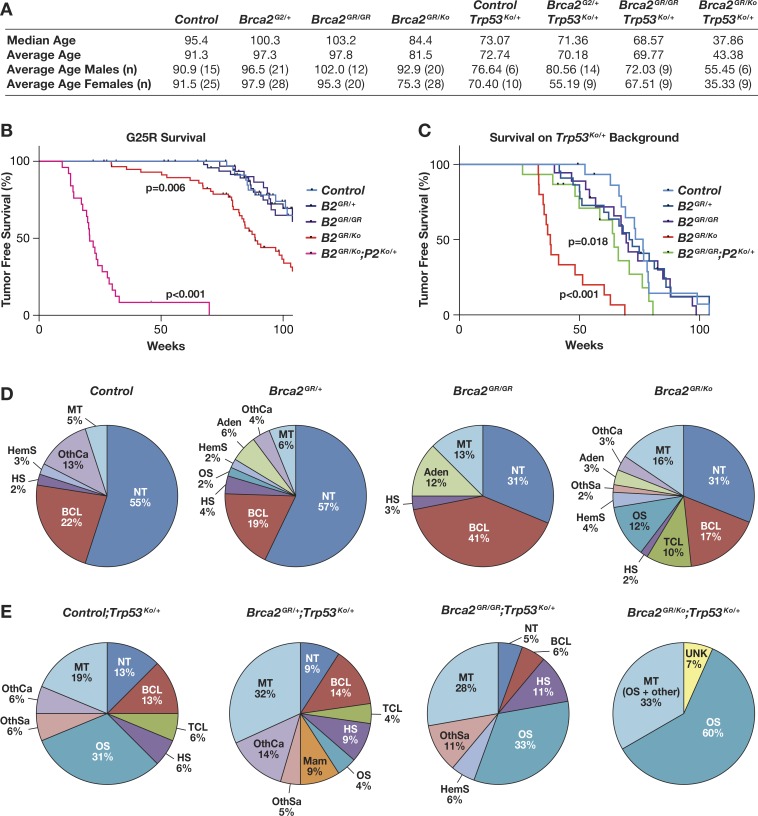
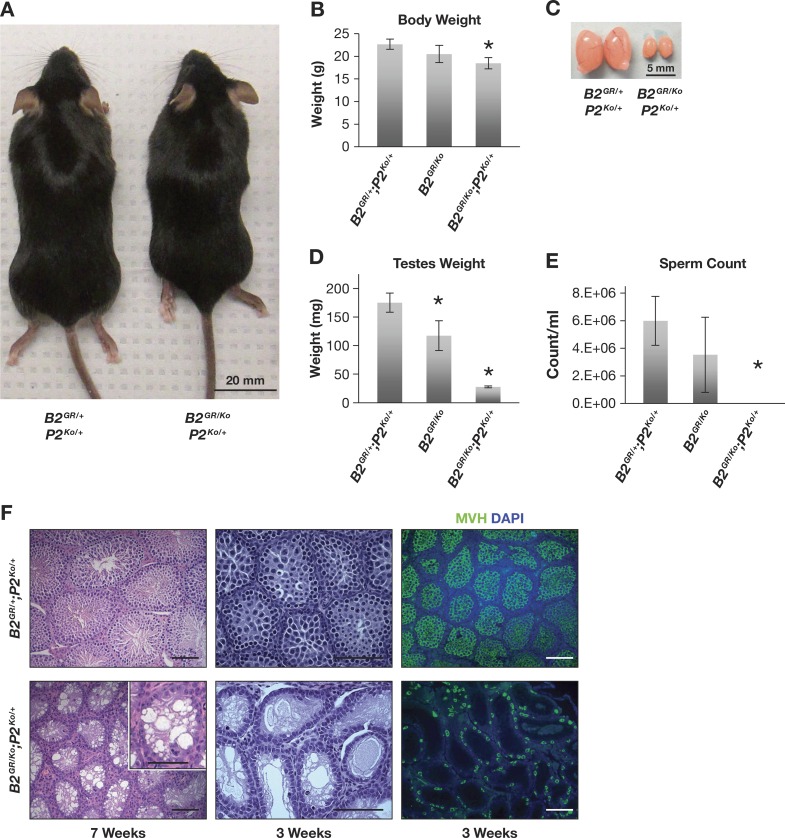
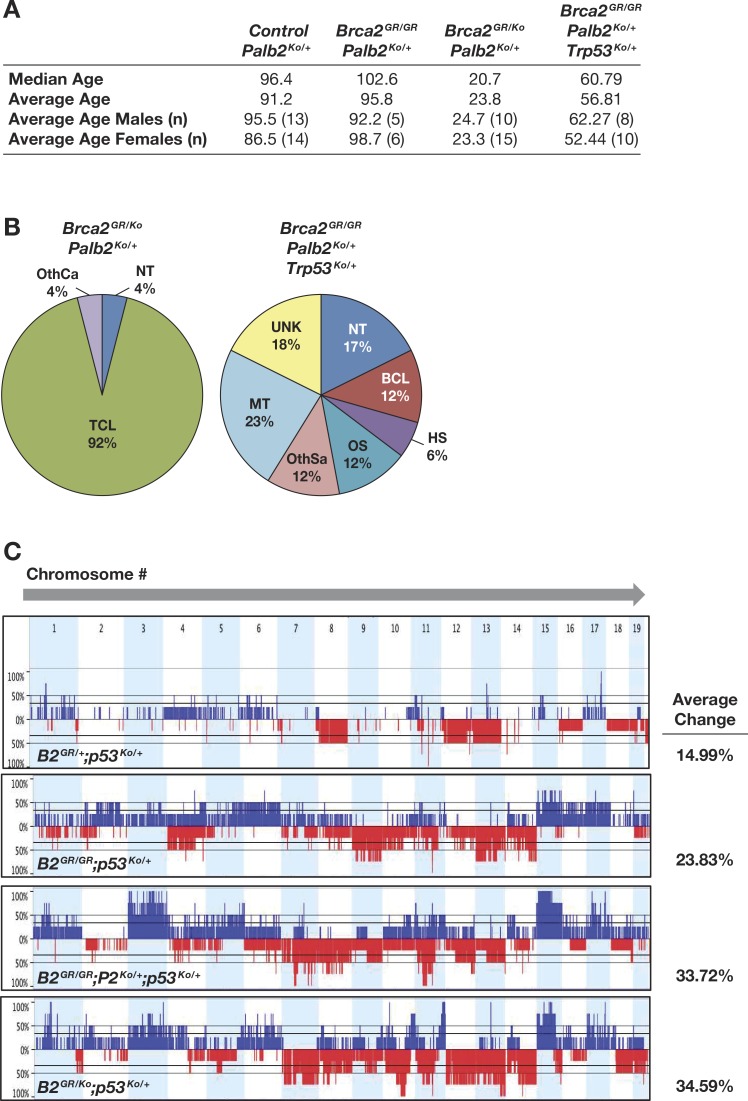
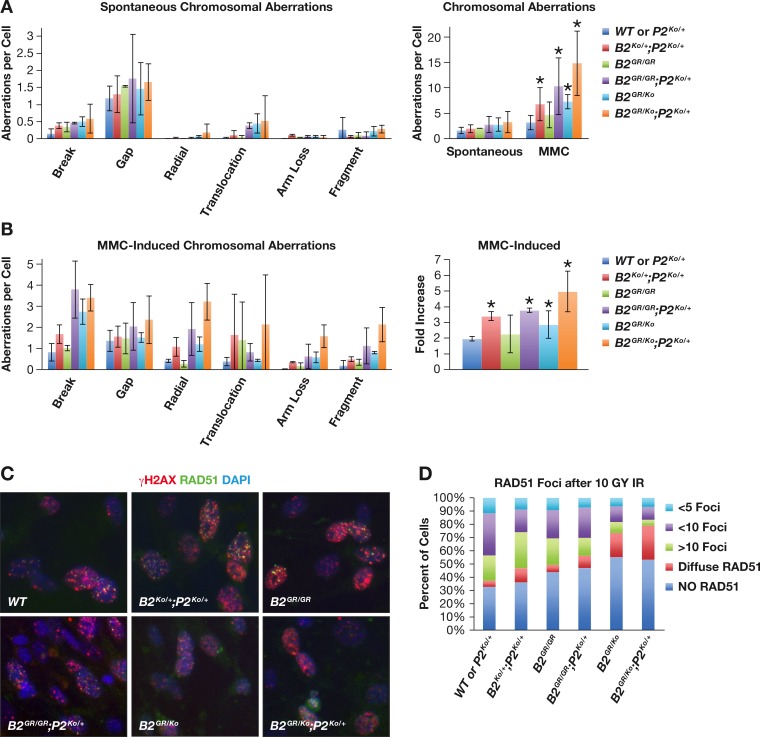
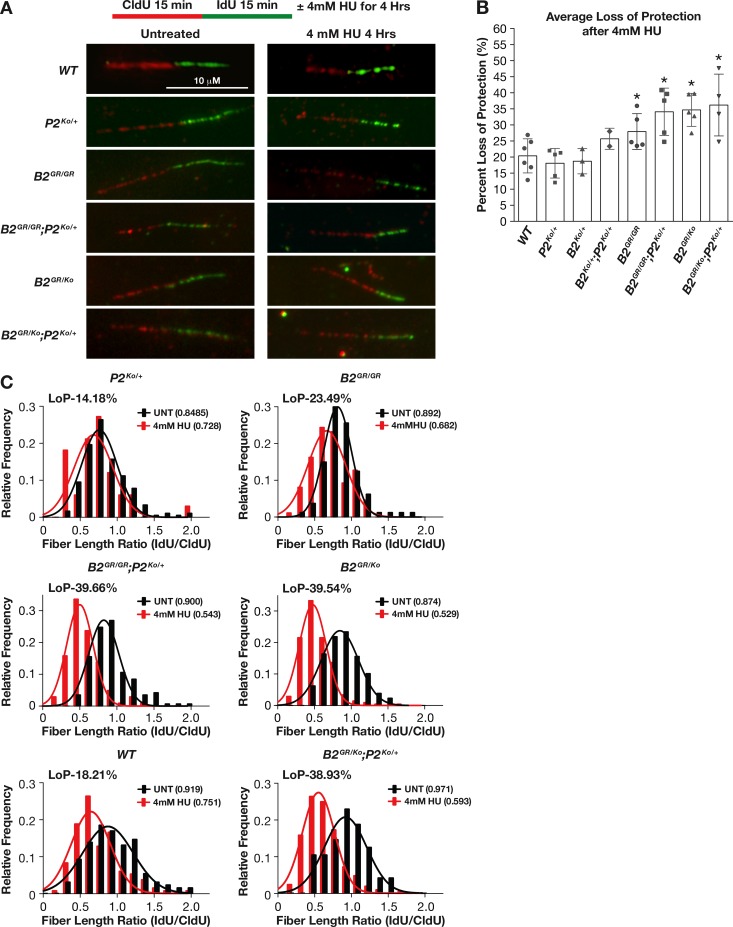
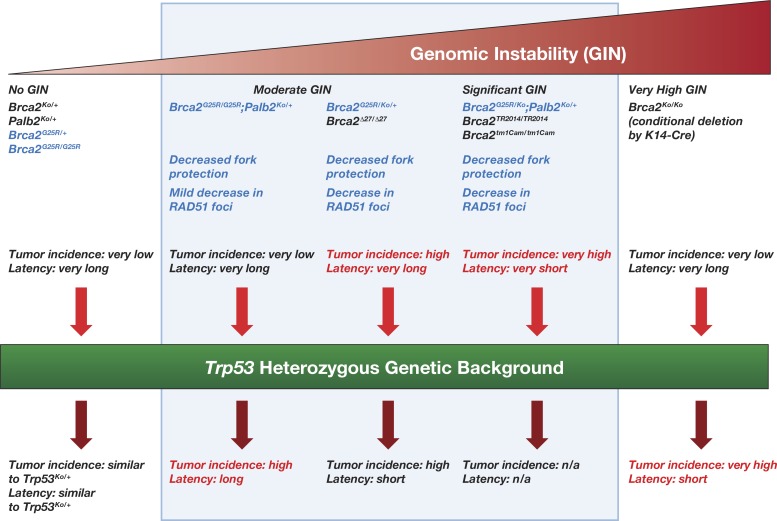
Human breast cancer susceptibility gene, BRCA2, encodes a 3418-amino acid protein that is essential for maintaining genomic integrity. Among the proteins that physically interact with BRCA2, Partner and Localizer of BRCA2 (PALB2), which binds to the N-terminal region of BRCA2, is vital for its function by facilitating its subnuclear localization. A functional redundancy has been reported between this N-terminal PALB2-binding domain and the C-terminal DNA-binding domain of BRCA2, which undermines the relevance of the interaction between these two proteins. Here, we describe a genetic approach to examine the functional significance of the interaction between BRCA2 and PALB2 by generating a knock-in mouse model of Brca2 carrying a single amino acid change (Gly25Arg, Brca2G25R) that disrupts this interaction. In addition, we have combined Brca2G25R homozygosity as well as hemizygosity with Palb2 and Trp53 heterozygosity to generate an array of genotypically and phenotypically distinct mouse models. Our findings reveal defects in body size, fertility, meiotic progression, and genome stability, as well as increased tumor susceptibility in these mice. The severity of the phenotype increased with a decrease in the interaction between BRCA2 and PALB2, highlighting the significance of this interaction. In addition, our findings also demonstrate that hypomorphic mutations such as Brca2G25R have the potential to be more detrimental than the functionally null alleles by increasing genomic instability to a level that induces tumorigenesis, rather than apoptosis.


Conflict of interest statement

The authors have declared that no competing interests exist.

Figures

Fig 1
Fig 1. Brca2G25R/Ko mutant males have decreased fertility.
A. Structural and functional domains of murine BRCA2 consisting of 3329 amino acids with the N-terminal PALB2 binding domain (red), BRC repeats (gray) in the middle, helical domain (HD, orange), oligonucleotide binding (OB) regions 1–3 (purple), and a C-terminal RAD51 binding domain (green). Single-strand DNA binding domain (ssDNA, line). The dark green triangle marks the location of the G25R mutation. B. Representative images of mouse testes of indicated genotype (B2GR/+, left and B2GR/Ko, right) at 25 weeks of age. C. Average paired testes weight (mg) of the listed genotypes at 7 weeks and 25 weeks, error bars indicate SD. * p<0.05. D. Representative H&E stained histology of testes of the indicated genotypes (B2GR/+, upper, B2GR/GR, middle, and B2GR/Ko, lower) at 25 weeks (tubules lacking germ cells (*), and tubules arrest at meiosis (star), 7 weeks with normal spermatogenesis, and 3 weeks, with reduced haploid cells in B2GR/Ko testis sections. E. Cartoon of a portion of mouse adult seminiferous tubule cross-section showing spermatozoa at various developmental stages from periphery (top) to lumen (bottom). Scale Bar = 100 μM. Controls are represented by either: Brca2+/+, Brca2Ko/+, or Brca2G25R/+. Abbreviations: Brca2G25R/+ = B2GR/+, Brca2G25R/G25R = B2GR/GR, Brca2G25R/Ko = B2GR/Ko.
Fig 2
Fig 2. Brca2G25R/Ko decreased testis size due to persistent DSBs and decreased localization of RAD51 in meiocytes.
A. Representative images of pachytene meiocytes of (B2Ko/+, left, B2GR/GR, center, and B2GR/Ko, right) stained with SYCP3 (top, red), γH2AX (middle, green), and merged (bottom). B. Quantification of cells containing persistent γH2AX staining in pachynema. C. Representative images of zygotene meiocytes of (B2GR/+, left, B2GR/GR, center, and B2GR/Ko, right) stained with SYCP3 (top, red), RAD51 (middle, green), and merged (bottom). D. Quantification of RAD51 foci along SYCP3 stained meiotic cores at zygonema. Error bars: SD, * p<0.05. Controls are represented by either: Brca2+/+, Brca2Ko/+, or Brca2G25R/+. Abbreviations: Brca2Ko/+ = B2Ko/+, Brca2G25R/+ = B2GR/+, Brca2G25R/G25R = B2GR/GR, Brca2G25R/Ko = B2GR/Ko.
Fig 3
Fig 3. Increased tumor predisposition in Brca2G25R hemizygous mice.
A. Median and average age of death, including number of mice per genotype analyzed (n) and shown by gender. B. Kaplan-Meier tumor-free survival curves of Brca2 mutant animals (104 week study). C. Kaplan-Meier tumor-free survival curves of Brca2 mutant mice on a Trp53Ko/+ genetic background (104 week study). D. and E. Distribution of tumor types found in mice of indicated genotypes. Abbreviations: NT = No tumor observed, BCL = B-cell lymphoma, TCL = T-cell lymphoma, HS = Histiocytic sarcoma, OS = Osteosarcoma, HemS = Hemangiosarcoma, OthSa = Other sarcomas, AD = Adenomas, OthCa = Other carcinomas, MT = Multiple tumors, UNK = cause of death unknown. * UNK are included in the tumor-free survival curves as potential neoplasias. Controls are represented by: Brca2+/+ and Brca2Ko/+. Abbreviations: Brca2Ko/+ = B2Ko/+, Brca2G25R/+ = B2GR/+, Brca2G25R/G25R = B2GR/GR, Brca2G25R/Ko = B2GR/Ko.
Fig 4
Fig 4. Synergistic interaction between Brca2G25R mutation and Palb2 heterozygosity.
A. Image of decreased body size in B2GR/Ko;P2Ko/+ animals (right) compared to littermate controls (left). B. Average body weight of mice of indicated genotypes at 7 weeks. C. Seven-week old testes of B2GR/Ko;P2Ko/+ animals (right) are smaller compared to littermate controls (left). D. Average weight of testes of indicated genotypes at 7 weeks. E. Average sperm count of mice of indicated genotypes at 7 weeks. F. Representative images of testes sections from B2GR/+;P2Ko/+ (upper) and B2GR/Ko;P2Ko/+ (lower) animals. Left panel: 7 week H&E images, notice loss of germ cells in seminiferous tubules. Middle Panel: 3 week H&E stained images. Right panel: 3 week testis sections stained with MVH (green) and DAPI (blue) to visualize the germ cells. Controls are represented by either: Brca2+/+, Brca2Ko/+, or Brca2G25R/+ (with or without Palb2Ko/+). Abbreviations: Brca2G25R/+ = B2GR/+, Brca2G25R/Ko = B2GR/Ko, Palb2Ko/+ = P2Ko/+.
Fig 5
Fig 5. Increased tumor formation in Brca2G25R mice in a Palb2Ko/+ genetic background.
A. Median and average age of mice, including the number of animals for each genotype. B. Distribution of tumors found in the of B2GR/Ko;P2Ko/+ and B2GR/GR;P2Ko/+ mutant mice. Tumor abbreviations: NT = No tumor observed, BCL = B-cell lymphoma, TCL = T-cell lymphoma, HS = Histiocytic sarcoma, OS = Osteosarcoma, HemS = Hemangiosarcoma, OthSa = Other sarcomas, AD = Adenomas, OthCa = Other carcinomas, MT = Multiple tumors, UNK = cause of death unknown. C. Array CGH analysis of tumors from mice of indicated genotypes. These show the percentage of any known copy number variation within all tumors of the given genotype. Numbers at the top indicate the chromosome numbers. Blue lines represent gains and red lines represent losses. Controls are represented by either: Brca2+/+, Brca2Ko/+, or Brca2G25R/+ (with or without Palb2Ko/+ and/or Trp53Ko/+). Abbreviations: Brca2G25R/+ = B2GR/+, Brca2G25R/G25R = B2GR/GR, Brca2G25R/Ko = B2GR/Ko, Palb2Ko/+ = P2Ko/+, Trp53Ko/+ = p53Ko/+.
Fig 6
Fig 6. Brca2G25R contributes to genomic instability and affects RAD51 foci formation.
A. Spontaneous chromosomal aberrations seen in MEFs of various genotypes (left) and total chromosomal aberrations seen in untreated and 100nM MMC treated MEFs (right). B. Chromosomal aberrations seen with in MEFS of various genotypes treated with 100nM MMC (left) and fold increase in aberrations seen after 100nM MMC treatment (right). Error Bars: SD, * p<0.05 C. Representative images of RAD51 and γH2Ax foci formation after irradiation in primary MEFs of various genotypes. D. Quantification of RAD51 foci seen in cells that also have γH2AX foci. Controls are represented by: Brca2+/+ (with or without Palb2Ko/+). Abbreviations: Brca2+/+ = WT, Brca2Ko/+ = B2Ko/+, Brca2G25R/G25R = B2GR/GR, Brca2G25R/Ko = B2GR/Ko, Palb2Ko/+ = P2Ko/+.
Fig 7
Fig 7. Brca2G25R mutation affects protection of stalled replication forks.
A. Representative images of the fork protection assay in primary MEFs of indicated genotypes in both untreated and 4mM HU treated conditions. The x-axis represents the fiber length ratio (IdU/CldU) and y-axis represents the frequency of the fibers that have the corresponding IdU/CldU ratio. B. Average loss of protection (LoP) for the various genotypes across multiple experiments. C. Representative frequency of IdU/CldU ratios in untreated (black) and HU treated (red) MEFs indicating the average ratio for untreated and HU treated (number in parenthesis) as well as percent of LoP. LoP = (1-a/b)X100, where a is the IdU/CldU ratio after HU treatment and b is the IdU/CldU ratio without HU treatment. Error bars: SD, * p<0.05. Controls are represented by: Brca2+/+, Brca2Ko/+, and Palb2Ko/+. Abbreviations: Brca2+/+ = WT, Brca2Ko/+ = B2Ko/+, Brca2G25R/G25R = B2GR/GR, Brca2G25R/Ko = B2GR/Ko, Palb2Ko/+ = P2Ko/+.
Fig 8
Fig 8. Relationship between genomic instability and tumorigenesis.
Mutations in Brca2 that result in mild genomic instability (GIN) do not contribute to tumorigenesis. Mutations that result in moderate GIN lead to tumor formation in mutant mice. However, mutations (e.g. functionally null allele, Brca2Ko) that cause severe GIN result in increased cell death and decreased tumor formation. Genotypes in blue indicate the mice described in the present study.

References

    1. West SC. Molecular views of recombination proteins and their control. Nat Rev Mol Cell Biol. 2003;4(6):435–45. Epub 2003/06/05. 10.1038/nrm1127 . - DOI - PubMed
    1. Esashi F, Galkin VE, Yu X, Egelman EH, West SC. Stabilization of RAD51 nucleoprotein filaments by the C-terminal region of BRCA2. Nat Struct Mol Biol. 2007;14(6):468–74. Epub 2007/05/23. 10.1038/nsmb1245 . - DOI - PubMed
    1. Davies OR, Pellegrini L. Interaction with the BRCA2 C terminus protects RAD51-DNA filaments from disassembly by BRC repeats. Nat Struct Mol Biol. 2007;14(6):475–83. Epub 2007/05/23. 10.1038/nsmb1251 - DOI - PMC - PubMed
    1. Raghunandan M, Chaudhury I, Kelich SL, Hanenberg H, Sobeck A. FANCD2, FANCJ and BRCA2 cooperate to promote replication fork recovery independently of the Fanconi Anemia core complex. Cell Cycle. 2015;14(3):342–53. Epub 2015/02/07. 10.4161/15384101.2014.987614 . - DOI - PMC - PubMed
    1. Schlacher K, Christ N, Siaud N, Egashira A, Wu H, Jasin M. Double-strand break repair-independent role for BRCA2 in blocking stalled replication fork degradation by MRE11. Cell. 2011;145(4):529–42. Epub 2011/05/14. 10.1016/j.cell.2011.03.041 - DOI - PMC - PubMed

Publication types

MeSH terms