. 2016 Aug 5:6:31012.
doi: 10.1038/srep31012.

Two-photon excited fluorescence of intrinsic fluorophores enables label-free assessment of adipose tissue function

Affiliations

Two-photon excited fluorescence of intrinsic fluorophores enables label-free assessment of adipose tissue function

Carlo Amadeo Alonzo et al. Sci Rep. .

Abstract

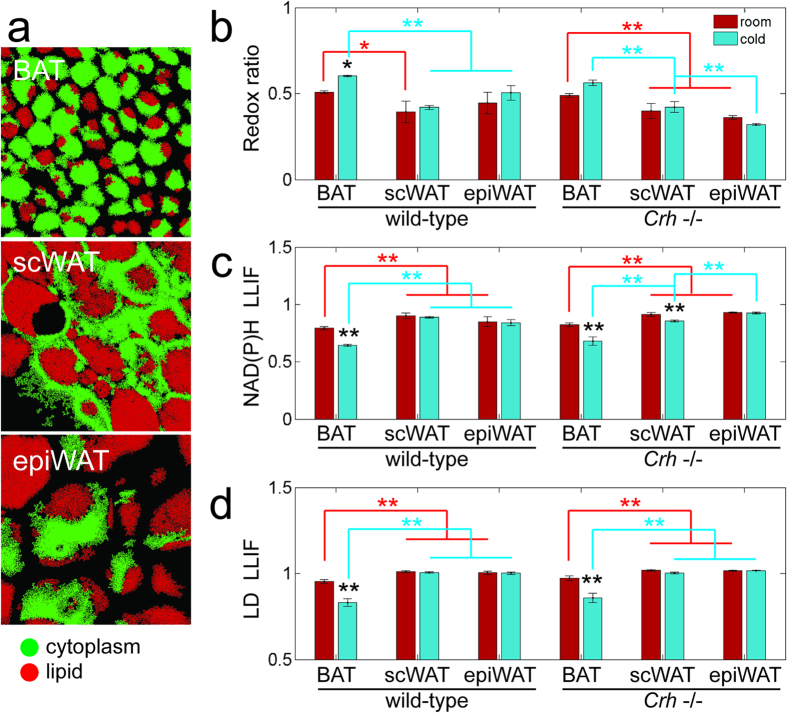
Current methods for evaluating adipose tissue function are destructive or have low spatial resolution. These limit our ability to assess dynamic changes and heterogeneous responses that occur in healthy or diseased subjects, or during treatment. Here, we demonstrate that intrinsic two-photon excited fluorescence enables functional imaging of adipocyte metabolism with subcellular resolution. Steady-state and time-resolved fluorescence from intracellular metabolic co-factors and lipid droplets can distinguish the functional states of excised white, brown, and cold-induced beige fat. Similar optical changes are identified when white and brown fat are assessed in vivo. Therefore, these studies establish the potential of non-invasive, high resolution, endogenous contrast, two-photon imaging to identify distinct adipose tissue types, monitor their functional state, and characterize heterogeneity of induced responses.


Figures

Figure 1
Figure 1. Two-photon excited fluorescence microscopy enables 3D imaging of subcellular compartments in adipose tissue using only intrinsic contrast.
(a,b) Redox ratio is a ratio of fluorescence intensity from endogenous metabolic co-factors FAD and NADH in the cytoplasm. Lipid droplets, coded in gray, are identified by spectral emission similar to NADH, but not FAD. (c,d) Lipid compartments are also contrasted from cytoplasm by longer fluorescence lifetimes (ex755/em460), presented here as the fractional intensity contribution of a 6.5 ns lifetime component. Both modes clearly depict larger lipid droplet size in epididymal white adipose tissue (eWAT) compared to brown adipose tissue (BAT).
Figure 2
Figure 2. Redox ratio provides functional contrast of cellular metabolism between adipose tissue types.
Representative images show mitochondria-rich BAT exhibit higher redox than WAT in subcutaneous inguinal (scWAT) and epididymal (epiWAT) depots at room temperature. Cold activation of thermogenic uncoupling in BAT leads to further increases in redox ratio, but no change in epiWAT. Redox also reveals cold activation in scWAT indicative of tissue browning in Crh−/− mice, but not in wild-type mice.
Figure 3
Figure 3. Fluorescence lifetime (ex755/em460) provides additional contrast in adipose tissue.
Application of a complimentary color scale (red for short lifetime, blue for long) contrasts similar features as redox ratio images. Lifetime trends parallel those of redox: shorter lifetimes in BAT than scWAT and epiWAT. Cold-activated thermogenesis is also associated with decreases in lifetime in Crh−/− scWAT and BAT in both genotypes.
Figure 4
Figure 4. Pixel-by-pixel fluorescence lifetime reveal distinct signatures of WAT and BAT.
(a–d) Fluorescence lifetime phasor distribution profiles of BAT are spread across a linear trajectory corresponding to a biexponential decay with lifetime components 6.5 ns and 0.3 ns. (el) scWAT and epiWAT distributions are more sharply clustered at the long-lifetime end of the same trajectory. Each panel depicts the peak normalized phasor distribution averaged from 3 mice, based on 6 to 15 acquired images per mouse.
Figure 5
Figure 5. Algorithmic segmentation of images facilitates separate analysis of cytoplasm and lipid compartments.
(a) Representative images of segmentation using combined fluorescence intensity and lifetime data (see Supplementary Fig. 3). (b) Mean redox ratio and (c) mean NAD(P)H LLIF were calculated for cytoplasmic regions, while (d) mean lipid LLIF was determined within lipid droplets. BAT had higher redox ratio and lower NAD(P)H and lipid fluorescence lifetimes than scWAT and epiWAT, with stronger difference after cold exposure. Cold response was also observed in scWAT of Crh−/− mice. Data is represented by mean ± s.e. of n = 3 mice per group. Significant differences were determined by mixed effects nested ANOVA with post-hoc Tukey HSD testing; *p < 0.05, **p < 0.001.
Figure 6
Figure 6. Multivariate analysis emphasizes differences between thermogenic and non-thermogenic tissue.
Scatter plots depict each captured image as a separate data point, with depot groups circumscribed by 95% confidence intervals. (a,b) Pooling across all mice, BAT (blue, n = 144 images from 12 mice) follows a distinct trajectory in the multivariate space compared to the common trajectory of scWAT (red, n = 144 images from 12 mice) and epiWAT (green, n = 121 images from 12 mice) depots. We also specifically consider the cold response of Crh−/− mice. (c,d) At room temp, scWAT (n = 39 images from 3 mice) occupies the same parameter space as epiWAT (n = 32 images from 3 mice), separate from BAT (n = 33 images from 3 mice); (e,f) scWAT distribution (n = 36 images from 3 mice) stretches towards the BAT data points (n = 33 images from 3 mice), but still overlaps with epiWAT (n = 34 from 3 mice) – consistent with thermogenic activation of BeAT in this depot.
Figure 7
Figure 7. In vivo TPEF imaging of adipose tissue.
(a,b) Fluorescence lifetime images acquired from adipose depots in live mice. (c,d) Phasor distributions (n = 5 images) from in vivo data show similar profiles as observed with previously frozen tissue (Fig. 4). Quantitative differences between BAT and epiWAT in (e) mean redox ratio, (f) NAD(P)H LLIF, and (g) LD LLIF were also consistent with trends seen in Fig. 5. Data is represented by mean ± s.e. of n = 5 images. Significant differences were determined by Student’s t-test; *p < 0.05, **p < 0.001.

References

    1. Harms M. & Seale P. Brown and beige fat: development, function and therapeutic potential. Nature medicine 19, 1252–1263, doi: 10.1038/nm.3361 (2013). - DOI - PubMed
    1. Bartelt A. et al. Brown adipose tissue activity controls triglyceride clearance. Nature medicine 17, 200–205, doi: 10.1038/nm.2297 (2011). - DOI - PubMed
    1. Masoodi M., Kuda O., Rossmeisl M., Flachs P. & Kopecky J. Lipid signaling in adipose tissue: Connecting inflammation & metabolism. Biochimica et biophysica acta 1851, 503–518, doi: 10.1016/j.bbalip.2014.09.023 (2015). - DOI - PubMed
    1. Scherer P. E. Adipose tissue: from lipid storage compartment to endocrine organ. Diabetes 55, 1537–1545, doi: 10.2337/db06-0263 (2006). - DOI - PubMed
    1. Alberti K. G. et al. Harmonizing the metabolic syndrome: a joint interim statement of the International Diabetes Federation Task Force on Epidemiology and Prevention; National Heart, Lung, and Blood Institute; American Heart Association; World Heart Federation; International Atherosclerosis Society; and International Association for the Study of Obesity. Circulation 120, 1640–1645, doi: 10.1161/CIRCULATIONAHA.109.192644 (2009). - DOI - PubMed

Publication types