. 2016 Sep;152(3):245-260.
doi: 10.1530/REP-16-0129.

Reproductive age-associated fibrosis in the stroma of the mammalian ovary

Affiliations

Reproductive age-associated fibrosis in the stroma of the mammalian ovary

Shawn M Briley et al. Reproduction. 2016 Sep.

Abstract

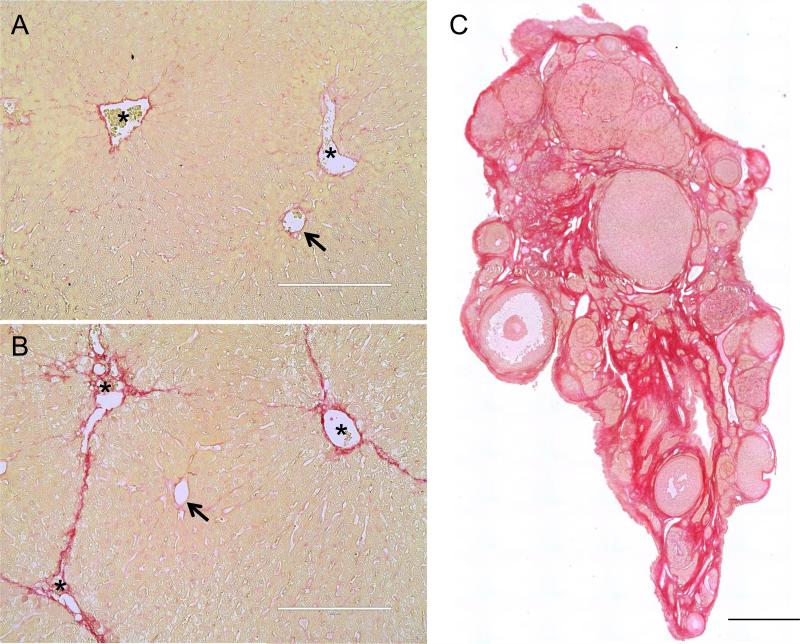
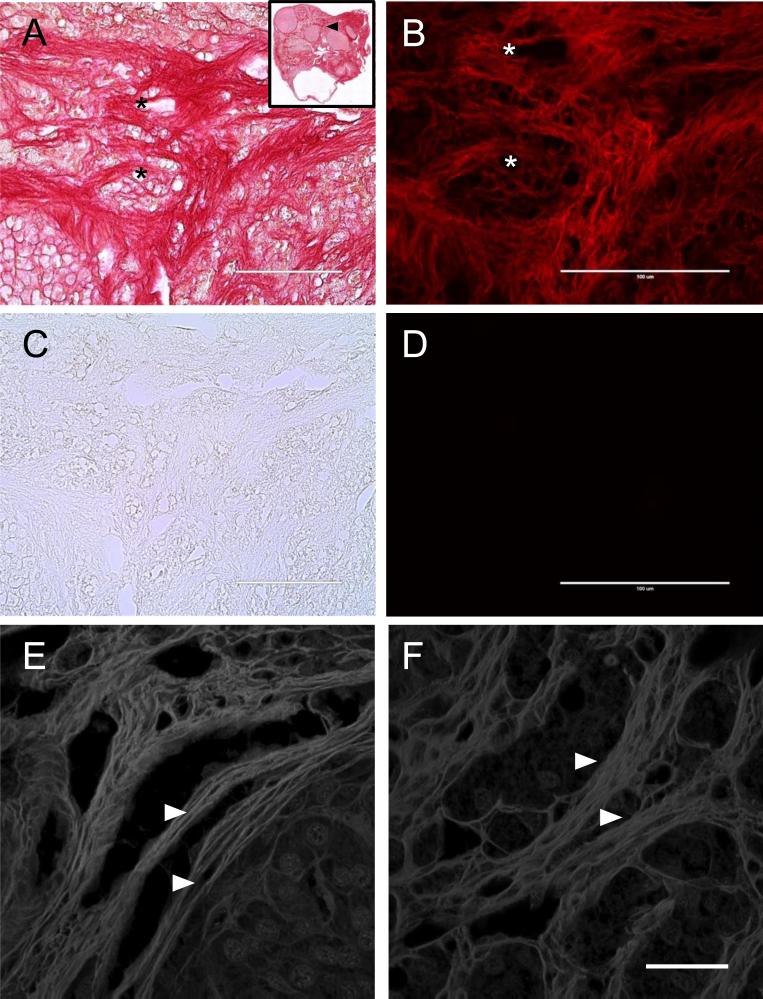
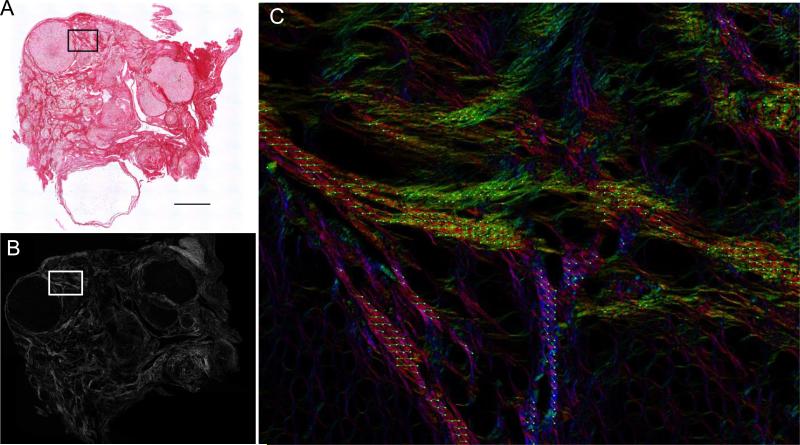
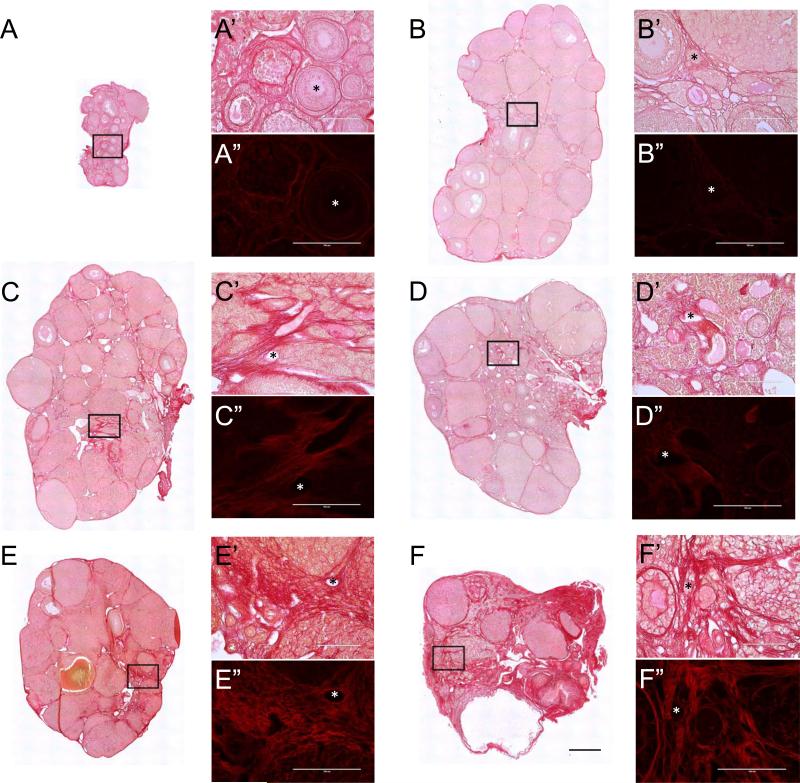
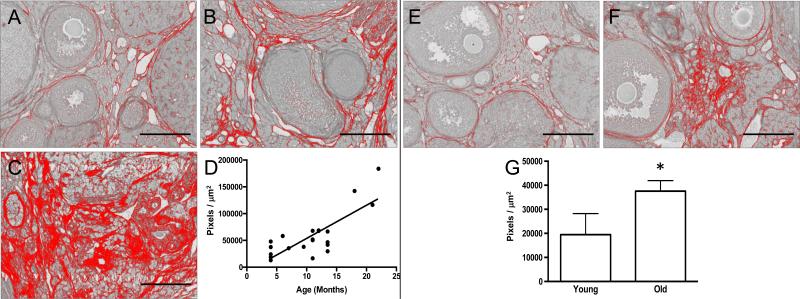
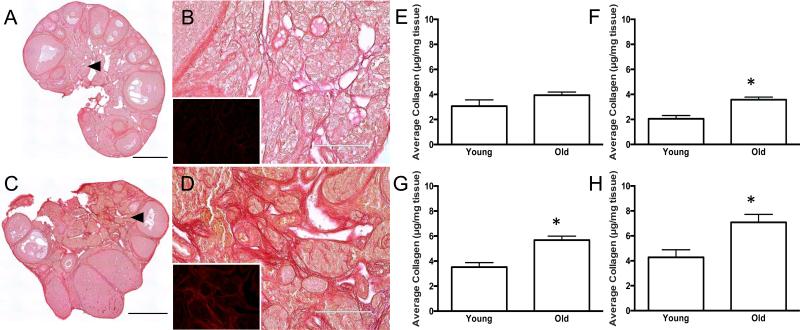
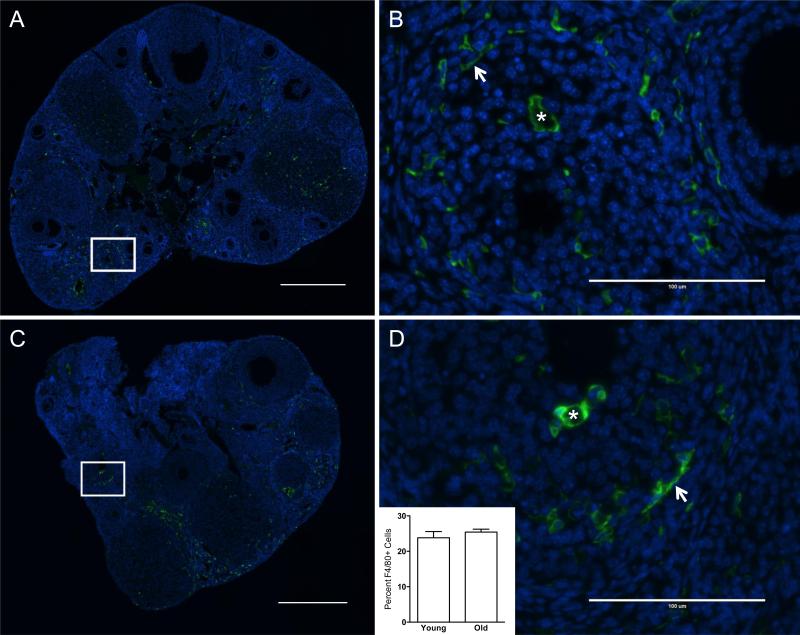
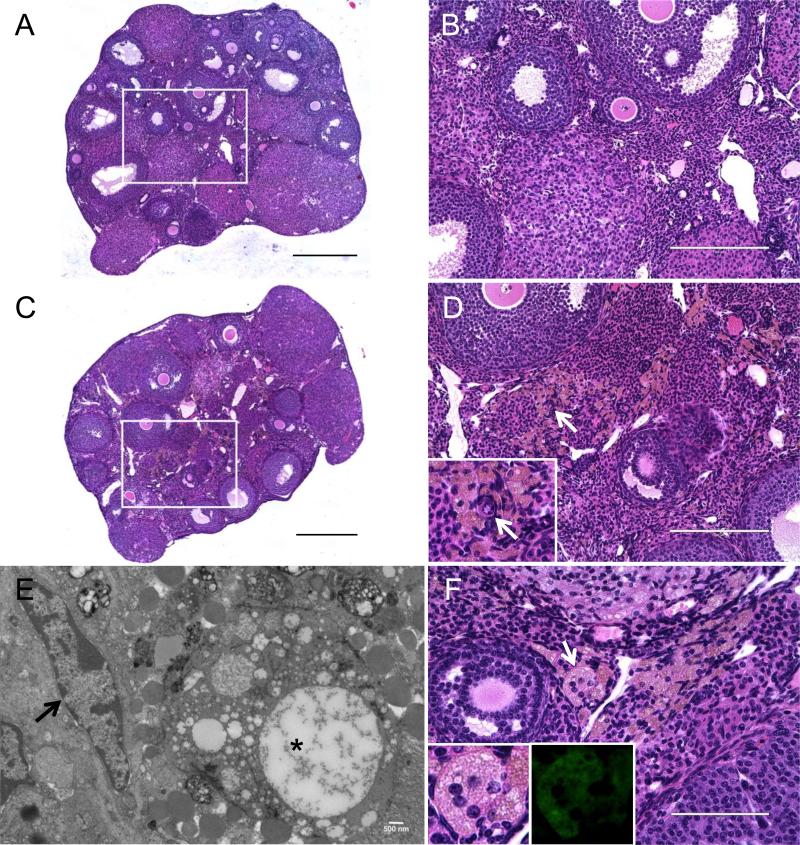
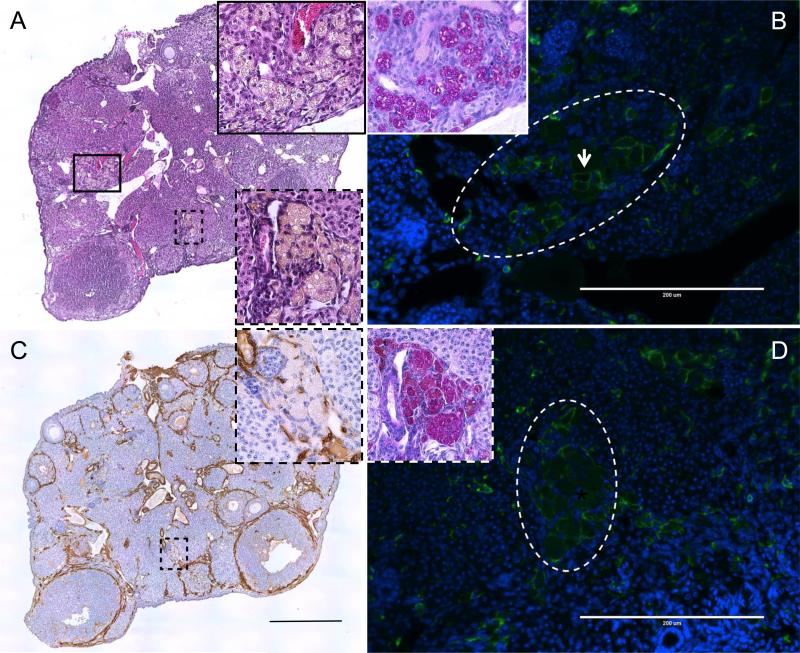
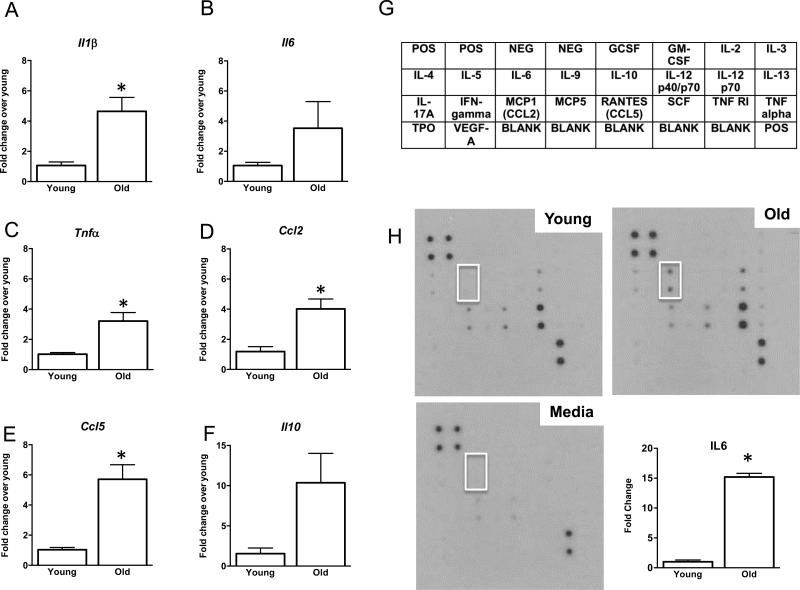
Under normal physiological conditions, tissue remodeling in response to injury leads to tissue regeneration without permanent damage. However, if homeostasis between synthesis and degradation of extracellular matrix (ECM) components is altered, fibrosis - or the excess accumulation of ECM - can disrupt tissue architecture and function. Several organs, including the heart, lung and kidney, exhibit age-associated fibrosis. Here we investigated whether fibrosis underlies aging in the ovary - an organ that ages chronologically before other organs. We used Picrosirius Red (PSR), a connective tissue stain specific for collagen I and III fibers, to evaluate ovarian fibrosis. Using bright-field, epifluorescence, confocal and polarized light microscopy, we validated the specific staining of highly ordered PSR-stained fibers in the ovary. We next examined ovarian PSR staining in two mouse strains (CD1 and CB6F1) across an aging continuum and found that PSR staining was minimal in ovaries from reproductively young adult animals, increased in distinct foci in animals of mid-to-advanced reproductive age, and was prominent throughout the stroma of the oldest animals. Consistent with fibrosis, there was a reproductive age-associated increase in ovarian hydroxyproline content. We also observed a unique population of multinucleated macrophage giant cells, which are associated with chronic inflammation, within the ovarian stroma exclusively in reproductively old mice. In fact, several genes central to inflammation had significantly higher levels of expression in ovaries from reproductively old mice relative to young mice. These results establish fibrosis as an early hallmark of the aging ovarian stroma, and this altered microenvironment may contribute to the age-associated decline in gamete quality.


Figures

Figure 1
Figure 1. Picrosirius Red staining detects fibrosis
Liver tissue sections from (A) a control mouse injected with vehicle and (B) a mouse injected chronically with CCl4 (2 times per week for 5 weeks). Arrows highlight the hepatic vessels in the periportal areas and asterisks highlight the central vein. (C) An ovarian tissue section from a 21-month old CD1 mouse was stained with PSR using the same protocol. The intense red staining corresponds to fibrotic regions. The scale bars in (A) and (B) are 200 μm and 0.4 mm in (C).
Figure 2
Figure 2. Picrosirius Red staining exhibits red fluorescence and shows fibrils organized into bundles within the ovarian stroma
PSR-stained ovarian tissue from a 22-month old CD1 mouse visualized by (A) brightfield microscopy and (B) epifluorescence microscopy using a Texas Red LED Light Cube. The inset in (A) shows the entire ovarian section, with the region examined in (A-D) marked by a black arrowhead. An adjacent unstained section was imaged with the same settings by (C) brightfield and (D) epifluorescence microscopy. The asterisks mark corresponding regions between brightfield and fluorescence images. The scale bars are 100 μm. (E, F) PSR stained ovarian tissue sections from 21- and 22-month old CD1 mice imaged by confocal microscopy using a 532 nm laser. The white arrowheads highlight fibrils that are organized into larger bundles. Maximum projections of 0.4 μm-thick optical sections are shown. The scale bar is 25 μm.
Figure 3
Figure 3. Picrosirius Red fibers in the aged ovary are birefringent
A PSR-stained ovarian tissue section from a 22-month old CD1 mouse visualized by both (A) brightfield microscopy and (B, C) circularly polarized light microscopy (Abrio LCPolScope). The boxed region in (A, B) is magnified in (C) where the false color image with retardance vectors (green lines) reflects the orientation of the co-aligned fibers. The scale bar is 0.4 mm.
Figure 4
Figure 4. PSR staining expands throughout the ovarian stroma with advanced reproductive age
Scans of PSR-stained ovarian sections from (A) 6-week old, (B) 5-month old, (C) 7-month old, (D) 9-month old (E) 18-month old, and (F) 22-month old CD1 mice visualized by brightfield microscopy. The scale bar for images in (A-F) is 0.4 mm. (A’-F’ and A”-F”) are higher magnification images from the specific regions of the ovarian stroma that are boxed in (A-F). Brightfield images are shown in (A’-F’) and fluorescence images are shown in (A”-F”). The fluorescence images were taken using a Texas Red LED Light cube with constant settings that were established for the 22-month old sample (F”). Therefore intensity differences across ages can be compared. Asterisks mark corresponding regions between brightfield and fluorescence images. Scale bars in (A’-F’ and A”-F”) are 100 μm.
Figure 5
Figure 5. Fibrosis significantly increases in the ovarian stroma with advanced reproductive age in both CD1 and CB6F1 mice
Representative processed color threshold images of PSR-stained ovarian tissue sections used to quantify fibrosis from CD1 mice that were (A) 4-months old, (B) 13.5-months old, and (C) 22-months old. (D) Graph showing the relationship between CD1 mouse age (months) and the average area of PSR-positive staining per ovarian section (pixels/μm2). A significant linear relationship exists between these variables (Pearson's correlation, P < 0.0001 and R2 = 0.6413). Representative processed color threshold images of PSR-stained ovarian tissue sections used to quantify fibrosis from CB6F1 mice that were (E) 6-12 weeks old (young) and (F) 14-17 months old (old). (G) Graph comparing the average area of PSR-positive staining per ovarian section (pixels/μm2) between reproductively young and old CB6F1 mice. The asterisk indicates a significant difference (P = 0.03). In all images, the red corresponds to PSR-positive staining, and scale bars are 200 μm.
Figure 6
Figure 6. Reproductive-age associated increases in PSR staining correlate with increased ovarian hydroxyproline content
Scans of PSR-stained ovarian sections from (A, B) 6-12 week old (young) and (C, D) 14-17 month old (old) CB6F1 mice visualized by brightfield microscopy. Regions highlighted by the arrowheads in (A, C) are further magnified in (B, D). The insets in (B, D) show the corresponding fluorescence that is apparent when the PSR-stained tissue is viewed using epifluorescence with a Texas Red LED Light Cube. The fluorescence images were taken using constant settings that were established for the old ovary sample (D, inset), and therefore, intensity differences between the age cohorts can be compared. Scale bars are 0.4 mm in (A, C) and 100 μm in (B, D). (E-H) Extrapolation of collagen content (μg/mg tissue) from hydroxyproline quantification in ovaries from reproductively young and old CB6F1 mice. Each graph represents data from a single trial. Asterisks mark significant differences (E: P = 0.255; F: P = 0.044; G: P = 0.004; H: P = 0.0186).
Figure 7
Figure 7. F4/80-positive macrophages are present in the ovarian stroma irrespective of reproductive age
Representative immunofluorescence images of ovarian sections from reproductively (A, B) young and (C, D) old CB6F1 mice stained with an F4/80-specific antibody. F4/80-positive cells are green and nuclei stained with DAPI are blue. Boxed regions in scans of entire ovarian sections (A, C) are further magnified in (B) and (D). Arrows highlight spindle shaped macrophages whereas asterisks highlight ovoid macrophages that have F4/80-positive staining around the entire cell surface. The inset in (D) shows the percentage of F4/80-positive cells relative to total cell number in ovarian sections from reproductively young and old mice (P = 0.45). Scale bars are 0.4 mm in (A, C) and 100 μm in (B, D).
Figure 8
Figure 8. Multinucleated giant cells are present within the ovarian stroma of reproductively old mice
Hematoxylin and Eosin (H&E) staining was performed on ovarian sections from (A, B) 6-12 week old (young) and (C, D, F) 14-17 month old (old) CB6F1 mice. (A) and (C) are scans of the entire ovarian sections, and boxed regions are further magnified in (B) and (D) to highlight the ovarian stroma. In (C, D, F), multinucleated giant cells appear foamy and stain brown by H&E. The white arrows in (D) highlight a primordial follicle (inset) that localizes within this microenvironment containing multinucleated giant cells. (E) An electron micrograph of a thin ovarian tissue section from a reproductively old animal. The black arrow highlights a fibroblast with an elongated nucleus, and the asterisks highlights an enlarged giant cell with vacuoles and inclusion bodies. Another representative image of the ovarian stroma from reproductively old CB6F1 mice is shown in (F). The white arrow highlights a particular multinucleated giant cell in which 5 nuclei are clearly visible. This cell is magnified in the inset and its autofluorescent properties are shown (inset, right). Scale bars in (A, C) are 0.4 mm, in (B, D) are 200 μm, 500 nm in (E), and 100 μm in (F).
Figure 9
Figure 9. Multinucleated giant cells in the ovarian stroma are fused macrophages
(A) A representative Hematoxylin and Eosin (H&E) stained ovarian section from a reproductively old CB6F1 mouse. The boxed regions (black solid and dashed), which highlight clusters of multinucleated giant cells, are further magnified in the insets. The black solid and dashed boxed regions are further examined in (B) and (C, D), respectively. In (B, D), ovarian sections were stained with an F4/80 antibody (green) and nuclei were visualized by DAPI (blue). The multinucleated giant cell clusters visible by H&E in (A, C) are encircled by the white dashed lines in (B, D). The arrow in (B) highlights cells individual cells expressing F4/80 at the cell periphery in contrast to fused cells that lack complete borders (D). Insets in (B, D) show Periodic Acid Schiff (pink) staining within the clusters of multinucleated giant cells. Nuclei were visualized with hematoxylin (blue). In (C) an ovarian section was stained with an α-Smooth Muscle Actin antibody (brown) and nuclei were visualized with hematoxylin (blue). The inset highlights the multinucleated giant cell cluster within the black dashed boxed region. Images in (A) and (C) are scans of the entire ovarian sections, whereas all other images highlight specific regions of interest in the ovarian stroma. All staining was done on sections that were between 5-30 μm of each other to ensure that the same clusters of multinucleated giant cells was examined. The scales bars in (A, C) are 0.4 mm and in (B, D) are 200 μm.
Figure 10
Figure 10. Reproductive aging is associated with an inflammatory ovarian microenvironment
Relative gene expression levels of (A) Il1b (B) Il6 (C) Ccl2 (D) Tnfa (E) Ccl5, and (F) Il10 in ovaries from 6-12 week old (young) and (14-17 month old (old) CB6F1 mice. The data is shown as fold change expression in ovaries from reproductively old mice compared to reproductively young mice. Asterisks indicate significant differences (A: P = 0.002 ΔCt, P = 0.009 fold change; B: P = 0.07 ΔCt, P = 0.15 fold change; C: P = 0.02 ΔCt, P = 0.008 fold change; D: P = 0.002 ΔCt, P = 0.008 fold change; E: P = 0.0002 ΔCt, P = 0.003 fold change; F: P = 0.02 ΔCt, P = 0.054 fold change). (G) Schematic of the cytokines interrogated on the RayBio C-Series Mouse Cytokine Antibody Array C1. Antibodies in each column are printed in duplicate. (H) Representative arrays probed with spent culture media from ovaries from reproductively young (top left) and old (top right) mice and control media only (bottom left). The white box highlights the spots on the arrays that correspond to IL-6. The relative expression of IL-6 in the conditioned culture media from ovaries isolated from reproductively young and old mice was quantified (bottom right), and the asterisks indicates a significant difference (P = 0.0024)

References

    1. Alves A, Gritsch K, Sirieix C, Drevon-Gaillot E, Bayon Y, Clermont G, Boutrand JP, Grosgogeat B. Computerized histomorphometric study of the splenic collagen polymorphism: A control-tissue for polarization microscopy. Microsc Res Tech. 2015;78:900–907. - PubMed
    1. Asano Y. Age-related accumulation of non-heme ferric and ferrous iron in mouse ovarian stroma visualized by sensitive non-heme iron histochemistry. J Histochem Cytochem. 2012;60:229–242. - PMC - PubMed
    1. Bataller R, Rombouts K, Altamirano J, Marra F. Fibrosis in alcoholic and nonalcoholic steatohepatitis. Best Pract Res Clin Gastroenterol. 2011;25:231–244. - PubMed
    1. Berkholtz CB, Lai BE, Woodruff TK, Shea LD. Distribution of extracellular matrix proteins type I collagen, type IV collagen, fibronectin, and laminin in mouse folliculogenesis. Histochem Cell Biol. 2006;126:583–592. - PMC - PubMed
    1. Britt KL, Drummond AE, Cox VA, Dyson M, Wreford NG, Jones ME, Simpson ER, Findlay JK. An age-related ovarian phenotype in mice with targeted disruption of the Cyp 19 (aromatase) gene. Endocrinology. 2000;141:2614–2623. - PubMed

Publication types