Review
. 2017 Feb 13;56(8):1964-1992.
doi: 10.1002/anie.201606181. Epub 2017 Jan 24.

Phage-Enabled Nanomedicine: From Probes to Therapeutics in Precision Medicine

Affiliations
Review

Phage-Enabled Nanomedicine: From Probes to Therapeutics in Precision Medicine

Kegan S Sunderland et al. Angew Chem Int Ed Engl. .

Abstract

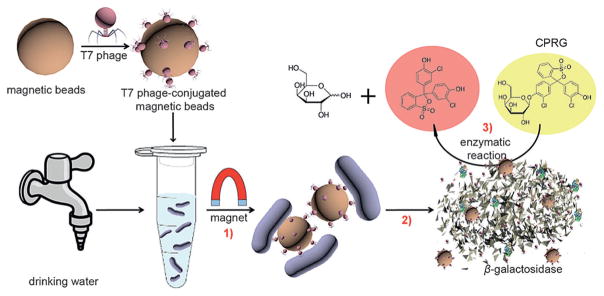
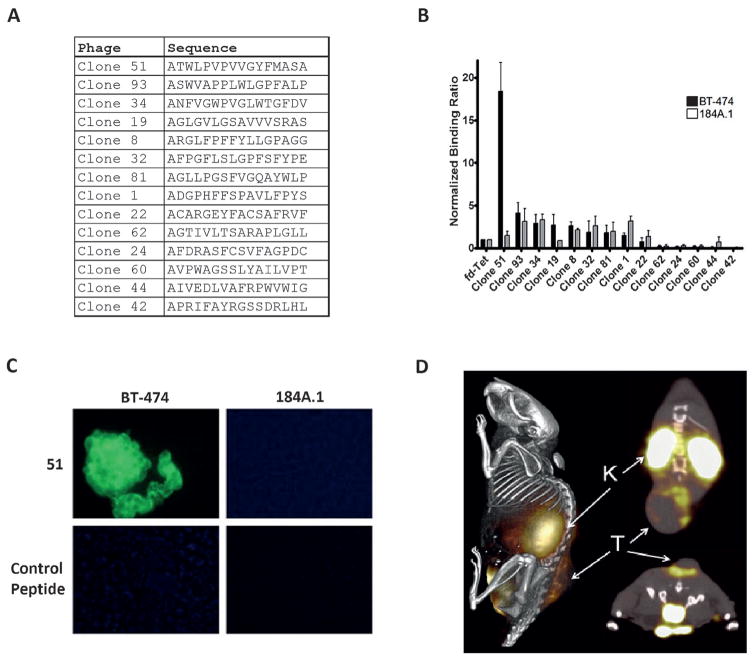
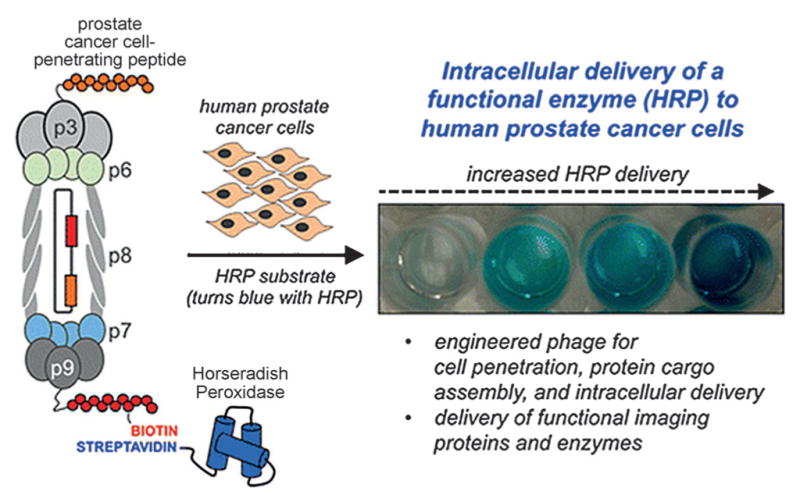
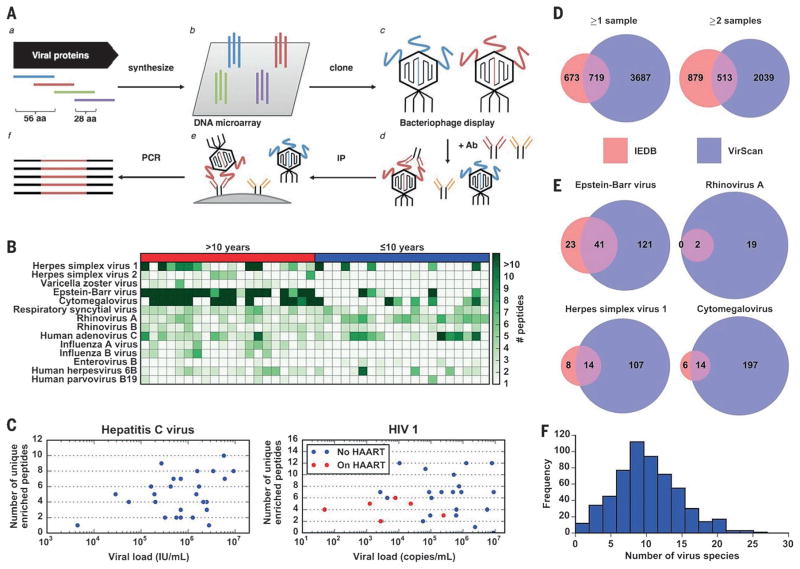
Both lytic and temperate bacteriophages (phages) can be applied in nanomedicine, in particular, as nanoprobes for precise disease diagnosis and nanotherapeutics for targeted disease treatment. Since phages are bacteria-specific viruses, they do not naturally infect eukaryotic cells and are not toxic to them. They can be genetically engineered to target nanoparticles, cells, tissues, and organs, and can also be modified with functional abiotic nanomaterials for disease diagnosis and treatment. This Review will summarize the current use of phage structures in many aspects of precision nanomedicine, including ultrasensitive biomarker detection, enhanced bioimaging for disease diagnosis, targeted drug and gene delivery, directed stem cell differentiation, accelerated tissue formation, effective vaccination, and nanotherapeutics for targeted disease treatment. We will also propose future directions in the area of phage-based nanomedicines, and discuss the state of phage-based clinical trials.

Keywords: biosensing; nanomedicine; phages; probes; therapeutics.


Figures

Figure 1
Figure 1
Overview of phage-based nanomedicine strategies. (Cancer Treatment) Strategies involving precision targeting by phages, which can also have cancer-treating drugs attached to the surface or encapsulated in the interior. Cell/Tissue Targeting: Biopanning on phage libraries has produced a large variety of precision-targeted peptides for specific cell and tissue types. Gene Therapy: Improved phage vectors have been created by incorporating cis genetic elements of adeno-associated virus to allow gene therapy in eukaryotic cells, which phage cannot otherwise infect. Tissue Regeneration: Phages have been incorporated into 2D and 3D scaffolds including hydrogels. Displayed peptides on phages can be tuned to help control stem cell fate and improve tissue regeneration. In addition, the physical structure of the phage itself can promote tissue regeneration by forming structures that mimic the 3D niche of the cells. Imaging: A variety of imaging techniques have been developed in which phages are utilized for precision targeting. Strategies often involve transport of an imaging agent to the desired location by attaching it to or encapsulating it in the phage structure. Stem Cell Fate: Phage-displayed peptides and self-assembled phage scaffolds can be used to control stem cell fate. Drug Delivery: Precision drug delivery methods have been developed by utilizing phages. Drugs can be conjugated onto the surface of phages or encapsulated within a phage such as MS2. The phage itself or attached targeting ligands can then serve as a precision transport system to a specific target. Vaccines: Genetically engineered phages can display peptides that safely mimic dangerous pathogens and generate an immune response for future attacks by that pathogen.
Figure 2
Figure 2
Detecting E. coli in drinking water utilizing a T7 phage conjugated magnetic probe. 1) Bacteria are separated from drinking water with a magnet after T7 phages are allowed to interact with the bacteria. 2) T7 phage infects the E. coli and causes the release of β-galactosidase. 3) Chlorophenol red-β-D-galactopyranoside hydrolysis catalyzed by β-galactosidase produces a colorimetric readout.[
Figure 3
Figure 3
A) Depiction of an M13–SWNT imaging probe. The pVIII coat protein of the phages are genetically modified to disperse SWNTs along its surface. The pIII protein of the phage is genetically engineered for precision targeting. B) Circulation of M13–SWNT in the blood. Circulation time is defined as the time point at which the %IDg−1 of SWNT in the blood falls to 5%. The blood circulation time for M13–SWNT was around 60 minutes. Each listed data point is the mean±standard deviation (SD) for n=3 animals. (C) M13–SWNT fluorescent images of a mouse injected with 2 μgmL−1 (200 μL, 0.022 mgkg−1 of M13–SWNTs) probe solution. Of the labelled tissues, the liver and spleen can be seen very clearly on the dorsal side. The images were taken at 2 h post injection with an acquisition time of 0.5 seconds at varying time points as shown.[49]
Figure 4
Figure 4
Summary of the process of biopanning. Briefly, a target ligand is immobilized on a surface. A bacteriophage library is then applied to the surface (a negative selection for the surface without ligand can also be done first), followed by washing, after which only those phages displaying peptides that bind the target will stay bound. The surviving phages are then released by disrupting the interaction. The released phages are amplified and the selection is repeated, usually 3 to 4 times. At the end, phages can be titered and individual plaques can be picked to be sent for sequencing. The most frequently occurring peptides identified from sequencing are then presumed to be the best binders for the target ligand.
Figure 5
Figure 5
A) The synthetic strategy for developing MS2 phage capsids for cargo delivery is shown. An N87C mutation on the MS2 coat protein allows site-specific alkylation. Exterior surface modification of the aptamer with a phenylene diamine group is then completed. A T19paF mutation on the capsid then enables the attachment of modified DNA to the surface of the MS2 through a NaIO4-mediated oxidative coupling reaction. B, C) Images of cellular targeting and uptake with aptamer-labeled capsids. The scale bars: 3 μm. (D) Flow cytometry confirmation of cell targeting. Only those MS2 capsids modified with strand B were bound to the Jurkat cells (blue trace). Capsids not modified on the exterior and capsids modified with strand C (green and yellow traces, respectively) showed only background autofluorescence (red trace). The live-cell confocal images show colocalization of B-labeled capsids with LDL-labeled endosomes as shown in (B), but not with transferrin-labeled endosomes as shown in (C).[
Figure 6
Figure 6
A) Depiction of siRNA-coated phage-like nanoparticles created by mixing cholate-solubilized phage fusion protein with siRNA. The cholate was then gradually removed. The N terminus of the phage protein is a targeting ligand, and the positively charged C terminus interacts with the siRNA. B–D) Images showing the binding of the phage protein/siRNA complex (80:1) to MCF-7 (B and C) or MCF-10A (D) cells.[97] The incubation time with the siRNA-coated phage-like nanoparticles was 24 hours for (B) and 4 hours for (C).
Figure 7
Figure 7
A) A diagram of the SPACE peptide (discovered utilizing phage display) bound to cationic ethosomes for the topical delivery of siRNA. The SPACE peptide is directly conjugated to the siRNA or the ethosomal particle surface, and also exists in free form. B) The SPACE peptide directs the internalization of the model drug, fluorescein isothiocyanate (FITC), in a concentration-dependent manner. Representative images showing FITC (green) internalization into skin cells after 120 minutes of incubation at (i) 1 mgmL−1, (ii) 4 mgmL−1, (iii) 7 mgmL−1, or (iv) 10 mgmL−1 FITC–SPACE peptide. The cell nuclei were stained with Hoechst 33342 (blue) and dead cells are indicated by ethidium bromide staining (red). Dead cells were ignored during analysis. (C) The free SPACE peptide increases internalization of the model drug FITC. It also shifts the intracellular distribution from endocytotic structures into the cytoplasm. Internalization of FITC into human adult epidermal keratinocytes when incubated for 15 min with 0.1 mgmL−1 FITC-SPACE peptide with or without 10 mgmL−1 free SPACE peptide are shown. Values represent the mean±SD for n=3. D, E) Representative images of internalization and intracellular localization when the cells are incubated with 0 mgmL−1 (D) or 10 mgmL−1 (E) free SPACE peptide.[98]
Figure 8
Figure 8
In situ detection of trans-activator of transcription (TAT)-driven phage-mediated green fluorescent protein (GFP) expression in cultured cells. COS-1 cells (2.5×10⁴) were incubated for 6 hours at 37°C, with 500 μL of medium containing 2.5×10¹⁰ pfu of TAT GFP phages (A,B), 2.5×10⁹ pfu of TAT GFP phages (C,D), or 2.5×10¹⁰ pfu of wild-type GFP phages (E,F). pfu=plaque-forming units. After 48 h, the cells were counterstained with 4′,6-diamidine-2-phenylindole HCl and examined by fluorescence microscopy, with a GFPA cube (A,C,E) or a WU cube (B,D,F), as described in the report. G) Preparation of phage λ particles displaying foreign peptides. DNA is packaged through recognition of the COS site into the phage λ prohead, which consists of E protein. Next, the chimeric D protein with the foreign peptide is assembled onto the prohead, followed by binding of the head to the tail.[37]
Figure 9
Figure 9
Overview of tumor treatment with M13 phage–Doxil nanoparticles modified with the MCF-7-targeted 8-mer landscape library f8/8. Significant tumor remission was accompanied by enhanced apoptosis. There was extensive necrosis and low toxicity. This treatment is ideal for breast cancer therapy.[105]
Figure 10
Figure 10
Magnetic resonance imaging strategy utilizing P22 phages. GdIII-chelating agents are attached to either the interior or exterior surface of P22 viral capsids. This system allows non-invasive imaging of the intravascular system as shown in the magnetic resonance (MR) image.[129]
Figure 11
Figure 11
A) Selected phage clones from biopanning for binding to BT-474 breast cancer cells. B) Individual phages were incubated with either target BT-474 cells or normal 184A.1 breast epithelial cells. Total bound phages were quantified and normalized with respect to wild-type phage. The shaded bars represent a mean of three replicate experiments. The error bars give the standard deviation. C) Peptide 51 in Vitro cell binding assays. Biotinylated peptide 51 and a control peptide were incubated with BT-474 human breast cancer and 184A.1 normal breast epithelial cells fixed onto microscope slides. After washing, bound peptides were detected by addition of an anti-biotin AlexaFluor488-conjugated antibody. Strong binding was observed for 51 with the target BT-474 cells. Strong binding was not shown for normal breast epithelial cells. The control peptide does not exhibit binding to either cell line. D) Imaging of BT-474 breast cancer in mice using a peptide developed by phage display. A tumor-bearing mouse was injected with 111In-DOTA-51 and peptide for imaging. T: tumor, K: kidney.[130]
Figure 12
Figure 12
Scheme for the delivery of horseradish peroxidase to prostate cancer cells by utilizing phages as a carrier with a cancer-cell-penetrating peptide displayed on p3. Increased horseradish peroxidase delivery is indicated by a darker blue color in the colorimetric assay.[132]
Figure 13
Figure 13
General strategy for counting miRNA with the naked eye. a) A T7–gold nanoparticle probe is created by conjugation with a thiolated miRNA-capturing oligonucleotide. The T7 phages are fluorescent. The magnetic microparticle probe is then prepared through conjugation of another biotinylated miRNA-capturing oligonucleotide onto a magnetic microparticle. The magnetic microparticles and T7–gold nanoparticles are then mixed in the presence of the target miRNA. A sandwich complex is formed following the recognition and capture of miRNA. The phages are then eluted through competitive binding followed by plating. The number of fluorescent phages is equal to the number of plaques formed, which is in turn equal to the number of miRNA target molecules. b) Diagram of a fluorescent T7 phage. c) Images of a Petri dish showing the presence of plaques when green fluorescence T7 phages are plated on the host bacteria media (right) and an absence of plaques when no phage is used to infect bacteria (left). d) Fluorescent images of the same Petri dish shown in (c) under the fluorescence scanner. The Petri dish on the right shows green plaques, whereas the one on the left does not. An excitation wavelength of λ=488 nm is used in detecting the green fluorescent plaques derived from the green fluorescent T7 phage–GNP probes.[
Figure 14
Figure 14
General VirScan analysis of the human virome. A) Construction of the virome peptide library and VirScan screening procedure. a) The virome peptide library consists of 93904 peptide tiles, each consisting of 56 amino acids, with a 28 amino acid overlap, that covers the proteomes of all known human viruses. b) The 200-nt DNA sequences encoding the peptides were printed on a releasable DNA microarray. c) The released DNA was amplified and cloned into a T7 phage-display vector and packaged into virus particles displaying the encoded peptide on its surface. d) The library is mixed with a sample containing antibodies that bind to their cognate peptide antigen on the phage surface. e) The antibodies are immobilized, and unbound phages are washed away. f) Finally, amplification of the bound DNA and high-throughput sequencing of the insert DNA from bound phages reveals peptides targeted by sample antibodies. Ab: antibody, IP: immunoprecipitation. B) Antibody profile of a randomly chosen group of donors to show typical assay results. Each row represents a virus; each column a sample. The label above each chart indicates whether the donors are over or under 10 years of age. The color intensity of each cell indicates the number of peptides from the virus that were significantly enriched by antibodies in the sample. C) A scatter plot of the number of unique enriched peptides (after applying maximum-parsimony filtering) detected in each sample against the viral load in that sample. Data are shown for HCV-positive and HIV-positive samples for which we were able to obtain viral-load data. For the HIV-positive samples, red dots indicate samples from donors currently on highly active antiretroviral therapy (HAART) at the time the sample was taken, whereas blue dots indicate different donors before undergoing therapy. IU: international units. D) Overlap between enriched peptides detected by VirScan and human B-cell epitopes from viruses in immune epitope database. The entire pink circle represents the 1392 groups of nonredundant immune epitope database epitopes that are also present in the VirScan library (out of 1559 clusters total). The overlap region represents the number of groups with an epitope that is also contained in an enriched peptide detected by VirScan. The purple-only region represents the number of nonredundant enriched peptides detected by VirScan that do not contain an immune epitope database epitope. Data are shown for peptides enriched in at least one (left) or at least two (right) samples. E) Overlap between enriched peptides detected by VirScan and human B-cell epitopes in an immune epitope database from common human viruses. The regions represent the same values as in (D) except only epitopes corresponding to the indicated virus are considered, and only peptides from that virus that were enriched in at least two samples were considered. F) Distribution of number of viruses detected in each sample. The histogram depicts the frequency of samples binned by the number of virus species detected by VirScan. The mean and median of the distribution are both about 10 virus species.[137]
Figure 15
Figure 15
The concept of displaying vaccine peptides on fd phages for Candida albicans. a) The epitope peptide of secretory aspartyl proteinase 2 (Sap2) was displayed on the phages. b) The engineered phages were injected into mice three times at 25 μg per mouse each time to create immunized mice. Next, two approaches were used to prove the success of the vaccine. The first approach (c) was to test whether Candida albicans could infect immunized mice, and this was successful evidenced by decreased fungal loading in the kidneys, fewer visceral lesions, and an increased survival rate (f). The second approach tested whether antibodies collected from immunized mice (c′) could cure infected mice (h′). This approach led to curing of the infection as evidenced by significantly lowered fungal loading in the kidneys (i′).[140]
Figure 16
Figure 16
A) An illustration of the concept viral nanocontainers encapsulating marine snail peptide MVIIA and the cell-penetrating peptide Tat(FAM) on the exterior to deliver cargo across the blood brain barrier. This process utilizes an endocytic pathway. B) Spinning-disc microscopy images of RMBVE cells after incubation (20 minutes) with conjugated virus-like particles using a DAPI filter (a,d) or a RhoB filter (b,e) for lysotracker (Excitation/Emission=490/525 nm). c,f) Overlay of the DAPI, RhoB, and FITC channels, showing colocalization of conjugated virus-like particles with acidic organelles. Cells with hypertonic solution (0.4M sucrose) show reduced uptake of conjugated virus-like particles, but still the show the presence of lysosomes (e–f). Scale bar : 12 μm. g) Green fluorescence intensities plotted to show the reduced cellular uptake of the conjugated virus-like particles in cells incubated without hypertonic solution. Ten regions were selected for measuring the fluorescence intensities. C) Rab11 immunostaining indicating Tat(FAM)–P22-MVIIA virus-like particles in the recycling pathway. a–f) The distribution of Rab11, which is known to associate primarily with perinuclear recycling endosomes and regulate the recycling of endocytosed proteins. The immunoreactivity in cells treated with fluorescent virus-like particles and stained for Rab11 are demonstrated through by overlays images for DAPI and FITC (a,d), RhoB and DAPI (b,e), or all three (c,f). The arrows in (c) and (f) show the concentrated virus-like particles inside recycling endosomes as a result of to colocalization with Rab11. g) Quantitation of the images for green (FITC) and red (RhoB) filters shown in (a–f). *p =0.55 or p >0.05. Scale bar: 12 μm.[142]

References

    1. d’Herelle F. C R Acad Sci Paris. 1917;165:373–375.
    1. Rohwer F, Segall AM. Nature. 2015;528:46–48. - PubMed
    2. Matsuzaki S, Uchiyama J, Takemura-Uchiyama I, Daibata M. Nature. 2014;509:S9–S9. - PubMed
    1. Mao CB. In: Brenner’s Encyclopedia of Genetics. Stanley M, Kelly H, editors. Vol. 1. Academic Press; San Diego: 2013. pp. 39–41.
    1. Yosef I, Manor M, Kiro R, Qimron U. Proc Natl Acad Sci USA. 2015;112:7267–7272. - PMC - PubMed
    2. Marraffini L. FASEB J. 2016;30:107.101.
    3. Yosef I, Manor M, Qimron U. Bacteriophage. 2016;6:e1096996. - PMC - PubMed
    4. Villion M, Moineau S. Nature. 2013;494:433–434. - PubMed
    5. Verbeken G, Pirnay J, Lavigne R, Ceulemans C, De Vos D. J Microb Biochem Technol. 2016;8:021–024.
    6. Reardon S. Nature. 2014;510:15–16. - PubMed
    1. Agnès KH, Rock-Archer . For the first time, an industry-standard clinical trial is evaluating the tolerance and effectiveness of phages in fighting sensitive antibiotic-resistant infections. Andrew Lloyd & Associates; 2015. pp. 1–2.
    2. Young R, Gill JJ. Science. 2015;350:1163–1164. - PMC - PubMed

Publication types