

Air pollution, aeroallergens and admissions to pediatric emergency room for respiratory reasons in Turin, northwestern Italy
- PMID: 27492006
- PMCID: PMC4974813
- DOI: 10.1186/s12889-016-3376-3
Air pollution, aeroallergens and admissions to pediatric emergency room for respiratory reasons in Turin, northwestern Italy
Abstract
Background: Air pollution can cause respiratory symptoms or exacerbate pre-existing respiratory diseases, especially in children. This study looked at the short-term association of air pollution concentrations with Emergency Room (ER) admissions for respiratory reasons in pediatric age (0-18 years).
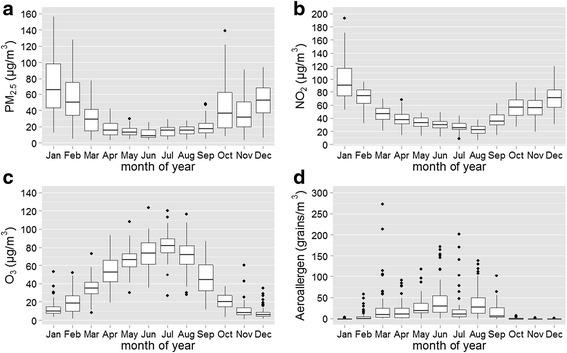
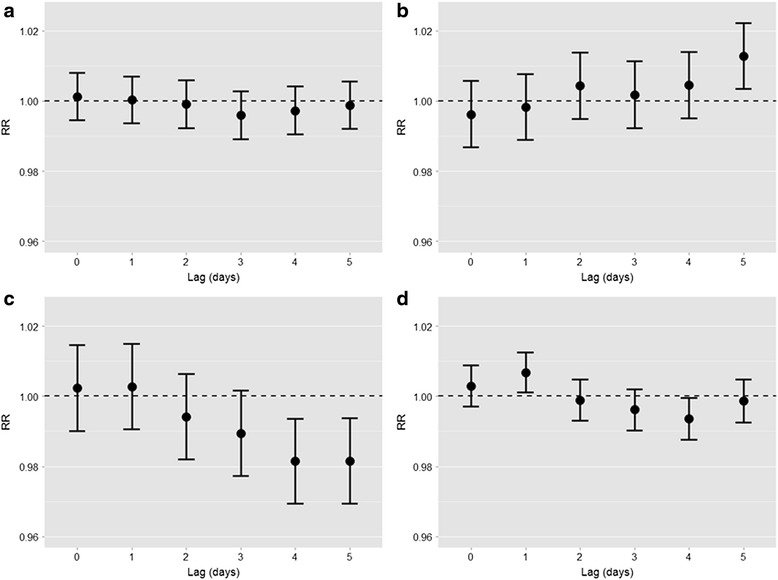
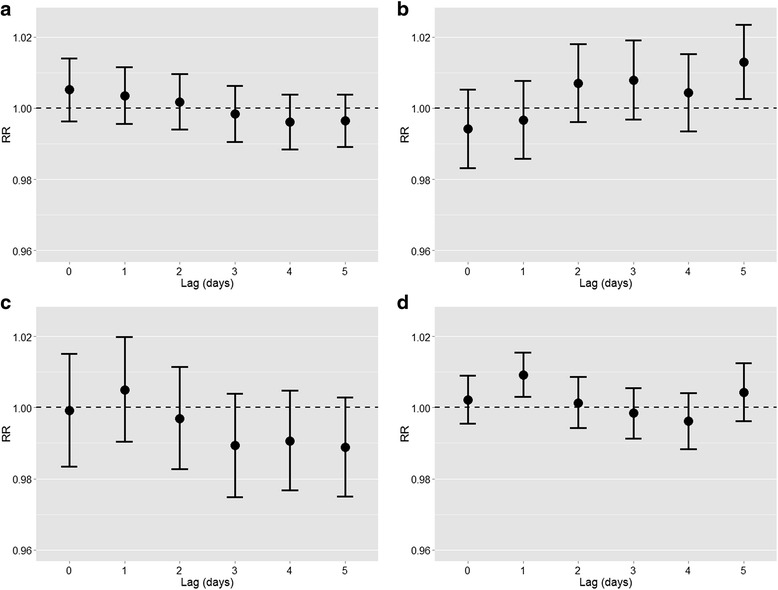
Methods: Daily number of ER admissions in a children's Hospital, concentrations of urban-background PM2.5, NO2, O3 and total aeroallergens (Corylaceae, Cupressaceae, Gramineae, Urticaceae, Ambrosia, Betula) were collected in Turin, northwestern Italy, for the period 1/08/2008 to 31/12/2010 (883 days). The associations between exposures and ER admissions were estimated, at time lags between 0 and 5 days, using generalized linear Poisson regression models, adjusted for non-meteorological potential confounders.
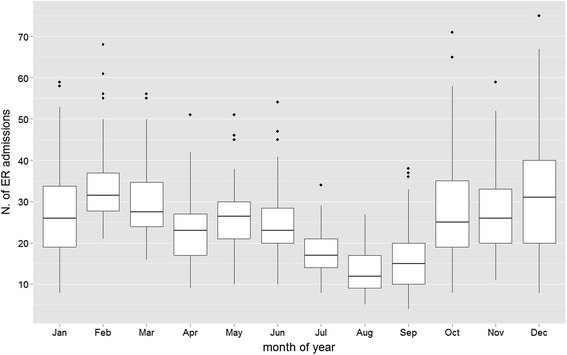
Results: In the study period, 21,793 ER admissions were observed, mainly (81 %) for upper respiratory tract infections. Median air pollution concentrations were 22.0, 42.5, 34.1 μg/m(3) for urban-background PM2.5, NO2, and O3, respectively, and 2.9 grains/m(3) for aeroallergens. We found that ER admissions increased by 1.3 % (95 % CI: 0.3-2.2 %) five days after a 10 μg/m(3) increase in NO2, and by 0.7 % (95 % CI: 0.1-1.2 %) one day after a 10 grains/m(3) increase in aeroallergens, while they were not associated with PM2.5 concentrations. ER admissions were negatively associated with O3 and aeroallergen concentrations at some time lags, but these association shifted to the null when meteorological confounders were adjusted for in the models.
Conclusions: Overall, these findings confirm adverse short-term health effects of air pollution on the risk of ER admission in children and encourage a careful management of the urban environment to health protection.
Keywords: Airborne pollutants; Pediatric emergency room; Pollens; Short-term respiratory effects; Time-series analysis.
Figures
Similar articles
-
Effects of short-term exposure to air pollution on hospital admissions of young children for acute lower respiratory infections in Ho Chi Minh City, Vietnam.Res Rep Health Eff Inst. 2012 Jun;(169):5-72; discussion 73-83. Res Rep Health Eff Inst. 2012. PMID: 22849236
-
[Meta-analysis of the Italian studies on short-term effects of air pollution].Epidemiol Prev. 2001 Mar-Apr;25(2 Suppl):1-71. Epidemiol Prev. 2001. PMID: 11515188 Italian.
-
Effects of air pollution on respiratory hospital admissions in İstanbul, Turkey, 2013 to 2015.Chemosphere. 2017 Aug;181:544-550. doi: 10.1016/j.chemosphere.2017.04.105. Epub 2017 Apr 24. Chemosphere. 2017. PMID: 28463729
-
Short-term exposure to air pollution and hospital admission for pneumonia: a systematic review and meta-analysis.Environ Health. 2021 Jan 7;20(1):6. doi: 10.1186/s12940-020-00687-7. Environ Health. 2021. PMID: 33413431 Free PMC article.
-
Issue 1 - "Update on adverse respiratory effects of outdoor air pollution". Part 1): Outdoor air pollution and respiratory diseases: A general update and an Italian perspective.Pulmonology. 2022 Jul-Aug;28(4):284-296. doi: 10.1016/j.pulmoe.2021.12.008. Epub 2022 Feb 10. Pulmonology. 2022. PMID: 35153178 Review.
Cited by
-
The Effect of Outdoor Aeroallergens on Asthma Hospitalizations in Children in North-Western Tuscany, Italy.Int J Environ Res Public Health. 2022 Mar 17;19(6):3586. doi: 10.3390/ijerph19063586. Int J Environ Res Public Health. 2022. PMID: 35329272 Free PMC article.
-
Air pollution and respiratory infections: the past, present, and future.Toxicol Sci. 2023 Mar 20;192(1):3-14. doi: 10.1093/toxsci/kfad003. Toxicol Sci. 2023. PMID: 36622042 Free PMC article. Review.
-
Association between Ambient Air Pollution and Emergency Room Visits for Pediatric Respiratory Diseases: The Impact of COVID-19 Pandemic.Toxics. 2022 May 14;10(5):247. doi: 10.3390/toxics10050247. Toxics. 2022. PMID: 35622660 Free PMC article.
-
Gaseous Pollutants and Particulate Matter (PM) in Ambient Air and the Number of New Cases of Type 1 Diabetes in Children and Adolescents in the Pomeranian Voivodeship, Poland.Biomed Res Int. 2020 Feb 11;2020:1648264. doi: 10.1155/2020/1648264. eCollection 2020. Biomed Res Int. 2020. PMID: 32099842 Free PMC article.
-
Ambient air pollution is associated with pediatric pneumonia: a time-stratified case-crossover study in an urban area.Environ Health. 2019 Aug 28;18(1):77. doi: 10.1186/s12940-019-0520-4. Environ Health. 2019. PMID: 31462279 Free PMC article.
References
-
- Asher MI, Montefort S, Björkstén B, Lai CK, Strachan DP, Weiland SK, Williams H. Worldwide time trends in the prevalence of symptoms of asthma, allergic rhinoconjunctivitis, and eczema in childhood: ISAAC Phases One and Three repeat multicountry cross-sectional surveys. Lancet. 2006;368:733–743. doi: 10.1016/S0140-6736(06)69283-0. - DOI - PubMed
-
- de Marco R, Cappa V, Accordini S, Rava M, Antonicelli L, Bortolami O, Braggion M, Bugiani M, Casali L, Cazzoletti L, Cerveri I, Fois AG, Girardi P, Locatelli F, Marcon A, Marinoni A, Panico MG, Pirina P, Villani S, Zanolin ME, Verlato G, GEIRD Study Group Trends in the prevalence of asthma and allergic rhinitis in Italy between 1991 and 2010. Eur Respir J. 2012;39:883–892. doi: 10.1183/09031936.00061611. - DOI - PubMed
MeSH terms
Substances
LinkOut - more resources
Full Text Sources
Other Literature Sources
Medical
