. 2016 Sep 1;311(3):G521-32.
doi: 10.1152/ajpgi.00022.2016. Epub 2016 Aug 4.

Preterm infant gut microbiota affects intestinal epithelial development in a humanized microbiome gnotobiotic mouse model

Affiliations

Preterm infant gut microbiota affects intestinal epithelial development in a humanized microbiome gnotobiotic mouse model

Yueyue Yu et al. Am J Physiol Gastrointest Liver Physiol. .

Abstract

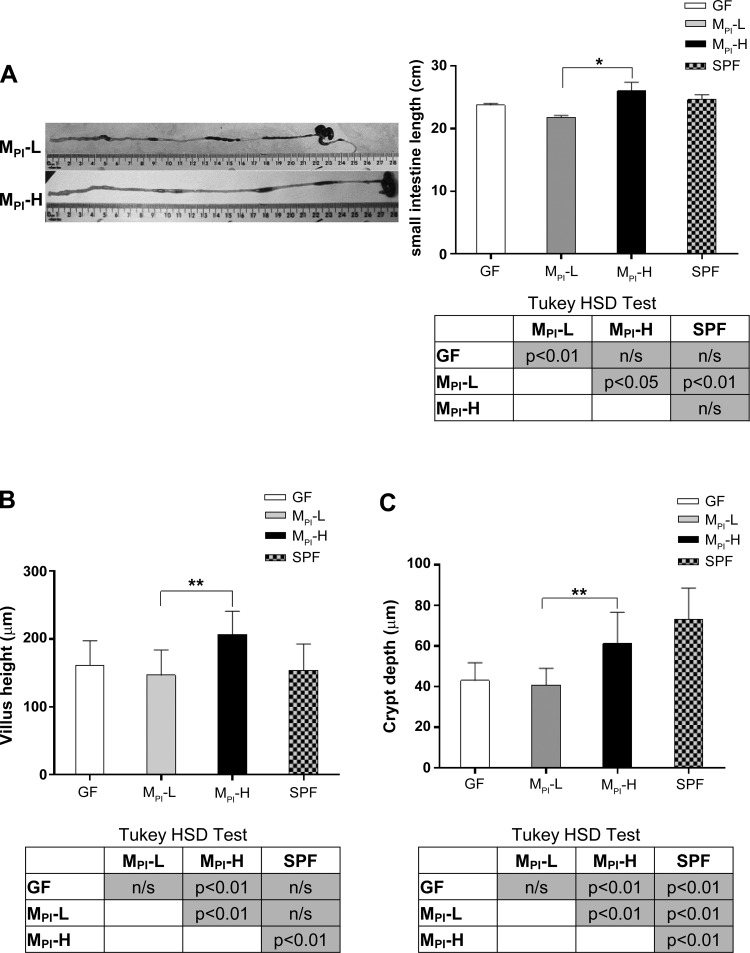
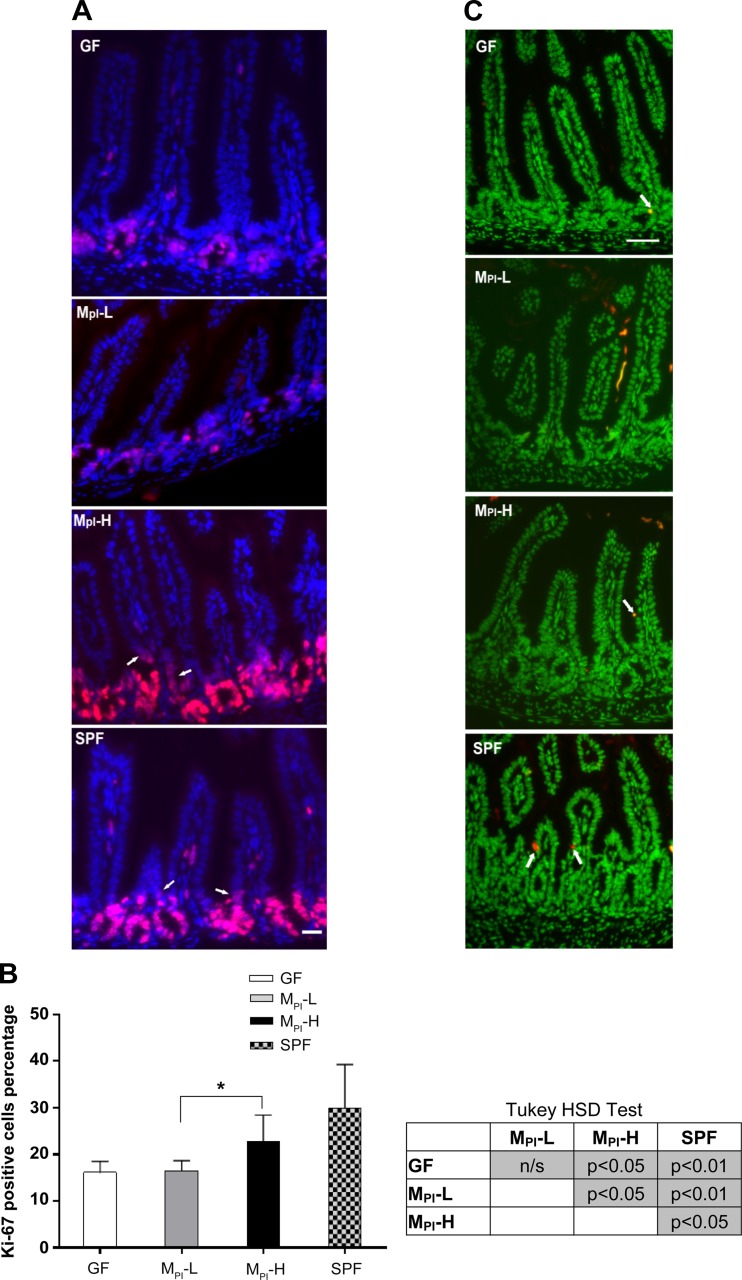
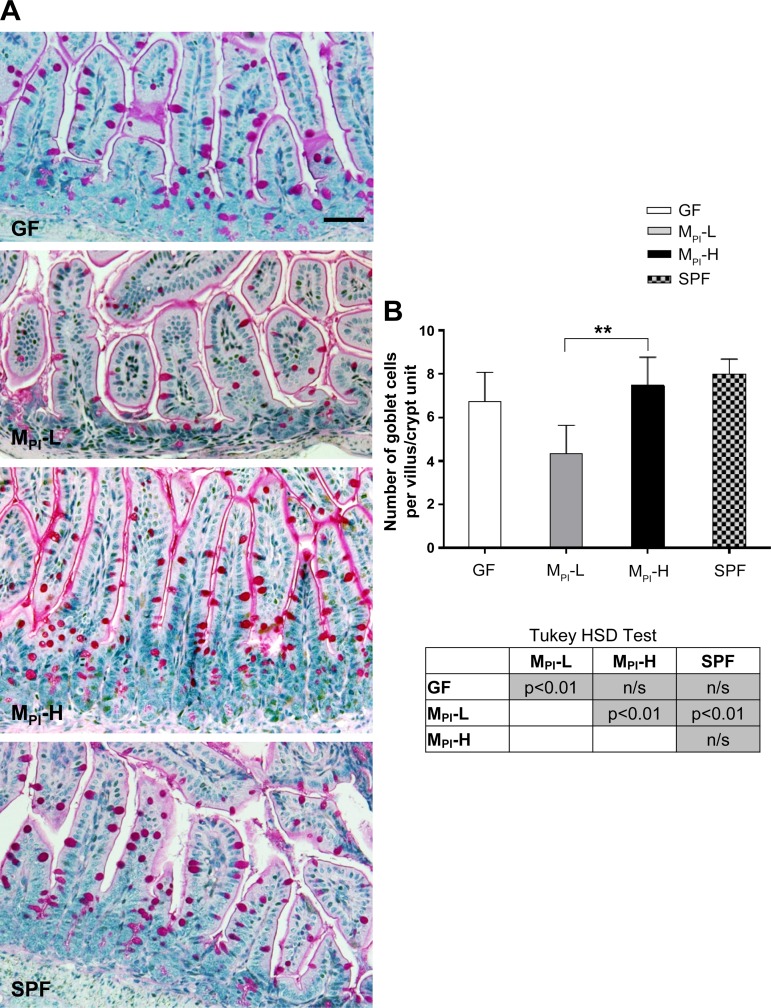
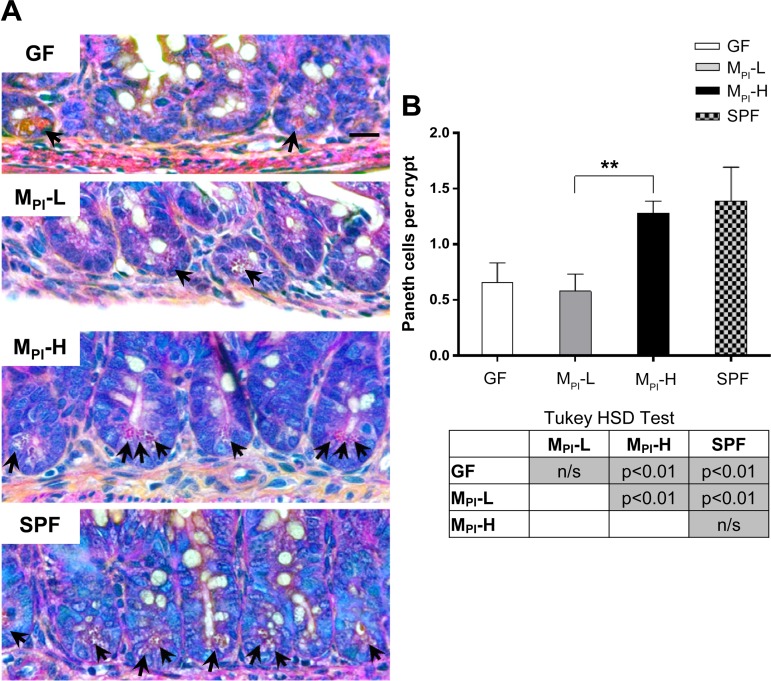
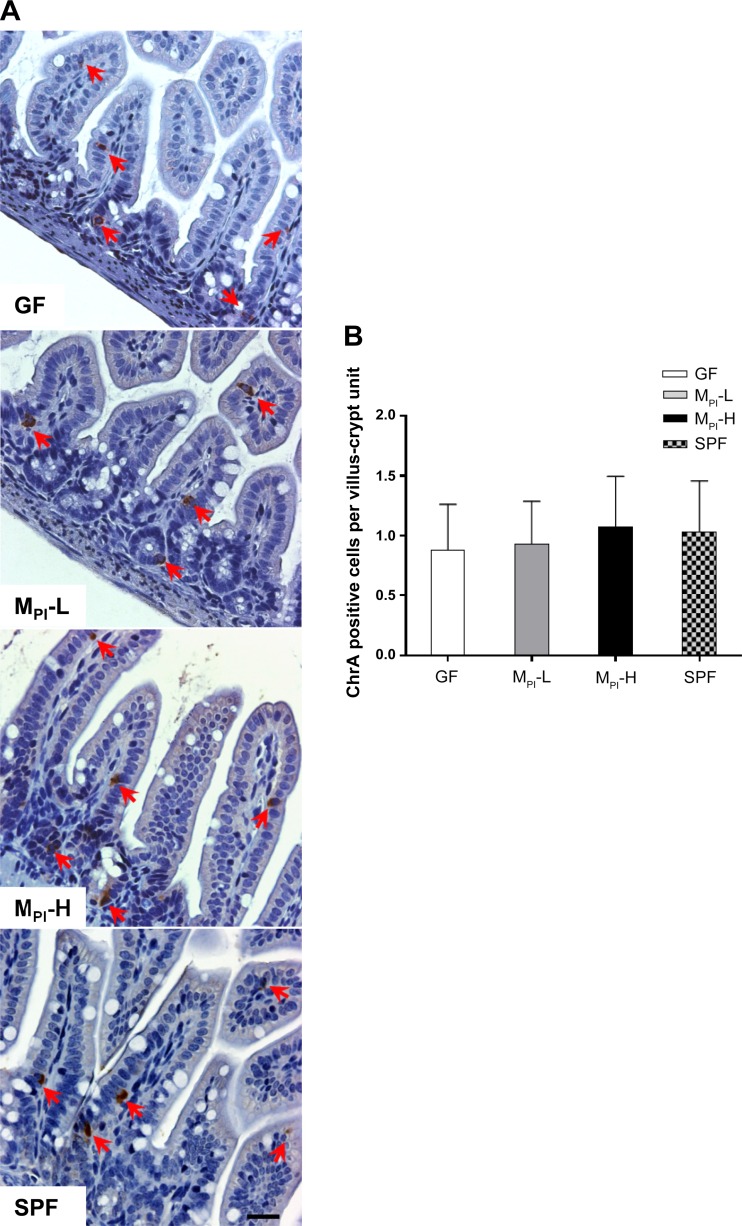
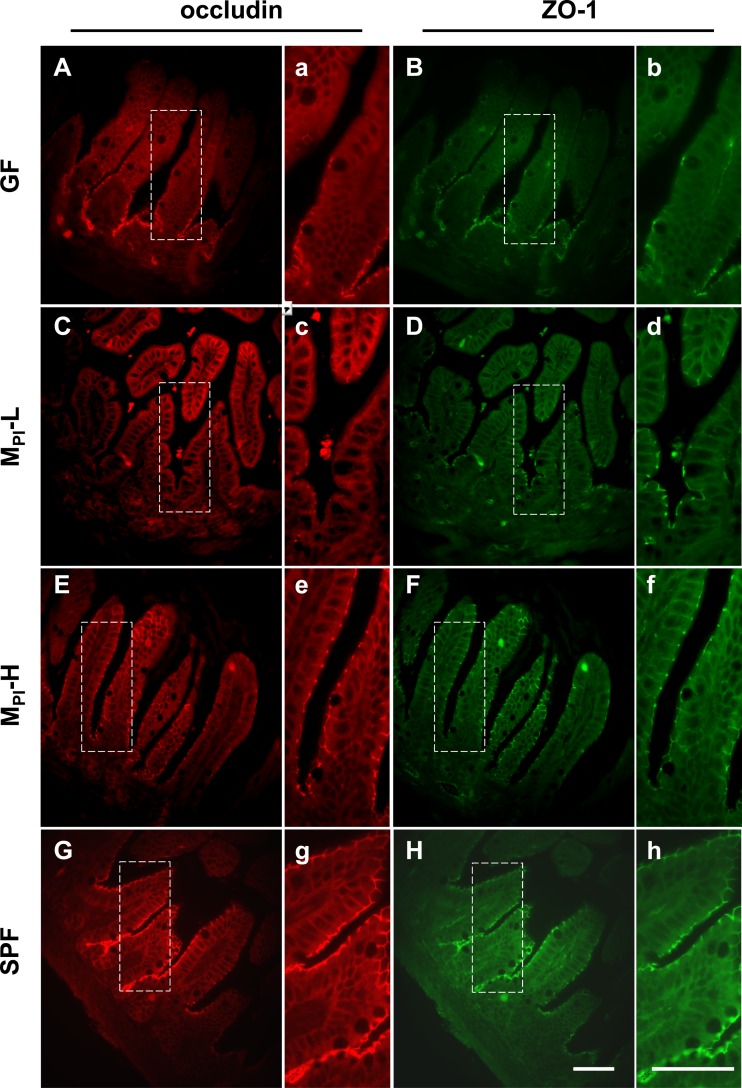
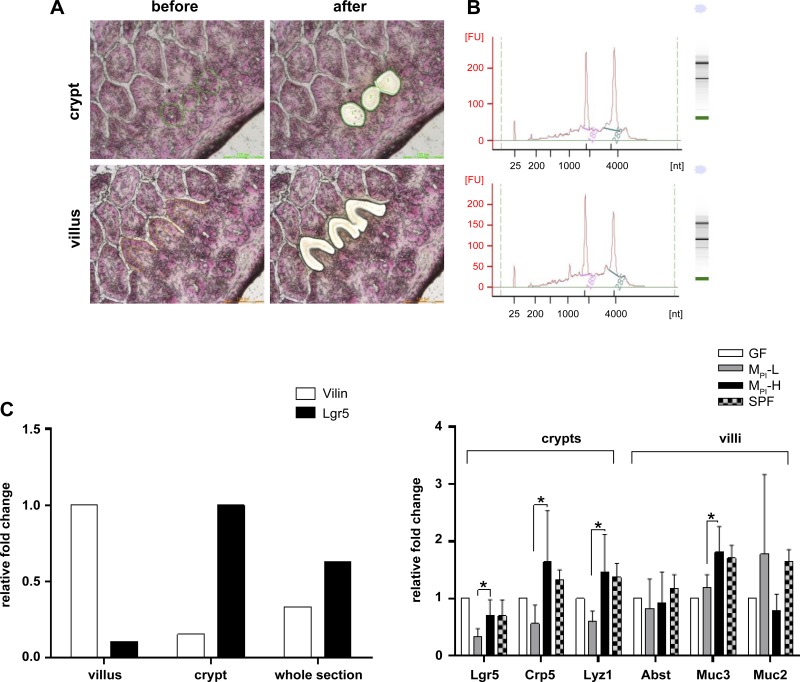
Development of the infant small intestine is influenced by bacterial colonization. To promote establishment of optimal microbial communities in preterm infants, knowledge of the beneficial functions of the early gut microbiota on intestinal development is needed. The purpose of this study was to investigate the impact of early preterm infant microbiota on host gut development using a gnotobiotic mouse model. Histological assessment of intestinal development was performed. The differentiation of four epithelial cell lineages (enterocytes, goblet cells, Paneth cells, enteroendocrine cells) and tight junction (TJ) formation was examined. Using weight gain as a surrogate marker for health, we found that early microbiota from a preterm infant with normal weight gain (MPI-H) induced increased villus height and crypt depth, increased cell proliferation, increased numbers of goblet cells and Paneth cells, and enhanced TJs compared with the changes induced by early microbiota from a poor weight gain preterm infant (MPI-L). Laser capture microdissection (LCM) plus qRT-PCR further revealed, in MPI-H mice, a higher expression of stem cell marker Lgr5 and Paneth cell markers Lyz1 and Cryptdin5 in crypt populations, along with higher expression of the goblet cell and mature enterocyte marker Muc3 in villus populations. In contrast, MPI-L microbiota failed to induce the aforementioned changes and presented intestinal characteristics comparable to a germ-free host. Our data demonstrate that microbial communities have differential effects on intestinal development. Future studies to identify pioneer settlers in neonatal microbial communities necessary to induce maturation may provide new insights for preterm infant microbial ecosystem therapeutics.

Keywords: development; gnotobiotic; gut; microbiota; preterm.


Figures

Fig. 1.
Fig. 1.
Effect of MPI transfaunation on intestine length, villus height, and crypt depth in ileum. A: total small intestine length was measured in GF, MPI-L, MPI-H, and SPF groups (n = 3–6 mice). B: mean ileal villus height was measured in GF, MPI-L, MPI-H, and SPF mice (n = 3–6 mice). C: mean crypt depth was measured in GF, MPI-L, MPI-H, and SPF mice (n = 3–6 mice). Results are presented as means ± SD. One-way ANOVA with post hoc Tukey's HSD test was used to compare the groups. *P < 0.05, **P < 0.01.
Fig. 2.
Fig. 2.
Effect of MPI transfaunation on cell proliferation and apoptosis in ileum. A: immunofluorescence detection of Ki-67 positive cells in ileum of GF, MPI-L, MPI-H, and SPF mice (n = 3–6 mice); arrows refer to the proliferative cells in the lower villus area. B: one-way ANOVA with post hoc Tukey's HSD test was used to compare the groups. *P < 0.05. C: representative TUNEL stained ileum sections in GF, MPI-L, MPI-H, and SPF mice (n = 3–6 mice); arrows refer to the TUNEL positive cells. Bar = 50 μm.
Fig. 3.
Fig. 3.
Effects of MPI transfaunation on goblet cell number in ileum. A: higher magnification views of PAS positive goblet cells in ileum villi and crypts in GF, MPI-L, MPI-H, and SPF mice. B: quantification of goblet cells in ileum in more than 10 fields per group (n = 4–6 mice). Results are presented as means ± SD. One-way ANOVA with post hoc Tukey's HSD test was used to compare the groups. **P < 0.01. Bar = 50 μm.
Fig. 4.
Fig. 4.
Effects of MPI transfaunation on Paneth cell number in ileum crypt. A: Paneth cells granules were revealed by phloxine-tartrazine staining in GF, MPI-L, MPI-H, and SPF mice (arrows) (n = 4–6 mice). B: quantification of the number of Paneth cells revealed a significant induction of Paneth cells at MPI-H crypts compared with MPI-L. Results are presented as means ± SD. One-way ANOVA with post hoc Tukey's HSD test was used to compare the groups. **P < 0.01. Bar = 50 μm.
Fig. 5.
Fig. 5.
Effects of MPI transfaunation on enteroendocrine cell number in ileum. A: chromogranin A (ChrA) staining for enteroendocrine cells in GF, MPI-L, MPI-H, and SPF ileum (red arrows) (n = 4–6 mice). B: quantification of the number of enteroendocrine cells in ileum revealed no difference among groups. Bar = 50 μm.
Fig. 6.
Fig. 6.
Effects of MPI transfaunation on TJ protein expression. In ileum from GF and MPI-L mice, occludin and ZO-1 staining was decreased with only residual staining remaining in the crypts region. In MPI-H and SPF mice ileum, staining of both proteins was continuous along the villus epithelium layer. Panels with small letters (a–h) represent higher magnification of the selected area (outlined with dashed line) in panels with capital letters (A–H). Sections from at least 3 mice were examined for each group. Bar = 50 μm.
Fig. 7.
Fig. 7.
Altered gene expression in isolated ileal villi or crypts by LCM. A: the morphology of the extracted villi and crypts during LCM. B: electropherograms of total RNAs from LCM isolated villus or crypt population. C: RT-PCR of cell compartment-specific genes (Villin for villus population and Lgr5 for crypt population) for cDNA made from total RNA isolated from LCM-extracted villus or crypt cells; total RNA from whole section was added as control. D: marker genes expression in villus or crypt in GF, MPI-L, MPI-H, and SPF groups were analyzed by normalizing to 18S RNA (n = 3–6 mice). Data are means ± SD. One-way ANOVA with post hoc Tukey's HSD test was used to compare the groups. *P < 0.05.

References

    1. Abrams GD, Bauer H, Sprinz H. Influence of the normal flora on mucosal morphology and cellular renewal in the ileum. A comparison of germ-free and conventional mice. Lab Invest 12: 355–364, 1963. - PubMed
    1. Banasaz M, Norin E, Holma R, Midtvedt T. Increased enterocyte production in gnotobiotic rats mono-associated with Lactobacillus rhamnosus GG. Appl Environ Microbiol 68: 3031–3034, 2002. - PMC - PubMed
    1. Cani PD, Possemiers S, Van de Wiele T, Guiot Y, Everard A, Rottier O, Geurts L, Naslain D, Neyrinck A, Lambert DM, Muccioli GG, Delzenne NM. Changes in gut microbiota control inflammation in obese mice through a mechanism involving GLP-2-driven improvement of gut permeability. Gut 58: 1091–1103, 2009. - PMC - PubMed
    1. Cario E, Gerken G, Podolsky DK. Toll-like receptor 2 controls mucosal inflammation by regulating epithelial barrier function. Gastroenterology 132: 1359–1374, 2007. - PubMed
    1. Cho I, Blaser MJ. The human microbiome: at the interface of health and disease. Nat Rev Genet 13: 260–270, 2012. - PMC - PubMed

Publication types

LinkOut - more resources