. 2016 Aug 5:7:12355.
doi: 10.1038/ncomms12355.

PTEN regulates EG5 to control spindle architecture and chromosome congression during mitosis

Affiliations

PTEN regulates EG5 to control spindle architecture and chromosome congression during mitosis

Jinxue He et al. Nat Commun. .

Abstract

Architectural integrity of the mitotic spindle is required for efficient chromosome congression and accurate chromosome segregation to ensure mitotic fidelity. Tumour suppressor PTEN has multiple functions in maintaining genome stability. Here we report an essential role of PTEN in mitosis through regulation of the mitotic kinesin motor EG5 for proper spindle architecture and chromosome congression. PTEN depletion results in chromosome misalignment in metaphase, often leading to catastrophic mitotic failure. In addition, metaphase cells lacking PTEN exhibit defects of spindle geometry, manifested prominently by shorter spindles. PTEN is associated and co-localized with EG5 during mitosis. PTEN deficiency induces aberrant EG5 phosphorylation and abrogates EG5 recruitment to the mitotic spindle apparatus, leading to spindle disorganization. These data demonstrate the functional interplay between PTEN and EG5 in controlling mitotic spindle structure and chromosome behaviour during mitosis. We propose that PTEN functions to equilibrate mitotic phosphorylation for proper spindle formation and faithful genomic transmission.


Figures
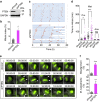
Figure 1
Figure 1. Depletion of PTEN leads to prolonged mitosis and defective chromosome congression.
(a) Knockdown of PTEN. HeLa cells were transduced with a lentiviral shPTEN plasmid and PTEN expression was evaluated by western blotting and compared with cells containing the shcoo2 control vector. (b) Mitotic arrest by PTEN depletion. HeLa cells with and without PTEN knockdown were immunofluorescent stained with phospho-histone H3 (Ser10). Mitotic index was determined by flow cytometry as percentage of phospho-histone H3-positive cells. Data from three independent experiments were analysed by two-tailed t-test and presented as means±s.e.m. *P<0.05. (c) Prolonged mitosis in cells lacking PTEN. Time-lapse fluorescent microscopy was performed for 80 h for phase succession analysis in H2B-GFP cells with or without shPTEN. Interphase (blue) and mitosis (red) time lengths were scored in cells with and without shPTEN, showing 20 representative cells in each group. (d) Prominent metaphase delay upon PTEN knockdown. Mitotic timing was measured for different phases in cells of each group that completed mitosis during our analysis (n=100). Data are presented as means±s.e.m. and processed by one-way analysis of variance (ANOVA) and Newman–Keuls multiple comparison test. *P<0.05; ***P<0.001; NS not significant (P>0.05). (e) Comparison of mitotic progression in H2B-GFP cells with or without shPTEN shown by representative still frames of live cell microscopy. PTEN depletion results in frequent chromosome misalignment (middle panel) and subsequent mitotic catastrophe (bottom panel). Arrowheads point to chromosomes that fail to congress at the metaphase plate. (f) Summary of the frequency of chromosome misalignment (upper) and mitotic catastrophe (lower) in PTEN-depleted cells as compared to control cells (n>90). Data were analysed by two-tailed t-test. **P<0.01; ***P<0.001.
Figure 2
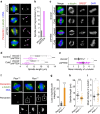
Figure 2. PTEN depletion impairs mitotic spindle geometry.
(a) Spindle pole fragmentation in PTEN knockdown cells. PTEN knockdown and control cells were immunofluorescent stained for mitotic spindle (α-tubulin, green) and spindle poles (pericentrin, red). Arrows point to fragmented spindle poles. Scale bar, 5 μm. (b) Summary of the frequency of mitotic cells exhibiting spindle pole fragmentation in cells with and without shPTEN. (c) Shortening of mitotic spindles by PTEN knockdown. HeLa cells with and without shPTEN were left at 37 °C or placed at 4 °C for 10 min before immunofluorescence of microtubules (α-tubulin, green) and kinetochores (CREST, red) with DAPI counterstaining of chromosomes. Scale bar, 5 μm. (d) Box-and-Whisker plot showing the distribution of spindle lengths in PTEN knockdown cells and control cells with and without cold treatment. Data (n>50 in each condition) were analysed by one-way analysis of variance (ANOVA) followed by Bonferroni's multiple comparisons. ***P<0.001. (e) Summary of α-tubulin mean intensity within the spindle area in cells with and without PTEN knockdown. (f) Immunofluorescence of mitotic spindles (α-tubulin, green) and spindle poles (pericentrin, red) in Pten+/+ and Pten−/− MEFs. Scale bar, 5 μm. (gi) The frequency of spindle pole fragmentation (g), spindle pole distance (h) and α-tubulin mean intensity (i) is compared in Pten+/+ and Pten−/− cells. Data are presented as means±s.e.m. and two-tailed t-test was used for data analysis. ***P<0.001.
Figure 3
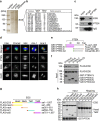
Figure 3. PTEN colocalizes and interacts with EG5 during mitosis.
(a) Identification of EG5 as a component of PTEN-associated protein complexes by pull-down assay. HeLa cells containing FLAG-HA-tagged PTEN or a control vector were synchronized by releasing from double thymidine block for 8 h before tandem affinity purification and separation on SDS-PAGE gel. A 125-kD band was analysed by mass spectrometry (MS) revealing EG5 as a potential PTEN-associated protein. (b) A list of matched peptides from MS analysis. (c) Validation of the interaction between PTEN and EG5 in vivo. HeLa cell lysates were immunoprecipitated with an anti-PTEN monoclonal antibody followed by detection of EG5 by Western blotting. The same blot was probed with a polyclonal PTEN antibody. (d) Co-localization between PTEN and EG5 during mitosis. HeLa cells were fixed for immunofluorescent staining of PTEN (green in overlay images) and EG5 (red) before confocal microscopic analysis of spatial relationship between PTEN and EG5 during the cell cycle. DNA was counterstained with DAPI. Scale bar, 10 μm. (e) GST-tagged PTEN constructs for mapping the EG5-binding domains. (f) In vitro binding assay with FLAG-tagged full-length EG5 and GST-tagged different domains of PTEN as indicated. (g) FLAG-tagged full-length EG5 and different fragments were constructed for mapping the PTEN-binding region. (h) EG5 and its fragments with a FLAG tag as indicated in g were expressed in HEK293T cells (left panel) for in vitro interaction with Sf9-expressed His-PTEN. Ni-NTA purified protein complexes were subjected to FLAG and PTEN immunoblotting (right panel).
Figure 4
Figure 4. PTEN regulates EG5 phosphorylation.
(a) PTEN treatment of EG5 for MS analysis of protein modification. Sf9-expressed FLAG-EG5 was incubated with or without His-tagged PTEN before FLAG immunopreciptation. The EG5 bands were excised from coommassie-stained gel for MS analysis of potential modification alterations. (b) A peptide of EG5 from the region aa919-aa929 identified by MS showing reduced phosphorylation at Thr926 in the PTEN-treated sample. (c) Quantification of phosphorylation at Thr926 in PTEN-treated and untreated samples. (d) Reduction of EG5 phosphorylation at Thr926 by PTEN. FLAG-EG5 treated with and without PTEN as prepared as in a was subjected to FLAG immunoprecipitation followed by immunoblotting analysis of EG5 phosphorylation using a site-specific (Thr926) phospho-EG5 antibody. (e) Elevation of EG5 phosphorylation at Thr926 in Pten null cells. Pten+/+ and Pten−/− MEFs were analysed for EG5 phosphorylation and abundance by immunoblotting. (f) HeLa cells containing shPTEN or control shcoo2 were released from double thymidine block (DTB) for different periods of time followed by immunoblotting analysis of EG5 phospohrylation at Thr926. The same blot was probed with EG5 antibody to show EG5 expression levels. β-Actin was used as a loading control. (g) Dose-dependent reduction of EG5 phosphorylation by PTEN in vitro. Sf9-expressed His-PTEN protein was purified using a Ni-NTA agarose column. FLAG-EG5 expressed in Sf9 cells was immunoprecipitated with anti-FLAG M2 beads and incubated with increasing amounts of His-PTEN proteins, followed by western blot analysis of EG5 phosphorylation. The same blot was probed with EG5 antibody to show EG5 levels loaded in each lane. (h) Phosphatase-dependent reduction of EG5 phosphorylation by PTEN. His-PTEN proteins (including wild type and two mutants forms, C124S and G129E) were produced in Sf9 cells and purified using a Ni-NTA agarose column. FLAG-EG5 was incubated with equal amounts of His-PTEN proteins before examination of EG5 phosphorylation. Protein input of EG5 and His-PTEN (wild type and two mutants) is shown in the middle and lower panels from re-probing of the same blot with anti-EG5 antibody. (i) Reduction of EG5 phosphorylation by PTEN in phosphatase-dependent manner. Pten−/− MEFs were transfected with vectors encoding FLAG-tagged wild-type PTEN or the phosphatase-deficient PTEN mutants PTENC124S and PTENG129E, before immunoblotting assessment of EG5 phosphorylation at Thr926. The expression of EG5, PTEN (wild type as well as two phosphatase-deficient mutants) and β-actin was then evaluated by reblotting with corresponding antibodies.
Figure 5
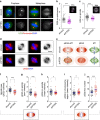
Figure 5. PTEN depletion causes aberrant distribution of EG5 on the mitotic spindle apparatus.
(a) Co-immunofluorescence of EG5 (green) and pericentrin (red) showing reduced recruitment of EG5 to centrosomes (prophase) and spindles (metaphase) in PTEN knockdown cells. Gray scale of EG5 staining is also shown. Arrow points to aberrant EG5 enrichment in a region near the spindle pole. Scale bar, 5 μm. (b,c) Mean intensities of EG5 in the prophase centrosome region (b) or the metaphase spindle region (c) were measured as indicated in the upper-right corner of the scatter plots. (d,e) Immunofluorescence of phosphorylated form of EG5 (red). Scale bar, 5 μm. Note that PTEN knockdown cells lose a signal gradient along the spindle axis but exhibit an aberrant enrichment of phospho-EG5 in the spindle midzone, as depicted in the schemas (e). (fh) Scatter dot plots summarizing the spindle area outlined by phospho-EG5 (f), sum intensity and mean intensity of phospho-EG5 in the spindle area (g,h). (i,j) Summary of phospho-EG5 mean intensity and foci number in the spindle midzone. Data are presented as means±s.e.m. and analysed by two-tailed t-test. *P<0.05; ***P<0.001.
Figure 6
Figure 6. Phospho-mimetic EG5 imitates PTEN deficiency to impair chromosome congression and spindle geometry.
(a) Phospho-mimetic EG5T926D causes prolonged prometaphase and metaphase. Time-lapse microscopy was used to monitor mitotic progression in GFP-H2B cells transfected with the T926D mutant of EG5 or a control plasmid. Time durations of prometaphase, metaphase and anaphase were quantified in cells that completed mitosis (n>80). (b) Frequencies of different types of mitotic errors including chromososme misalignment and catastrophic mitotic failure were scored in cells with and without EG5T926D (n>80 for each group). (c) HeLa cells with or without ectopic EG5T926D were immunostained with EG5 (green) and pericentrin (red). Arrows point to regional aberrant enrichment of EG5 near the spindle pole and arrowheads indicate enhanced chromosome staining of EG5. Scale bar, 5 μm. (d) Shorter mitotic spindles in EG5T926D-expressing cells. Cells with and without ectopic EG5T926D were cold-treated for 10 min before immunofluorescence of microtubules (α-tubulin, green) and kinetochores (CREST, red). Scale bar, 5 μm. (e) Scatter dot plots showing the distribution of spindle lengths in control cells and EG5T926D-expressing cells with and without cold treatment. Data (n>60 in each condition) were analysed with one-way analysis of variance (ANOVA) followed by Bonferroni's multiple comparisons. ***P<0.001. (f) Mitotic spindle pole fragmentation caused by EG5T926D, shown by immunofluorescence of metaphase spindles (α-tubulin, green) and spindle poles (pericentrin, red). Scale bar, 5 μm. (g) Quantification of spindle pole fragmentation (n=100) in the presence and absence of EG5T926D. Data are presented as means±s.e.m. and analysed by two-tailed t-test. **P<0.01.
Figure 7
Figure 7. Shortened mitotic spindles in Pten-deficient cells can be rescued by both protein phosphatase-proficient PTEN and phospho-dead EG5.
(a) Ectopic expression of wild type and phosphatase-deficient PTEN in Pten null cells. Akt phosphorylation was also shown to verify the lack of lipid phosphatase activity of PTEN mutants C124S and G129E. (b,c) The spindle length and pole integrity were analysed in Pten−/− cells transfected with PTEN, PTENC124S or PTENG129E as indicated in a. Data are presented as means±s.e.m. and analysed by one-way analysis of variance (ANOVA) followed by Dunnett's multiple comparison tests. (d) Pten−/− cells were transfected with EG5T926A, a phospho-dead mutant of EG5, or an empty vector (Control). Cells were subjected to immunofluorescent analysis of metaphase spindle pole distances. Pten+/+ cells were also included as a control. Data are presented as means±s.e.m. and analysed by one-way ANOVA followed by Turkey's multiple comparisons. (e) Pten−/− cells with and without EG5T926A were analysed for mitotic spindle pole fragmentation. Data were analysed by unpaired two-tailed t test. *P<0.05; **P<0.01; ***P<0.001.

Similar articles

Cited by

References

    1. Yin Y. & Shen W. H. PTEN: a new guardian of the genome. Oncogene 27, 5443–5453 (2008). - PubMed
    1. Maser R. S. et al.. Chromosomally unstable mouse tumours have genomic alterations similar to diverse human cancers. Nature 447, 966–971 (2007). - PMC - PubMed
    1. Puc J. et al.. Lack of PTEN sequesters CHK1 and initiates genetic instability. Cancer Cell 7, 193–204 (2005). - PubMed
    1. Shen W. H. et al.. Essential role for nuclear PTEN in maintaining chromosomal integrity. Cell 128, 157–170 (2007). - PubMed
    1. Chen Z. H. et al.. PTEN Interacts with Histone H1 and Controls Chromatin Condensation. Cell Rep. 8, 2003–2014 (2014). - PMC - PubMed

Publication types