Review
. 2017 Jan;27(1):1-11.
doi: 10.1016/j.tcm.2016.05.008. Epub 2016 May 24.

Atrial fibrillation driver mechanisms: Insight from the isolated human heart

Affiliations
Review

Atrial fibrillation driver mechanisms: Insight from the isolated human heart

Thomas A Csepe et al. Trends Cardiovasc Med. 2017 Jan.

Abstract

Although there have been great technological advances in the treatment of atrial fibrillation (AF), current therapies remain limited due to a narrow understanding of AF mechanisms in the human heart. This review will highlight our recent studies on explanted human hearts where we developed and employed a novel functional-structural mapping approach by integrating high-resolution simultaneous endo-epicardial and panoramic optical mapping with 3D gadolinium-enhanced MRI to define the spatiotemporal characteristics of AF drivers and their structural substrates. The results allow us to postulate that the primary mechanism of AF maintenance in human hearts is a limited number of localized intramural microanatomic reentrant AF drivers anchored to heart-specific 3D fibrotically insulated myobundle tracks, which may remain hidden to clinical single-surface electrode mapping. We suggest that ex vivo human heart studies, by using an integrated 3D functional and structural mapping approach, will help to reveal defining features of AF drivers as well as validate and improve clinical approaches to detect and target these AF drivers in patients with cardiac diseases.

Keywords: Atrial fibrillation; Catheter ablation; Fibrosis; Intramural microanatomic reentry; Optical mapping; Reentrant driver.


Figures

Figure 1
Figure 1. AF Driver Mechanism: Intramural Microanatomic Reentry Explains Mixed Results from Clinical Studies
A. Human AF driven by intramural reentry projected differently on epicardial and endocardial surfaces. B. Clinical studies showing the uncertainty of AF driver mechanisms: endocardial mapping shows localized stable reentrant drivers; epicardial mapping shows unstable breakthrough. AF – atrial fibrillation; Endo – endocardium; Epi – epicardium; FIRM – focal impulse and rotor modulation; IVC/SVC – inferior and superior vena cava; RAA/LAA – right and left atrial appendages. From Hansen et al.(7), Narayan et al(5) and Allessie and de Groot(4), with permission.
Figure 2
Figure 2. Dual-Sided and Panoramic Mapping Shows Transmural Activation Delay due to Atrial Structure
A. Schematic of dual-sided and panoramic optical mapping of the human atria. B. (1st row left to right) Sub-Endo and sub-Epi activation maps during 500ms pacing; Transmural activation delay map. (2nd row left to right) 3D GE-MRI showing locations 1–4 on tissue; GE-MRI section showing atrial thickness along preferential conduction. C. Curves showing maximum transmural activation delays vs. pacing cycle length with beat-to-beat variation observed at cycle length <250ms. D. Graph showing significant increase in transmural activation delay during faster pacing and AF in the RA. Abbreviations as in Figure 1. GE-MRI – gadolinium enhanced MRI; RA – right atrium. From Hansen et al.(7), with permission.
Figure 3
Figure 3. Microanatomic tracks of Reentrant AF Drivers Resolved by Dual-Sided Optical Mapping and GE-MRI
A. Activation maps from panoramic (Left), sub-Endo (Middle), and sub-Epi (Right) cameras. Solid arrow and star show path of reentry and “breakthrough” point, respectively. B. GE-MRI showing fibrosis (white) distribution and location of reentrant AF driver (white arrow) C. 3D view of reentry track. D. Transmural activation delay map with reentrant pathway shown by green arrow. E. Locations of AF drivers from experiments in 6 RA. Individual atria are distinguished by color and drivers with the same color and region on Endo and Epi correspond to two visualizations of the same driver. Abbreviations as in Figure 1. TA – tricuspid annulus. From Hansen et al.(7), with permission.
Figure 4
Figure 4. Radio Frequency Ablation of Microanatomic Reentrant Track Confirms AF Driver Regions
Left: Activation map showing reentrant AF driver before targeted ablation. Middle: AF converted to macroreentrant atrial tachycardia (AT) after RFA. Right: Arrhythmia terminated and prevented by targeted RFA from the reentrant track to anatomical border. Abbreviations as in Figure 3. RFA – radio frequency ablation. From Hansen et al.(7), with permission.
Figure 5
Figure 5. Similarity of DF and AF Driver Patterns In Vivo and Ex vivo
A. Left: Ex vivo DF map during sustained AF and frequency power at 7.6Hz showing stable regions in intact human atria. Right: 3D micro-CT shows underlying atrial structure with main anatomic regions highlighted and AF driver locations shown by white arrows. Power frequency chart and optical action potentials (OAPs) from the left atrial roof, floor, and lateral right atrium denoted as 1 to 3, along with atrial ECG. B. In vivo dominant frequency map from consequent electrode recordings in patients with paroxysmal (Top) and permanent (Bottom) AF. Abbreviations as in Figure 1. LIPV/LSPV/RIPV/RSPV – left, right, superior, inferior pulmonary veins; PLA – posterior left atria; SAN – Sinoatrial node. From Zhao et al.(8) and Sanders(42) with permission.
Figure 6
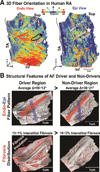
Figure 6. Structural Features of AF Reentrant Driver Regions
A. Endo and Epi 3D fiber orientations generated from GE-MRI imaging showing relative vertical orientations in blue and horizontal orientations in red. AF driver denoted by black arrow on Endo view, while Star denotes breakthrough visualization from Epi. B. (Top) Difference between fiber orientation of sub-Epi (blue) and sub-Endo (red) layers in the driver region is greater than in non-driver regions. Large red and blue arrows represent global average fiber angle of the epi and endo, respectively, in these specific driver and non-driver regions. (Bottom) Interstitial fibrosis (red) distribution for driver vs non-driver regions. AF driver shown by white arrow. Abbreviations as in Figure 3. From Hansen et al.(7), with permission.

Comment in

References

    1. Nishida K, Nattel S. Atrial fibrillation compendium: historical context and detailed translational perspective on an important clinical problem. Circ Res. 2014;114(9):1447–1452. - PubMed
    1. Wright M, Narayan SM. Ablation of atrial fibrillation. Trends Cardiovasc Med. 2015;25(5):409–419. - PMC - PubMed
    1. Narayan SM, Jalife J. CrossTalk proposal: Rotors have been demonstrated to drive human atrial fibrillation. J Physiol. 2014;592(15):3163–3166. - PMC - PubMed
    1. Allessie M, de GN. CrossTalk opposing view: Rotors have not been demonstrated to be the drivers of atrial fibrillation. J Physiol. 2014;592(15):3167–3170. - PMC - PubMed
    1. Narayan SM, Krummen DE, Shivkumar K, Clopton P, Rappel WJ, Miller JM. Treatment of atrial fibrillation by the ablation of localized sources: CONFIRM (Conventional Ablation for Atrial Fibrillation With or Without Focal Impulse and Rotor Modulation) trial. J Am Coll Cardiol. 2012;60(7):628–636. - PMC - PubMed

Publication types

MeSH terms