

PI-103 and Quercetin Attenuate PI3K-AKT Signaling Pathway in T- Cell Lymphoma Exposed to Hydrogen Peroxide
- PMID: 27494022
- PMCID: PMC4975451
- DOI: 10.1371/journal.pone.0160686
PI-103 and Quercetin Attenuate PI3K-AKT Signaling Pathway in T- Cell Lymphoma Exposed to Hydrogen Peroxide
Abstract
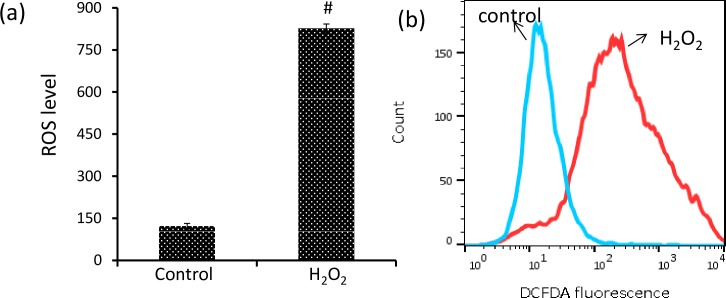
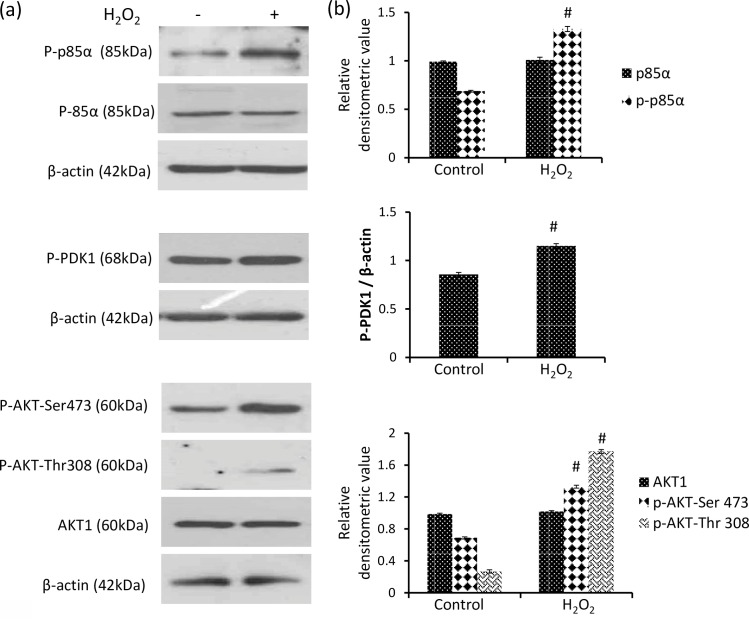
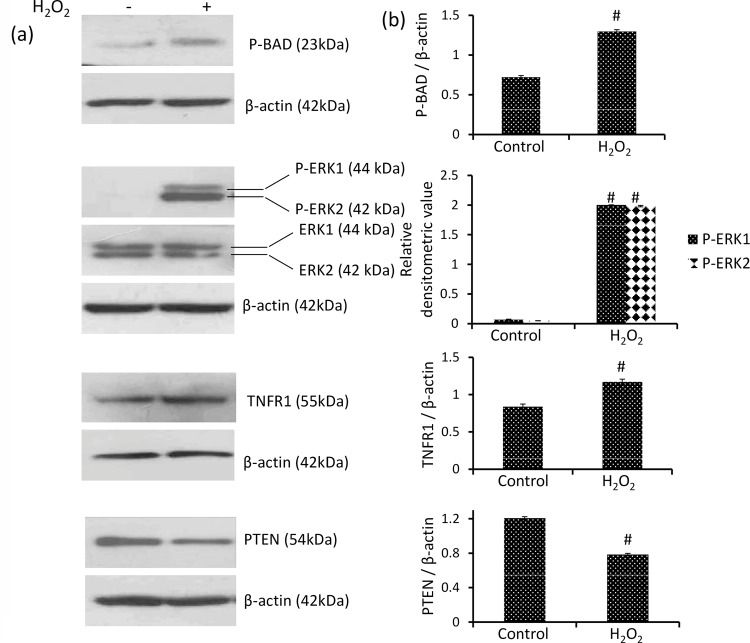
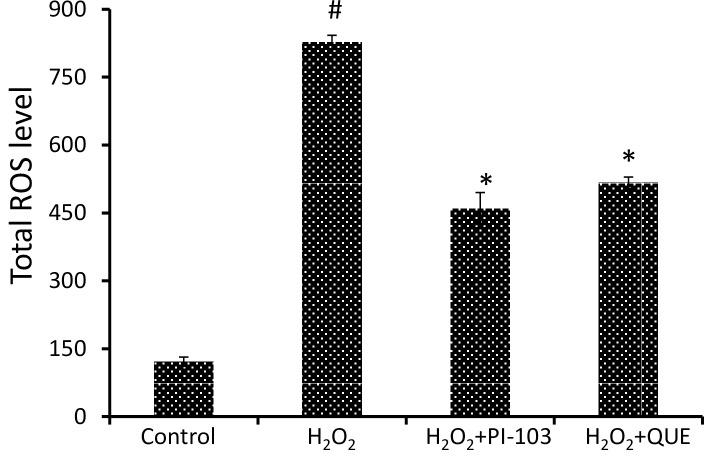
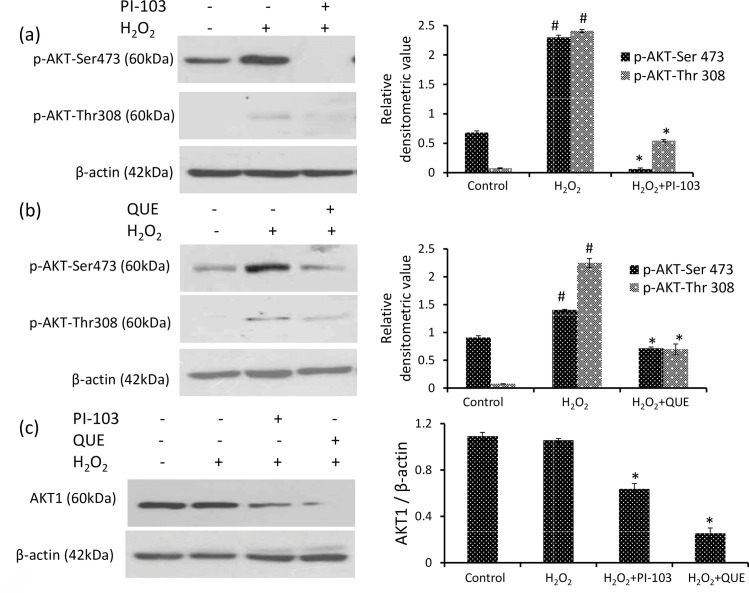
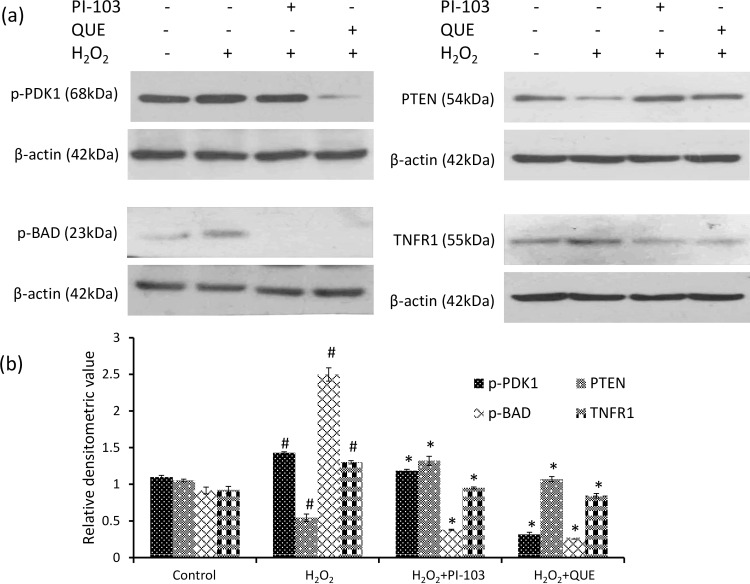
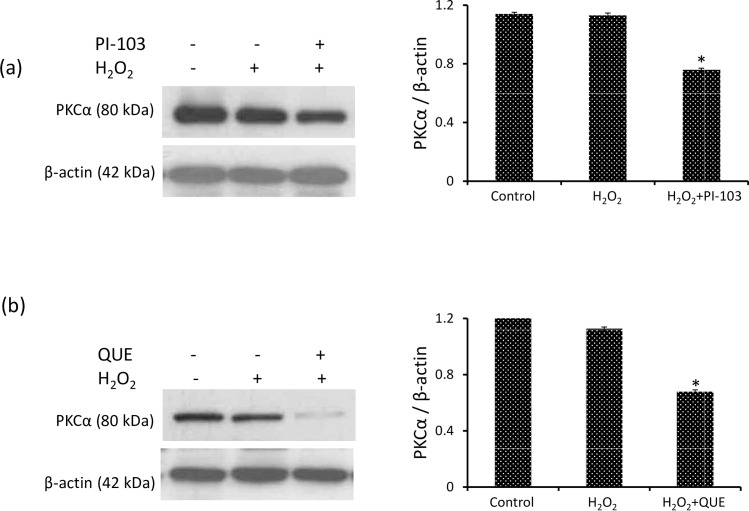
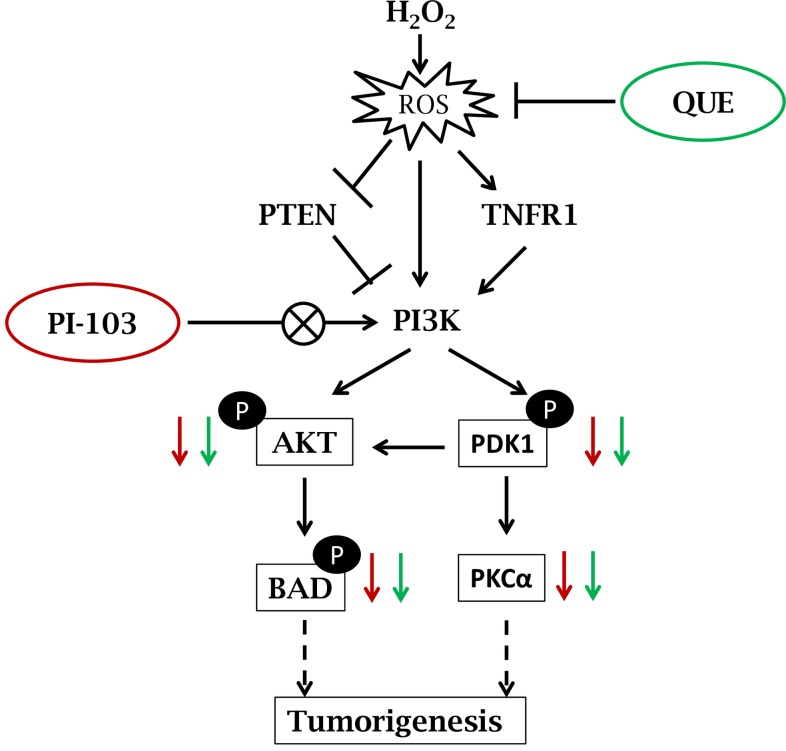
Phosphatidylinositol 3 kinase-protein kinase B (PI3K-AKT) pathway has been considered as major drug target site due to its frequent activation in cancer. AKT regulates the activity of various targets to promote tumorigenesis and metastasis. Accumulation of reactive oxygen species (ROS) has been linked to oxidative stress and regulation of signaling pathways for metabolic adaptation of tumor microenvironment. Hydrogen peroxide (H2O2) in this context is used as ROS source for oxidative stress preconditioning. Antioxidants are commonly considered to be beneficial to reduce detrimental effects of ROS and are recommended as dietary supplements. Quercetin, a ubiquitous bioactive flavonoid is a dietary component which has attracted much of interest due to its potential health-promoting effects. Present study is aimed to analyze PI3K-AKT signaling pathway in H2O2 exposed Dalton's lymphoma ascite (DLA) cells. Further, regulation of PI3K-AKT pathway by quercetin as well as PI-103, an inhibitor of PI3K was analyzed. Exposure of H2O2 (1mM H2O2 for 30min) to DLA cells caused ROS accumulation and resulted in increased phosphorylation of PI3K and downstream proteins PDK1 and AKT (Ser-473 and Thr-308), cell survival factors BAD and ERK1/2, as well as TNFR1. However, level of tumor suppressor PTEN was declined. Both PI-103 & quercetin suppressed the enhanced level of ROS and significantly down-regulated phosphorylation of AKT, PDK1, BAD and level of TNFR1 as well as increased the level of PTEN in H2O2 induced lymphoma cells. The overall result suggests that quercetin and PI3K inhibitor PI-103 attenuate PI3K-AKT pathway in a similar mechanism.
Conflict of interest statement
Figures
Similar articles
-
PI-103 attenuates PI3K-AKT signaling and induces apoptosis in murineT-cell lymphoma.Leuk Lymphoma. 2017 May;58(5):1153-1161. doi: 10.1080/10428194.2016.1225207. Epub 2016 Sep 23. Leuk Lymphoma. 2017. PMID: 27658642
-
Quercetin regresses Dalton's lymphoma growth via suppression of PI3K/AKT signaling leading to upregulation of p53 and decrease in energy metabolism.Nutr Cancer. 2015;67(2):354-63. doi: 10.1080/01635581.2015.990574. Epub 2015 Feb 6. Nutr Cancer. 2015. PMID: 25658812
-
Protection afforded by quercetin against H2O2-induced apoptosis on PC12 cells via activating PI3K/Akt signal pathway.J Recept Signal Transduct Res. 2016;36(1):98-102. doi: 10.3109/10799893.2015.1049363. Epub 2015 Sep 28. J Recept Signal Transduct Res. 2016. PMID: 26414235
-
New insights into Notch1 regulation of the PI3K-AKT-mTOR1 signaling axis: targeted therapy of γ-secretase inhibitor resistant T-cell acute lymphoblastic leukemia.Cell Signal. 2014 Jan;26(1):149-61. doi: 10.1016/j.cellsig.2013.09.021. Epub 2013 Oct 16. Cell Signal. 2014. PMID: 24140475 Review.
-
A Comprehensive Analysis and Anti-Cancer Activities of Quercetin in ROS-Mediated Cancer and Cancer Stem Cells.Int J Mol Sci. 2022 Oct 4;23(19):11746. doi: 10.3390/ijms231911746. Int J Mol Sci. 2022. PMID: 36233051 Free PMC article. Review.
Cited by
-
Curcumin pretreatment prevents hydrogen peroxide-induced oxidative stress through enhanced mitochondrial function and deactivation of Akt/Erk signaling pathways in rat bone marrow mesenchymal stem cells.Mol Cell Biochem. 2018 Jun;443(1-2):37-45. doi: 10.1007/s11010-017-3208-5. Epub 2017 Oct 20. Mol Cell Biochem. 2018. PMID: 29052798
-
Potential Therapeutic Targets of Quercetin, a Plant Flavonol, and Its Role in the Therapy of Various Types of Cancer through the Modulation of Various Cell Signaling Pathways.Molecules. 2021 Mar 1;26(5):1315. doi: 10.3390/molecules26051315. Molecules. 2021. PMID: 33804548 Free PMC article. Review.
-
Cytoprotective effects of mild plasma-activated medium against oxidative stress in human skin fibroblasts.Sci Rep. 2017 Feb 7;7:42208. doi: 10.1038/srep42208. Sci Rep. 2017. PMID: 28169359 Free PMC article.
-
Temporal Effects of Quercetin on Tight Junction Barrier Properties and Claudin Expression and Localization in MDCK II Cells.Int J Mol Sci. 2019 Oct 2;20(19):4889. doi: 10.3390/ijms20194889. Int J Mol Sci. 2019. PMID: 31581662 Free PMC article.
-
Systematic Oxidative Stress Indexes Associated with the Prognosis in Patients with T Lymphoblastic Lymphoma/Leukemia.Oxid Med Cell Longev. 2022 Aug 4;2022:2679154. doi: 10.1155/2022/2679154. eCollection 2022. Oxid Med Cell Longev. 2022. PMID: 35965687 Free PMC article.
References
-
- Osaki M, Oshimura M, Ito H. PI3K-Akt pathway: its functions and alterations in human cancer. Apoptosis. 2004; 9(6):667–76. - PubMed
MeSH terms
Substances
LinkOut - more resources
Full Text Sources
Other Literature Sources
Molecular Biology Databases
Research Materials
Miscellaneous
