

Predictive Big Data Analytics: A Study of Parkinson's Disease Using Large, Complex, Heterogeneous, Incongruent, Multi-Source and Incomplete Observations
- PMID: 27494614
- PMCID: PMC4975403
- DOI: 10.1371/journal.pone.0157077
Predictive Big Data Analytics: A Study of Parkinson's Disease Using Large, Complex, Heterogeneous, Incongruent, Multi-Source and Incomplete Observations
Abstract
Background: A unique archive of Big Data on Parkinson's Disease is collected, managed and disseminated by the Parkinson's Progression Markers Initiative (PPMI). The integration of such complex and heterogeneous Big Data from multiple sources offers unparalleled opportunities to study the early stages of prevalent neurodegenerative processes, track their progression and quickly identify the efficacies of alternative treatments. Many previous human and animal studies have examined the relationship of Parkinson's disease (PD) risk to trauma, genetics, environment, co-morbidities, or life style. The defining characteristics of Big Data-large size, incongruency, incompleteness, complexity, multiplicity of scales, and heterogeneity of information-generating sources-all pose challenges to the classical techniques for data management, processing, visualization and interpretation. We propose, implement, test and validate complementary model-based and model-free approaches for PD classification and prediction. To explore PD risk using Big Data methodology, we jointly processed complex PPMI imaging, genetics, clinical and demographic data.
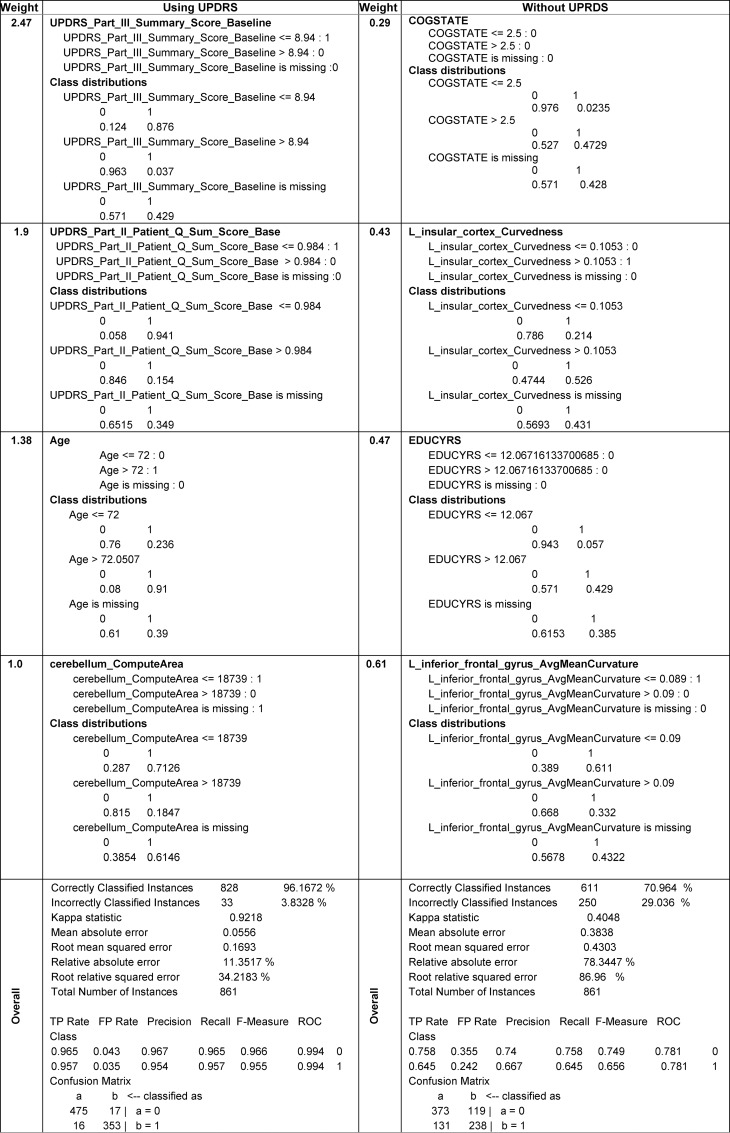
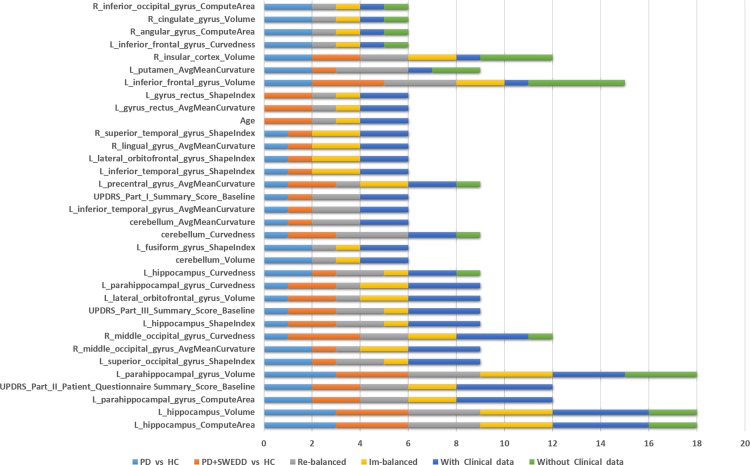
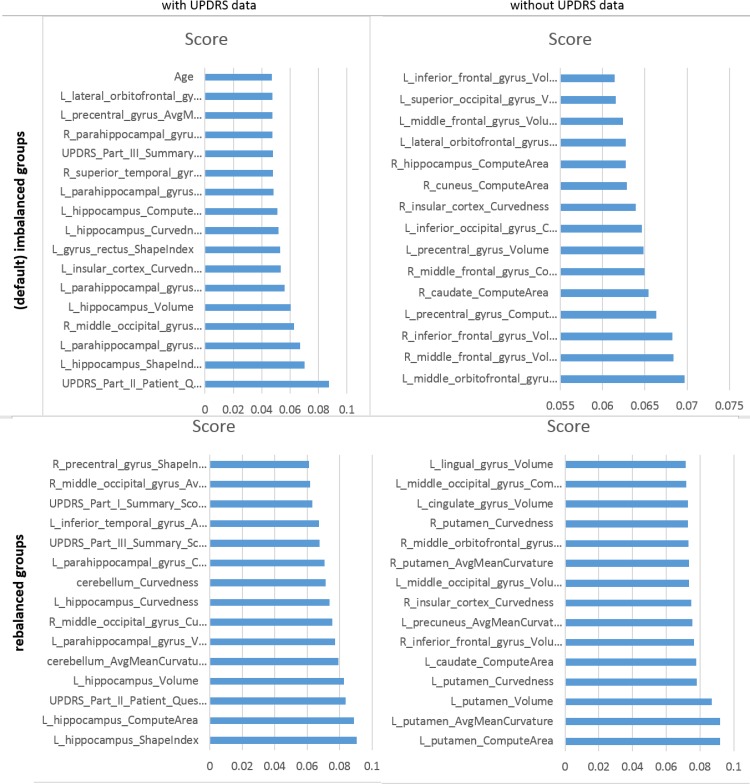
Methods and findings: Collective representation of the multi-source data facilitates the aggregation and harmonization of complex data elements. This enables joint modeling of the complete data, leading to the development of Big Data analytics, predictive synthesis, and statistical validation. Using heterogeneous PPMI data, we developed a comprehensive protocol for end-to-end data characterization, manipulation, processing, cleaning, analysis and validation. Specifically, we (i) introduce methods for rebalancing imbalanced cohorts, (ii) utilize a wide spectrum of classification methods to generate consistent and powerful phenotypic predictions, and (iii) generate reproducible machine-learning based classification that enables the reporting of model parameters and diagnostic forecasting based on new data. We evaluated several complementary model-based predictive approaches, which failed to generate accurate and reliable diagnostic predictions. However, the results of several machine-learning based classification methods indicated significant power to predict Parkinson's disease in the PPMI subjects (consistent accuracy, sensitivity, and specificity exceeding 96%, confirmed using statistical n-fold cross-validation). Clinical (e.g., Unified Parkinson's Disease Rating Scale (UPDRS) scores), demographic (e.g., age), genetics (e.g., rs34637584, chr12), and derived neuroimaging biomarker (e.g., cerebellum shape index) data all contributed to the predictive analytics and diagnostic forecasting.
Conclusions: Model-free Big Data machine learning-based classification methods (e.g., adaptive boosting, support vector machines) can outperform model-based techniques in terms of predictive precision and reliability (e.g., forecasting patient diagnosis). We observed that statistical rebalancing of cohort sizes yields better discrimination of group differences, specifically for predictive analytics based on heterogeneous and incomplete PPMI data. UPDRS scores play a critical role in predicting diagnosis, which is expected based on the clinical definition of Parkinson's disease. Even without longitudinal UPDRS data, however, the accuracy of model-free machine learning based classification is over 80%. The methods, software and protocols developed here are openly shared and can be employed to study other neurodegenerative disorders (e.g., Alzheimer's, Huntington's, amyotrophic lateral sclerosis), as well as for other predictive Big Data analytics applications.
Conflict of interest statement
Figures

References
-
- Amiri S, Clarke B, Clarke J. Clustering categorical data via ensembling dissimilarity matrices. arXiv preprint arXiv:150607930. 2015.
-
- Dinov ID, Petrosyan Petros, Liu Zhizhong, Eggert Paul, Zamanyan Alen, Torri Federica, Macciardi Fabio, Hobel Sam, Moon Seok Woo, Sung Young Hee, Toga AW. The perfect neuroimaging-genetics-computation storm: collision of petabytes of data, millions of hardware devices and thousands of software tools. Brain Imaging and Behavior. 2014;8(2):311–22. 10.1007/s11682-013-9248-x - DOI - PMC - PubMed
-
- Walter C. Kryder's law. Scientific American. 2005;293(2):32–3. - PubMed
-
- Mollick E. Establishing Moore's law. Annals of the History of Computing, IEEE. 2006;28(3):62–75.
MeSH terms
Grants and funding
LinkOut - more resources
Full Text Sources
Other Literature Sources
Medical
