. 2016 Aug 30;7(35):56676-56689.
doi: 10.18632/oncotarget.10996.

Next generation multi-scale biophysical characterization of high precision cancer particle radiotherapy using clinical proton, helium-, carbon- and oxygen ion beams

Affiliations

Next generation multi-scale biophysical characterization of high precision cancer particle radiotherapy using clinical proton, helium-, carbon- and oxygen ion beams

Ivana Dokic et al. Oncotarget. .

Abstract

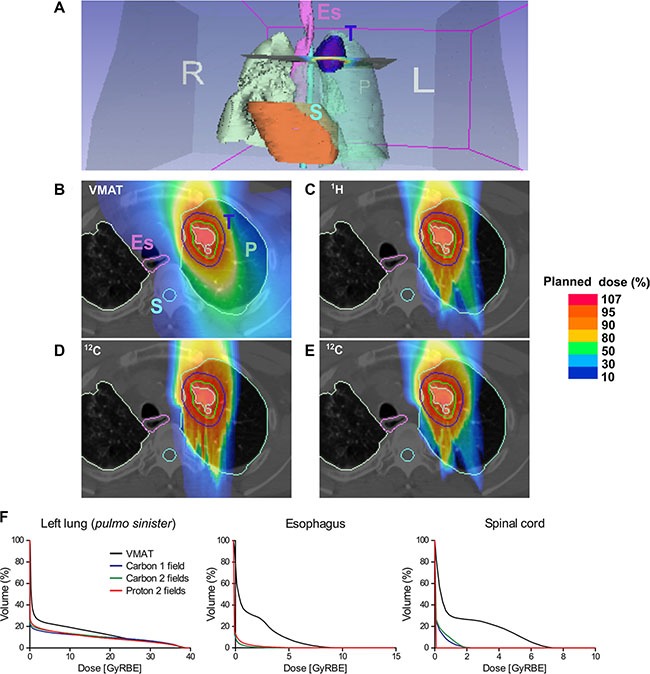
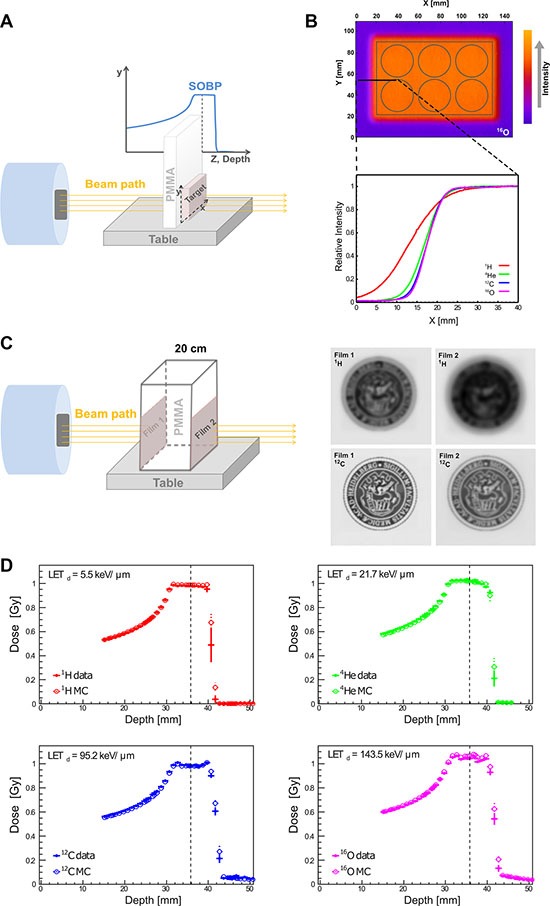
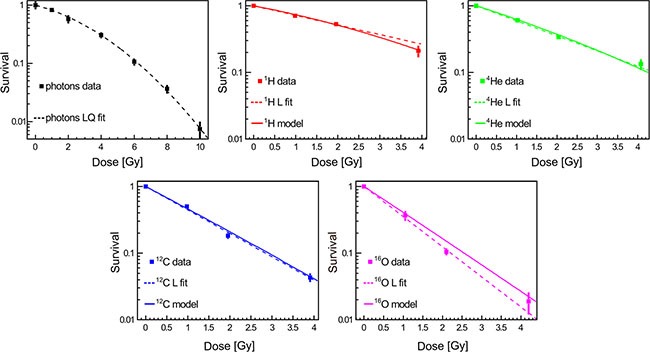
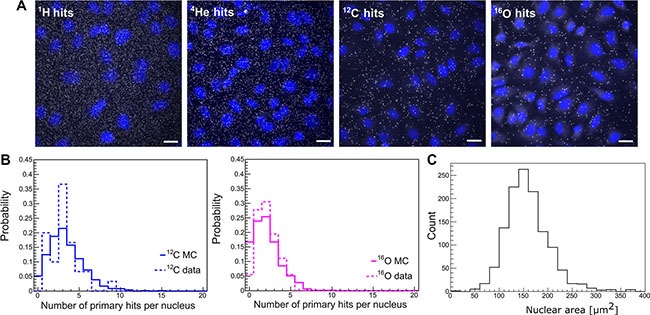
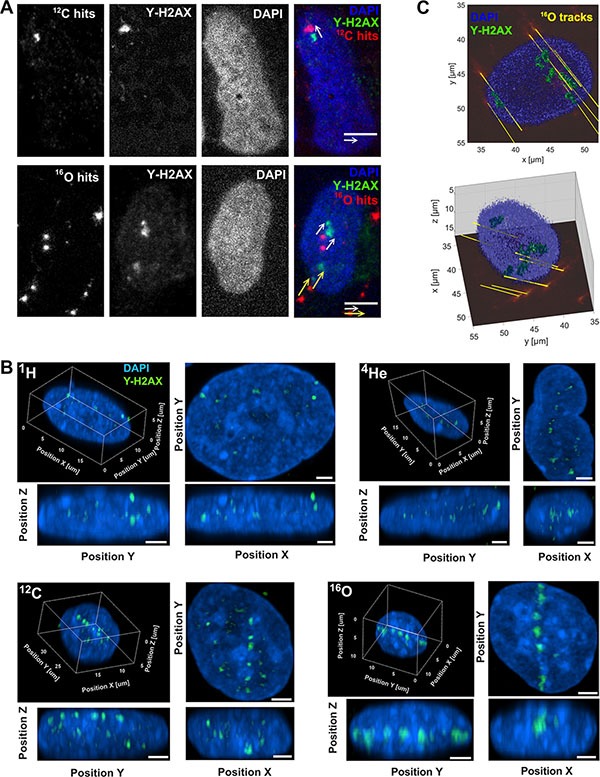
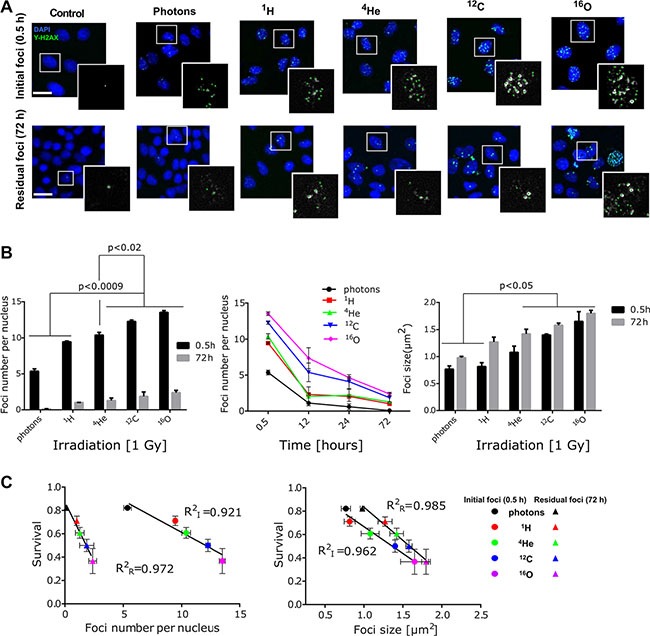
The growing number of particle therapy facilities worldwide landmarks a novel era of precision oncology. Implementation of robust biophysical readouts is urgently needed to assess the efficacy of different radiation qualities. This is the first report on biophysical evaluation of Monte Carlo simulated predictive models of prescribed dose for four particle qualities i.e., proton, helium-, carbon- or oxygen ions using raster-scanning technology and clinical therapy settings at HIT. A high level of agreement was found between the in silico simulations, the physical dosimetry and the clonogenic tumor cell survival. The cell fluorescence ion track hybrid detector (Cell-Fit-HD) technology was employed to detect particle traverse per cell nucleus. Across a panel of radiobiological surrogates studied such as late ROS accumulation and apoptosis (caspase 3/7 activation), the relative biological effectiveness (RBE) chiefly correlated with the radiation species-specific spatio-temporal pattern of DNA double strand break (DSB) formation and repair kinetic. The size and the number of residual nuclear γ-H2AX foci increased as a function of linear energy transfer (LET) and RBE, reminiscent of enhanced DNA-damage complexity and accumulation of non-repairable DSB. These data confirm the high relevance of complex DSB formation as a central determinant of cell fate and reliable biological surrogates for cell survival/ RBE. The multi-scale simulation, physical and radiobiological characterization of novel clinical quality beams presented here constitutes a first step towards development of high precision biologically individualized radiotherapy.

Keywords: DNA-double strand breakages; biophysical hybrid detectors; complex DNA damage; monte carlo simulations; radiobiology.


Conflict of interest statement

The authors declare that no competing interests exist.

Figures

Figure 1
Figure 1. Comparative simulation of radiotherapy plans in a lung cancer patient
(A) Overview; anatomical tumor localization. Dose distribution of (B) reference (photon) irradiation using Volumetric Intensity Modulated Arc Therapy (VMAT); raster scanning proton therapy with (C) two fields, (D) carbon therapy with a single field, (E) carbon therapy with two fields. A relatively larger volume including esophagus (Es) and spinal cord (S) receives radiotherapy after VMAT compared to particle therapies. (F) Dose-volume histograms (DVH) confirm superior sparing of different organs at risk (OAR) using the particle therapy plans compared to VMAT. P: lung (Pulmo), E: esophagus (pink contour), S: spinal cord (light blue contour), T: tumor (dark blue contour), GTV (red contour), CTV (green contour), PTV (light green contour). L: left; R: right. Percentage of a planned dose is displayed using a color bar.
Figure 2
Figure 2. Physical depth-dose distribution and lateral scattering
(A) Schematic presentation of irradiation setup. To mimic the clinical situation of tumor treatment at a certain tissue depth, PMMA was employed as water/tissue density equivalent and placed in front of the target (cell culture plate). (B) The corresponding intensity distribution of oxygen beam for a six well plate is presented according to the Fire Lookup Table, where the lowest intensity is presented in purple color, and highest intensity in orange color. The normalized lateral intensity distribution (0–40 mm along X-axis, black solid line) of all four investigated particles is shown (bottom). As the beam mass increases, the steepness of the lateral distribution increases, due to the reduced scattering for heavier ions. (C) Schematic presentation of lateral scattering in proton and carbon ion beams. Left panel presents the irradiation setup used to demonstrate lateral scattering for proton and carbon beams. Right panel are the scanned images of irradiated dosimetric films. (D) High correlation between the MC simulation (empty circles) vs. physical dosimetry (data, filled circles) of depth-dose distributions in water phantom for all four investigated particles. The vertical dashed lines mark the reference depth where the cells were located for subsequent biophysical readouts and the corresponding LET is provided for each particle: proton (1H), helium (4He), carbon (12C), oxygen (16O) irradiation beams.
Figure 3
Figure 3. Clonogenic cell survival as a function of dose and radiation quality
Data represent mean ± SEM of three independent experiments, each performed in triplicates. The dashed lines represent the linear-quadratic (LQ) or linear (L) fits of experimental data that strongly correlated with model simulations.
Figure 4
Figure 4. Particle hit per cell nucleus
Cell-Fit-HD was employed to detect the number of primary ion hits per cell nucleus. (A) White dots represent particle traversals and blue areas the cell nuclei (DAPI stained). Scale bar: 20 μm. (B) A high correlation between experimental (3.2 ± 0.3 for 12C-beams and 2.2 ± 0.2 for 16O-beams) vs. simulation (3.4 for 12C-beams and 2.1 for 16O-beams) based nuclear hit distribution was found. Y-axis represents the probability of particle hits per nucleus. (C) Nuclear area size distribution. Images of DAPI-stained nuclei were obtained. To measure nuclear area the Z-stack images of DAPI staining were background subtracted using ImageJ's Rolling ball radius. The images were further maximum Z-projected and segmented using Median filter to more precisely define the nuclear border. The images were thresholded and nuclear area was finally measured using the Analyze Particles tools. All the image processing was performed automatically using the ImageJ macro with constant settings (n = 1239).
Figure 5
Figure 5. Correlation of particle hits and DNA-damage
(A) Representative 16O and 12C particle traversals (physical compartment, FNTD, red pseudocolor) projection to the corresponding nuclear (DAPI, blue) DNA-damage (DSB) marked by γ-H2AX foci (green) in the biological compartment. The distances (~ 3 μm) between the hits and foci are a consequence of a movement of the cell nuclei. Scale bar: 5 μm. (B) 3D visualization of γ-H2AX foci (green) formation along particle traversals (trajectories) more clearly visible after high LET irradiation (carbon and oxygen beams). Scale bar: 2 μm. (C) 3D reconstruction of γ-H2AX foci and 16O ion traversal utilizing Cell-Fit-HD (16O, tilted irradiation 45°, 0.25 Gy). Ion traversals were traced over 19 consecutive FNTD imaging planes (total range in z: 57 μm).
Figure 6
Figure 6. Evaluating DSB number, size and repair kinetic as biodosimeter
(A) Representative images of γ-H2AX foci (green) initial (0.5 h) and residual (72 h) after 1 Gy (physical dose) irradiation of all five-radiation qualities. Cell nuclei were counterstained with DAPI (blue). Selected nuclei (in white squares) are magnified to show the foci included for quantitative analysis (marked with green dots). Scale bar: 20 μm. (B) Formation γ-H2AX foci (0.5 h) and repair kinetic was longitudinally investigated up to 72 h post irradiation. 12C and 16O ion beams induced significantly higher number and size of γ-H2AX foci with slower resolution kinetics, compared to other irradiation beams (photons, 1H, 4He). Bars represent mean ± SEM of at least two independent experiments. More than 100 nuclei per sample, per experiment were analyzed. (C) Correlation of clonogenic survival fractions with foci size and enumeration of total initial (I; 0.5 h) vs. residual (R; 72 h) foci as function of LETd has been found. Pearson correlation statistics for foci count (initial p = 0.001, residual p = 0.0096); foci size (initial: p = 0.0053, residual p = 0.0008).

References

    1. Marx V. Cancer treatment: Sharp shooters. Nature. 2014;508:133–138. - PubMed
    1. Castro JR. Results of Heavy-Ion Radiotherapy. Radiat Environ Biophys. 1995;34:45–48. - PubMed
    1. Parodi K, Mairani A, Brons S, Hasch BG, Sommerer F, Naumann J, Jakel O, Haberer T, Debus J. Monte Carlo simulations to support start-up and treatment planning of scanned proton and carbon ion therapy at a synchrotron-based facility. Phys Med Biol. 2012;57:3759–3784. - PubMed
    1. Karger CP, Jakel O, Palmans H, Kanai T. Dosimetry for ion beam radiotherapy. Phys Med Biol. 2010;55:R193–R234. - PubMed
    1. Baumann M, Krause M, Hill R. Clonogens and cancer stem cells. Nat Rev Cancer. 2008:8. - PubMed