. 2016 Aug 30;7(35):57171-57185.
doi: 10.18632/oncotarget.11036.

Combinatorial therapeutic targeting of BMP2 and MEK-ERK pathways in NF1-associated malignant peripheral nerve sheath tumors

Affiliations

Combinatorial therapeutic targeting of BMP2 and MEK-ERK pathways in NF1-associated malignant peripheral nerve sheath tumors

Sidra Ahsan et al. Oncotarget. .

Abstract

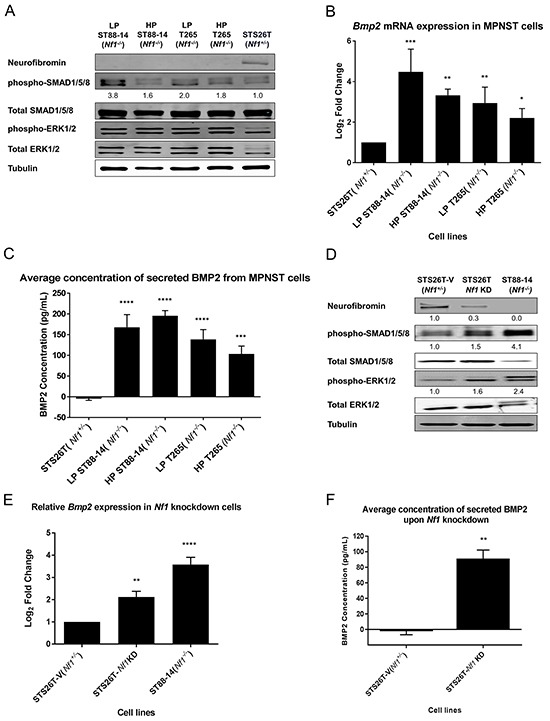
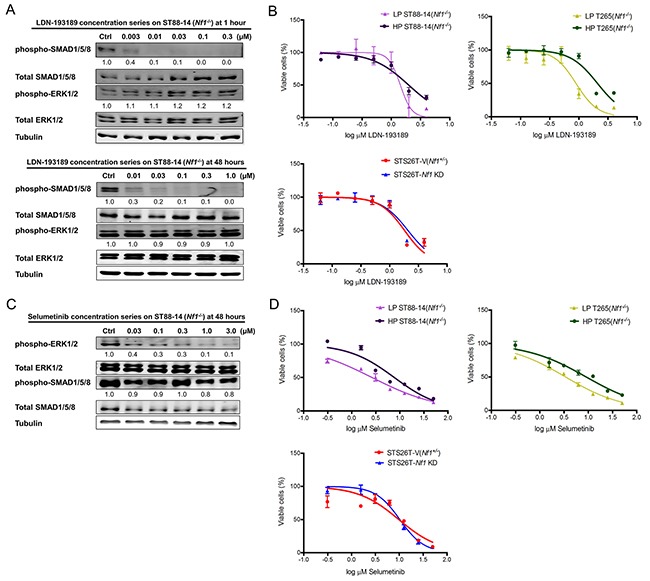
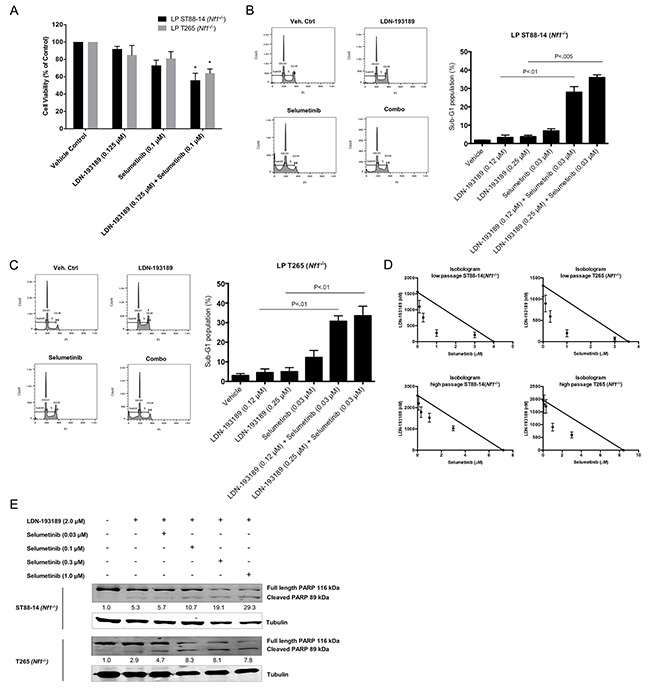
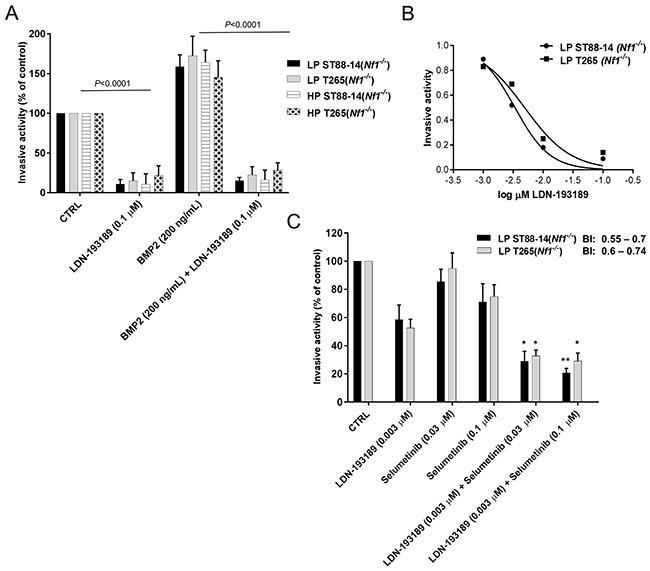
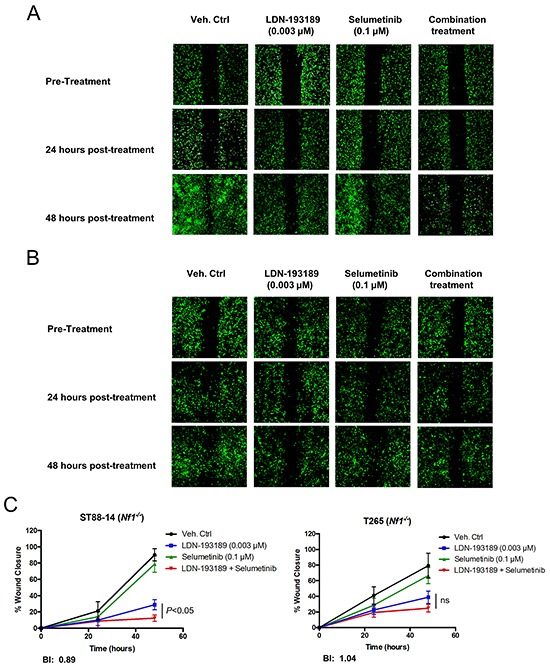
The clinical management of malignant peripheral nerve sheath tumors (MPNSTs) is challenging not only due to its aggressive and invasive nature, but also limited therapeutic options. Using gene expression profiling, our lab identified BMP2-SMAD1/5/8 pathway as a potential therapeutic target for treating MPNSTs. In this study, we explored the therapeutic impact of targeting BMP2-SMAD1/5/8 pathway in conjunction with RAS-MEK-ERK signaling, which is constitutively activated in MPNSTs. Our results indicated that single agent treatment with LDN-193189, a BMP2 Type I receptor inhibitor, did not affect the growth and survival of MPNST cells at biochemically relevant inhibitory concentrations. However, addition of a MEK1/2 inhibitor, selumetinib, to LDN-193189-treated cells resulted in significant inhibition of cell growth and induction of cell death. LDN-193189 at biochemically effective concentrations significantly inhibited motility and invasiveness of MPNST cells, and these effects were enhanced by the addition of selumetinib. Overall, our results advocate for a combinatorial therapeutic approach for MPNSTs that not only targets the growth and survival via inhibition of MEK1/2, but also its malignant spread by suppressing the activation of BMP2-SMAD1/5/8 pathway. Importantly, these studies were conducted in low-passage patient-derived MPNST cells, allowing for an investigation of the effects of the proposed drug treatments in a biologically-relevant context.

Keywords: BMP2; cell signaling; combinatorial targeted therapy; malignant peripheral nerve sheath tumors; neurofibromatosis type 1.


Conflict of interest statement

The authors do not have any potential conflicts of interest in regards to the submitted work.

Figures

Figure 1
Figure 1. BMP2 is overexpressed in NF1-null MPNST cell lines
A. Representative western blot (n=3), of LP and HP (Nf1−/−) MPNST cell lines confirmed their Nf1-null status and shows an active BMP2-SMAD1/5/8 pathway and MAPK pathway. Quantification of the western blot reveals that there is at least a 1.6-fold increase in phospho-SMAD1/5/8 activity in all the Nf1(−/−) cell lines as compared to the positive control STS26T (Nf1+/−) cells, with the highest levels reported in the low passage Nf1-null cells. The quantification values were calculated by normalizing densitometry measurements of phospho-SMAD1/5/8 to total SMAD1/5/8 and then compared to STS26T (Nf1+/−) cells (set as 1). B. In Nf1-null MPNST cells, the expression of Bmp2 is significantly higher irrespective of passage numbers as compared to the STS26T (Nf1+/−) cells. RNA was extracted between passages 8-14 from LP ST88-14 (Nf1−/−), passages 155-170 for HP ST88-14 (Nf1−/−), passages 10-16 for LP T265 (Nf1−/−) cells, and passages 208-230 for HP T265 (Nf1−/−) cells. C. Analyses of BMP2 secretion by ELISA using conditioned media from MPNST cell lines shows that BMP2 is secreted in both low and high passage Nf1-null MPNST cells. D. Activation of BMP2-SMAD1/5/8 and MEK1/2-ERK1/2 pathway is dependent on the presence of neurofibromin I, as both pathways are activated via phosphorylation upon knockdown of Nf1. Based on densitometry, a ~70% knockdown of NF1 results in a 55% increase in phospho-SMAD1/5/8 levels, and a 60% increase in the phospho-ERK1/2 levels. The relative levels of NF1, phospho-SMAD1/5/8, and phospho-ERK1/2 were calculated by normalizing their densitometry measurements to the corresponding tubulin, total SMAD1/5/8, and total ERK1/2, respectively. E. Results from RT-PCR show that Bmp2 expression increased two-fold upon Nf1 knockdown as compared to the STS26T-V (Nf1+/−) cells. All cell lines used in this experiment are high passage cells. The Nf1-knockdown cells were generated at passage 160 for the STS26T-V (Nf1+/−) cells, and were maintained in culture for subsequent 8-10 weeks. Steady-state Bmp2 mRNA levels of ST88-14 (Nf1−/−) cells were determined between passages 175-190. F. Secreted levels of BMP2 are also dependent on the status of NF1, where knockdown of Nf1 results in increased levels of secreted BMP2. All cell lines used in this experiment are high passage cells. The Nf1-knockdown cells were generated at passage 160 from the STS26T cells, and were maintained in culture for subsequent 8-10 weeks. Paired t-test or one-way ANOVA followed by Tukey's test for multiple comparisons used for determining statistical significance (n=3, *P<0.05, **P<0.01, ***P<0.001, ****P<0.0001 as compared with either STS26T (Nf1+/−) or STS26T-V (Nf1+/−), as specified).
Figure 2
Figure 2. Single agent treatment with LDN-193189 or selumetinib affects cellular viability at concentrations higher than the biochemically effective dose
A. Representative western blot (n=3) of titration of LDN-193189 in MPNST cells to determine optimal dose of inhibition. LDN-193189 potently inhibits phospho-SMAD signaling at 0.003 μM with nearly complete inhibition at 0.01 μM, without any effects on the ERK signaling pathway in the ST88-14 (Nf1−/− cells) at the 1-hour time point. LDN-193189 continues to inhibit phospho-SMAD1/5/8 at the low concentration of 0.01 μM in 48 hours, however, it requires between 0.03 and 0.1 μM for complete inhibition of the target in 48 hours. None of the tested concentrations of LDN-193189 up to 1.0 μM had any effects on the MEK1/2-ERK1/2 signaling. The relative levels for phospho-SMAD1/5/8 and phospho-ERK1/2 were calculated by normalizing their densitometry to the corresponding total SMAD1/5/8 and total ERK1/2, respectively. Similar concentration responses were obtained for all tested MPNST cell lines. Cells were treated with the indicated concentrations for the specified time points and whole cell lysate was fractionated on SDS-PAGE followed by immunoblotting for indicated proteins, n=3. B. The IC50 for single agent treatments were plotted on a semi-logarithmic scale in which x-axis (log10 scale) indicates drug concentrations and y-axis represents % of viable cells as measured by 48-hour MTT assays. In all the tested cell lines, the IC50 for LDN-193189 was between 1.0-2.0 μM. Data were analyzed by non-linear regression analysis to generate sigmoidal dose response curves and each point represents mean value from three independent experiments ± SD. C. Representative western blot (n=3) showing that selumetinib inhibits phospho-ERK1/2 in a concentration-dependent manner. Concentrations between 0.03 μM to 0.1 μM lead to a significant decrease in activation of ERK1/2 in 48 hours. The relative levels of phospho-ERK1/2 and phospho-SMAD1/5/8 were calculated by normalizing their densitometry to the corresponding total ERK1/2 and total SMAD1/5/8, respectively. D. The effects of single treatment by selumetinib on the percent of viable MPNST cell lines. The IC50s for selumetinib treatments were plotted on a semi-logarithmic scale in which x-axis (log10 scale) indicates drug concentration and y-axis represents % of viable cells as measured by 48-hour MTT assays. Data were analyzed by non-linear regression analysis to generate sigmoidal dose response curves and each point represents mean value from three independent experiments ± SD.
Figure 3
Figure 3. Combinatorial treatment with LDN-193189 and selumetinib results in increased cell death and decreased proliferation of MPNST cells
A. Bar graph of the percentage of viable low passage MPNST cells via MTT assay. Cells were treated with the indicated drug concentrations for 48 hours. Single agent treatment with LDN-193189 does not affect cell growth at concentrations below its IC50, however addition of selumetinib significantly decreases the % of viable MPNST cells (n=3, *P<0.05, paired t-test compared to cells treated with LDN-193189 only). B. and C. Representative histograms from cell cycle analyses of low passage NF1-null MPNST cell lines treated with either single agent or combination agents for 48 hours. Bar graph from cell cycle analyses data of MPNST cells treated with biochemically relevant concentrations of LDN-193189 and selumetinib. Percentage of cells in sub-G1 phase increase upon combinatorial treatment with LDN-193189 and selumetinib as compared to single treatment with either of the agents (n=3, paired t-test combination treatment compared to cells treated with LDN-193189 only). D. Standard isobologram analyses of the anti-tumor interactions between LDN-193189 and selumetinib in various MPNST cell lines. All drug combinations exhibit a synergistic effect in low and high passage NF1-null MPNST cells with an increased synergistic interaction in the low passage cells. Each axis represents the indicated concentrations of that drug. Data points represent the average value from three independent experiments ± SD. E. Results from PARP cleavage assay upon 48-hour treatment with candidate drugs indicate a dose-dependent induction of apoptosis upon combination treatment as compared to treatment with LDN-193189 alone. For treatment with LDN-193189 alone, cells were treated with 2.0 μM of LDN-193189 based on the drug's IC50 as determined by the MTT assay. For combination treatment, cells were treated with 2.0 μM of LDN-193189 in combination with biochemically effective increasing concentrations of selumetinib. The relative levels of cleaved PARP were calculated by normalizing their densitometry measurements to tubulin, and then compared to vehicle-treated control (set as 1).
Figure 4
Figure 4. Combinatorial treatment with LDN-193189 and selumetinib synergizes to reduce cellular invasion in MPNST cells
A. Graphical representation of the quantified fluorescence of the cells that invaded through the extracellular matrix (ECM), normalized to invasive activity without any chemoattractant and the vehicle control. LDN-193189 inhibits cellular invasion as compared to the vehicle treated control in LP and HP Nf1(−/−) MPNST cells. Addition of 200 ng/mL of BMP2 promotes invasion in these cells (**P<0.01), which is blocked by the addition of LDN-193189 in all the tested MPNST cells. Cells were stained with CyQuant/GR dye and the number of invaded cells was quantified by a fluorescence plate reader. B. The IC50 graph shows the optimal dose of LDN-193189 needed for half maximal inhibition of invasiveness in MPNSTs. C. Bar graph of the quantified fluorescence of the cells that invaded through the ECM upon treatment with single agents and in combination. The invasive ability of MPNST cells is greatly reduced by LDN-193189 (0.003 μM), whereas selumetinib only affects cellular invasion at 0.1 μM. The combinatorial treatment results in a statistically significant increase of the inhibitory effect of LDN-193189 on invasion. Based on the BI model, the therapeutic interaction of the combination treatment on invasion was synergistic for both the combinations used. Data presented are mean average of three independent experiments ± S.D. with the corresponding P-values (n=3, *P<0.05, **P<0.01, One-way ANOVA followed by Tukey's test for multiple comparisons).
Figure 5
Figure 5. Selumetinib enhances the anti-migratory effects of LDN-193189 in MPNST cells
A. and B. Representative images of the analyzed cellular wound area of low passage ST88-14 (Nf1−/−) and T265 (Nf1−/−) cells taken at different time points during the course of the migration assay. Cells were infected with lentiviral GFP to allow for quantification of images. The pre-treatment images were taken upon creation of the wound field and cell migration into the wound field was followed for the next 24-48 hours post-treatment. C. The percent quantification of the wound area analyzed using ImageJ was normalized to the pre-treatment wound area for each condition. LDN-193189 (0.003 μM) significantly reduces the motility in both cell lines as compared to the control (P<0.0001), however treatment with selumetinib alone does not affect motility. Combinatorial treatment significantly decreases MPNST cellular migration in LP ST88-14 (Nf1−/−), whereas the combination treatment effect is insignificant in the LP T265 (Nf1−/−) cells, as compared to treatment with LDN-193189 alone. BI values represent a weakly synergistic to an additive effect of drug combination on motility. Data presented are the average of quantification of the wound areas of at least three independent experiments ± S.D (n=3, Two-way ANOVA for comparing each time point and condition with another, followed by Bonferroni's test for multiple comparisons).

References

    1. Friedman JM. Epidemiology of neurofibromatosis type 1. Am J Med Genet. 1999;89:1–6. - PubMed
    1. Brems H, Park C, Maertens O, Pemov A, Messia L, Upadhyaya M, Claes K, Beert E, Peeters K, Mautner V, Sloan JL, Yao L, et al. Glomus tumors in neurofibromatosis type 1: Genetic, functional, and clinical evidence of a novel association. Cancer Res. 2009;69:7393–7401. - PMC - PubMed
    1. Hirbe AC, Gutmann DH. Neurofibromatosis type 1: a multidisciplinary approach to care. Lancet Neurol. 2014;13:834–843. - PubMed
    1. Roma P. Letter to the Editor Mosaic (Segmental) Neurofibromatosis Type 1 (NF1) and Type 2 (NF2): No Longer Neurofibromatosis Type 5. 2001;180:178–180. - PubMed
    1. Evans DGR, Baser ME, McGaughran J, Sharif S, Howard E, Moran a. Malignant peripheral nerve sheath tumours in neurofibromatosis 1. J Med Genet. 2002;39:311–314. - PMC - PubMed

MeSH terms