Comparative Study
. 2016 Aug 5:17:550.
doi: 10.1186/s12864-016-2876-y.

Comparative genomics and transcriptomics of Pichia pastoris

Affiliations
Comparative Study

Comparative genomics and transcriptomics of Pichia pastoris

Kerry R Love et al. BMC Genomics. .

Erratum in

Abstract

Background: Pichia pastoris has emerged as an important alternative host for producing recombinant biopharmaceuticals, owing to its high cultivation density, low host cell protein burden, and the development of strains with humanized glycosylation. Despite its demonstrated utility, relatively little strain engineering has been performed to improve Pichia, due in part to the limited number and inconsistent frameworks of reported genomes and transcriptomes. Furthermore, the co-mingling of genomic, transcriptomic and fermentation data collected about Komagataella pastoris and Komagataella phaffii, the two strains co-branded as Pichia, has generated confusion about host performance for these genetically distinct species. Generation of comparative high-quality genomes and transcriptomes will enable meaningful comparisons between the organisms, and potentially inform distinct biotechnological utilies for each species.

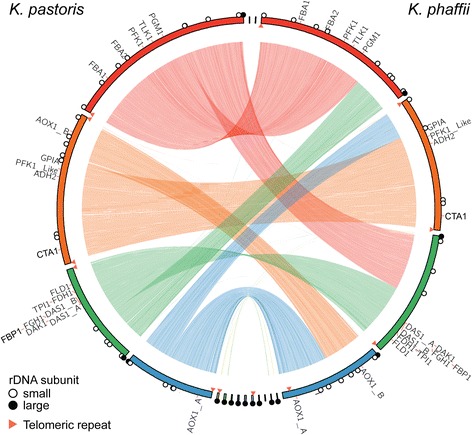
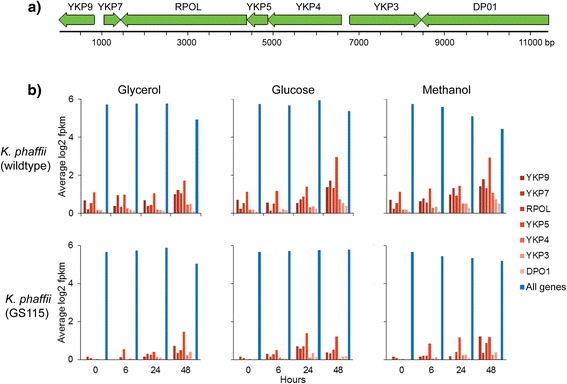
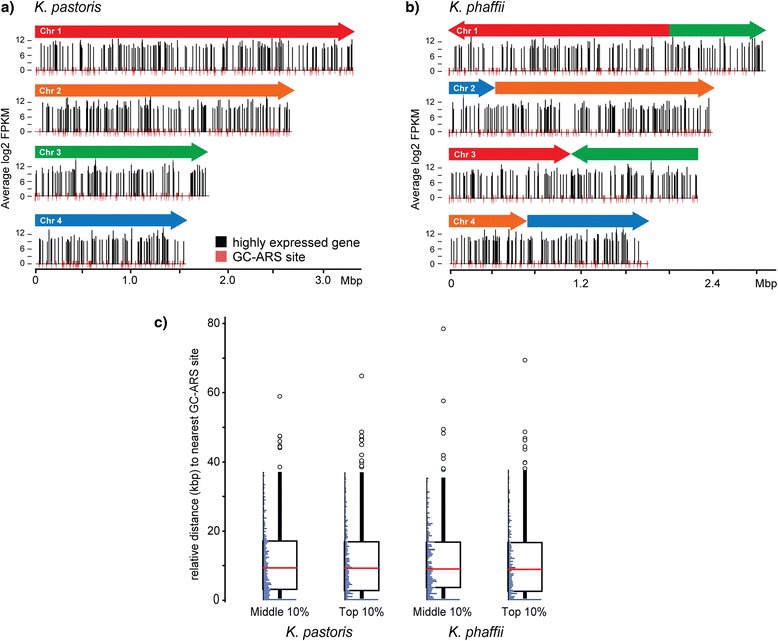
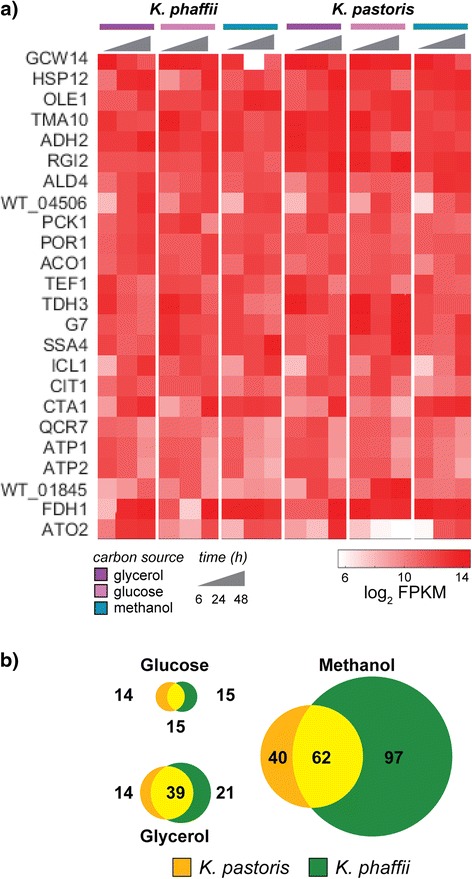
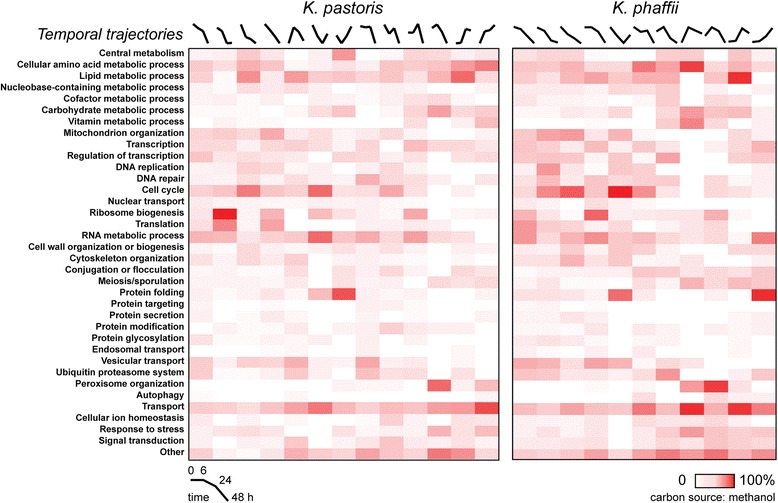
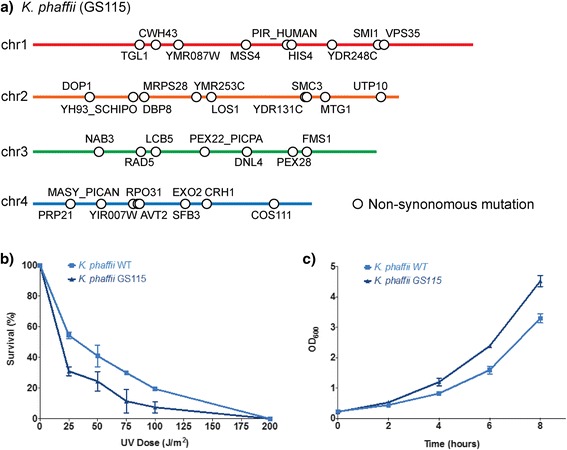
Results: Here, we present a comprehensive and standardized comparative analysis of the genomic features of the three most commonly used strains comprising the tradename Pichia: K. pastoris wild-type, K. phaffii wild-type, and K. phaffii GS115. We used a combination of long-read (PacBio) and short-read (Illumina) sequencing technologies to achieve over 1000X coverage of each genome. Construction of individual genomes was then performed using as few as seven individual contigs to create gap-free assemblies. We found substantial syntenic rearrangements between the species and characterized a linear plasmid present in K. phaffii. Comparative analyses between K. phaffii genomes enabled the characterization of the mutational landscape of the GS115 strain. We identified and examined 35 non-synonomous coding mutations present in GS115, many of which are likely to impact strain performance. Additionally, we investigated transcriptomic profiles of gene expression for both species during cultivation on various carbon sources. We observed that the most highly transcribed genes in both organisms were consistently highly expressed in all three carbon sources examined. We also observed selective expression of certain genes in each carbon source, including many sequences not previously reported as promoters for expression of heterologous proteins in yeasts.

Conclusions: Our studies establish a foundation for understanding critical relationships between genome structure, cultivation conditions and gene expression. The resources we report here will inform and facilitate rational, organism-wide strain engineering for improved utility as a host for protein production.

Keywords: Cultivation dependent expression; Gene Set Enrichment Analysis (GSEA); Komagataella pastoris; Komagataella phaffii; Pichia pastoris; RNA-Seq; Secretome; Self-Organizing Maps (SOMs); Transcriptome.


Figures

Fig. 1
Fig. 1
Comparative genome structure of K. pastoris and K. phaffii. Circos plot indicating the sequence alignment between K. pastoris and K. phaffii marked with methanol utilization pathway (MUT) genes. Functional genetic elements marked on the plots include: small rDNA subunits (white circles), large rDNA subunits (black circles), and telomeric repeats (orange triangles)
Fig. 2
Fig. 2
Linear plasmid annotation and expression in K. phaffii. a) Schematic representation of the 11 kb linear plasmid annotated with seven genes homologous to the K. lactis killer plasmid. b) Comparison of gene expression between genes located on the killer plasmid in i) wild type K. phaffii or ii) K. phaffii GS115 and the average gene expression among chromosomally-located genes in each species during cultivation on three different carbon sources
Fig. 3
Fig. 3
Gene expression as a function of chromosomal location. Map of chromosomal location (base pair identity) for the most highly expressed genes (top 10 % expression) in a) K. pastoris and b) K. phaffii. Black lines indicate gene expression level at 24 h time point during batch cultivation in methanol. Red lines indicate locations of GC-rich autonomously replicating sequence (GC-ARS) motifs identified by BLAST. c) Box and whisker plot of the relative distance to the nearest GC-ARS motif in K. pastoris and K. phaffii for genes expressed at average levels genome-wide (45–55 % of max expression) and for the most highly expressed genes (top 10 % expression). Histograms of relative distances to GC-ARS motifs are shown alongside box plots for each gene set analyzed
Fig. 4
Fig. 4
Gene expression in K. pastoris and K. phaffii as a function of cultivation conditions. a) Heat map of gene expression (log2 fpkm) for the most highly expressed genes at in both strains. Gene expression is shown as a function of batch growth in glycerol, glucose or methanol during a 48 h cultivation period. b) Venn diagrams depicting the intersection between K. pastoris (orange) and K. phaffii (green) for genes that are highly (top 10 % expression) and differentially expressed (log2-fold change > 2, p < 0.05) during fermentation on a particular carbon source. Circle size is proportional to the total number of genes present for a given condition
Fig. 5
Fig. 5
Biological process enrichment as a function of cultivation in methanol. Heat map representation of the enrichment of GO biological process terms for expression phenotypes observed in K. pastoris and K. phaffii during a 48 h batch cultivation in methanol as characterized by self-organizing maps (SOMs). Representative temporal trajectories of gene expression were generated for each SOM by averaging expression data at each time point for genes present within a given map. Color density relates to the number of genes assigned to a particular process as a percentage of the total number genes present in a particular expression phenotype or map
Fig. 6
Fig. 6
Locations of mutations found in GS115 and phenotypic differences observed between GS115 and wildtype K. phaffii. a) The chromosomal locations of the 35 single nucleotide polymorphisms (SNPs) found in GS115 relative to wildtype K. phaffii. b) Growth curve of Komagatella strains on glucose media. Wildtype K. phaffii growth data is indicated with squares and GS115 growth data is indicated with triangles. Data shown for each strain is the mean from triplicate measurements. Error bars indicate 95 % confidence intervals. c Kill curve of Komagatella strains following exposure to UV light. Data shown for each strain is the mean from two experiments, each run in triplicate. Error bars are the standard deviation across all data collected for both experiments

Similar articles

Cited by

References

    1. Walsh G. Biopharmaceutical benchmarks 2010. Nat Biotechnol. 2010;28(9):917–24. doi: 10.1038/nbt0910-917. - DOI - PubMed
    1. Aggarwal RS. What’s fueling the biotech engine-2012 to 2013. Nat Biotechnol. 2014;32(1):32–9. doi: 10.1038/nbt.2794. - DOI - PubMed
    1. Corchero JL, Gasser B, Resina D, Smith W, Parrilli E, Vazquez F, Abasolo I, Giuliani M, Jantti J, Ferrer P, et al. Unconventional microbial systems for the cost-efficient production of high-quality protein therapeutics. Biotechnol Adv. 2013;31(2):140–53. doi: 10.1016/j.biotechadv.2012.09.001. - DOI - PubMed
    1. Love JC, Love KR, Barone PW. Enabling global access to high-quality biopharmaceuticals. Curr Opin Chem Eng. 2013;2(4):383–90. doi: 10.1016/j.coche.2013.09.002. - DOI
    1. Ahmad M, Hirz M, Pichler H, Schwab H. Protein expression in Pichia pastoris: recent achievements and perspectives for heterologous protein production. Appl Microbiol Biotechnol. 2014;98(12):5301–17. doi: 10.1007/s00253-014-5732-5. - DOI - PMC - PubMed

Publication types