. 2016 Aug 5:17:559.
doi: 10.1186/s12864-016-2837-5.

The genome-wide role of HSF-1 in the regulation of gene expression in Caenorhabditis elegans

Affiliations

The genome-wide role of HSF-1 in the regulation of gene expression in Caenorhabditis elegans

Jessica Brunquell et al. BMC Genomics. .

Abstract

Background: The heat shock response, induced by cytoplasmic proteotoxic stress, is one of the most highly conserved transcriptional responses. This response, driven by the heat shock transcription factor HSF1, restores proteostasis through the induction of molecular chaperones and other genes. In addition to stress-dependent functions, HSF1 has also been implicated in various stress-independent functions. In C. elegans, the HSF1 homolog HSF-1 is an essential protein that is required to mount a stress-dependent response, as well as to coordinate various stress-independent processes including development, metabolism, and the regulation of lifespan. In this work, we have performed RNA-sequencing for C. elegans cultured in the presence and absence of hsf-1 RNAi followed by treatment with or without heat shock. This experimental design thus allows for the determination of both heat shock-dependent and -independent biological targets of HSF-1 on a genome-wide level.

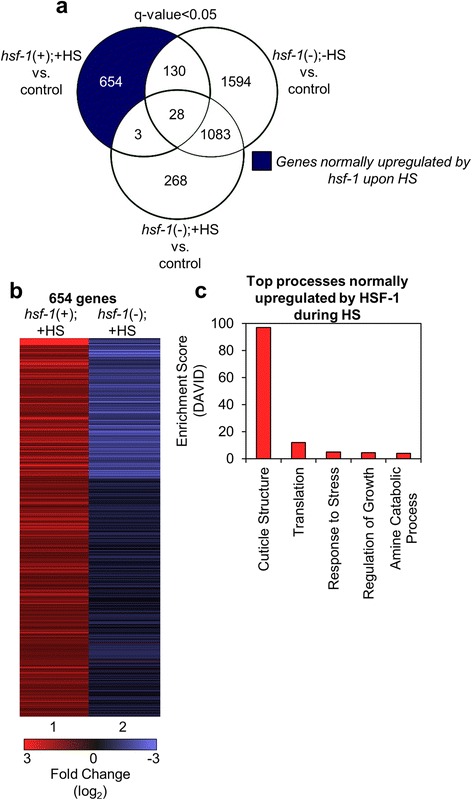
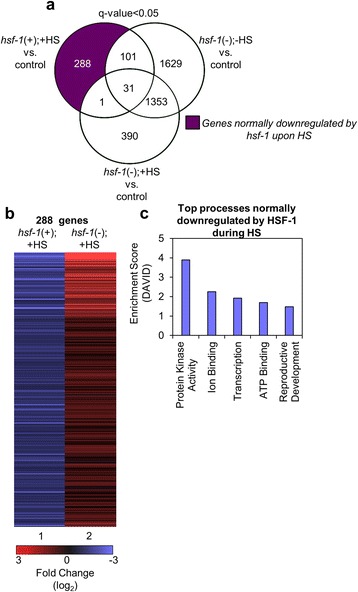
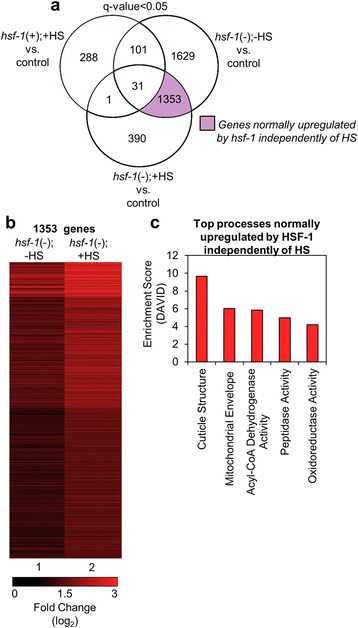
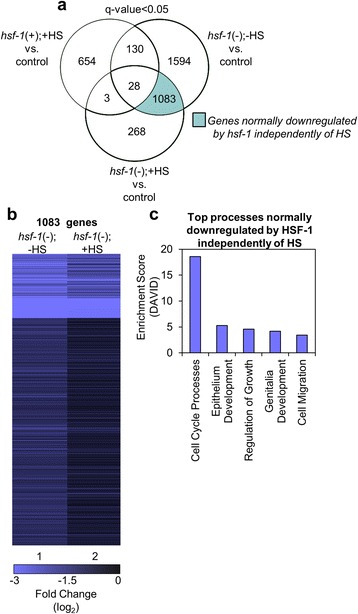
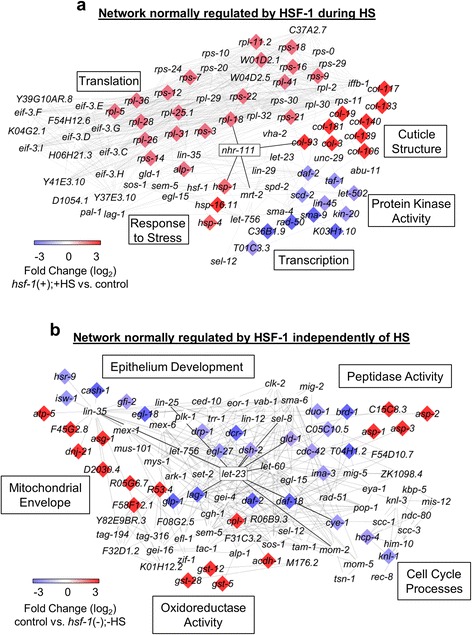
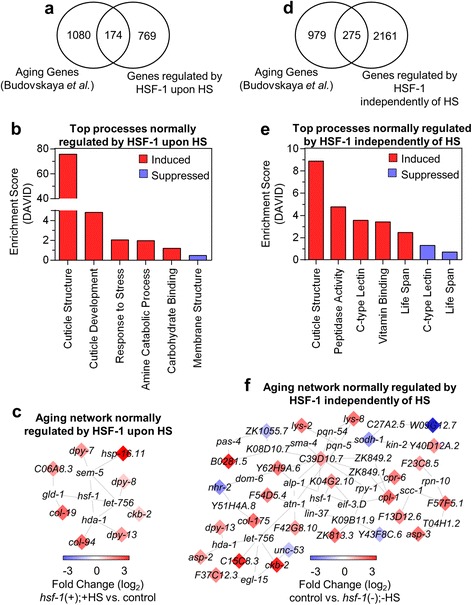
Results: Our results confirm that C. elegans HSF-1 can regulate gene expression in both a stress-dependent and -independent fashion. Almost all genes regulated by HS require HSF-1, reinforcing the central role of this transcription factor in the response to heat stress. As expected, major categories of HSF-1-regulated genes include cytoprotection, development, metabolism, and aging. Within both the heat stress-dependent and -independent gene groups, significant numbers of genes are upregulated as well as downregulated, demonstrating that HSF-1 can both activate and repress gene expression either directly or indirectly. Surprisingly, the cellular process most highly regulated by HSF-1, both with and without heat stress, is cuticle structure. Via network analyses, we identify a nuclear hormone receptor as a common link between genes that are regulated by HSF-1 in a HS-dependent manner, and an epidermal growth factor receptor as a common link between genes that are regulated by HSF-1 in a HS-independent manner. HSF-1 therefore coordinates various physiological processes in C. elegans, and HSF-1 activity may be coordinated across tissues by nuclear hormone receptor and epidermal growth factor receptor signaling.

Conclusion: This work provides genome-wide HSF-1 regulatory networks in C. elegans that are both heat stress-dependent and -independent. We show that HSF-1 is responsible for regulating many genes outside of classical heat stress-responsive genes, including genes involved in development, metabolism, and aging. The findings that a nuclear hormone receptor may coordinate the HS-induced HSF-1 transcriptional response, while an epidermal growth factor receptor may coordinate the HS-independent response, indicate that these factors could promote cell non-autonomous signaling that occurs through HSF-1. Finally, this work highlights the genes involved in cuticle structure as important HSF-1 targets that may play roles in promoting both cytoprotection as well as longevity.

Keywords: C. elegans; HSF-1; Heat shock response; RNA-seq; Stress; Transcript analysis.


Figures

Fig. 1
Fig. 1
Genes that are normally upregulated by HSF-1 in response to HS. a The Venn diagram shows the overlap among genes that were found to be significantly upregulated (q-value < 0.05) for each of the indicated comparisons between samples. The dark blue shaded area includes genes that are normally upregulated by HSF-1 upon HS. The q-value is the FDR-adjusted p-value of the test statistic, as determined by the Benjamini-Hochberg correction for multiple testing. b Hierarchical clustering of the genes normally upregulated by HSF-1 upon HS. Lane 1 corresponds to the fold change of the 654 genes found in the dark blue section of the Venn diagram in (a) in the hsf-1(+);+HS vs. control samples. As a comparison, lane 2 corresponds to the fold change of the same genes found in lane 1, but in the hsf-1(-);+HS vs. control samples, as determined by RNA-seq. The heat map was organized using Cluster 3 by k-means and Euclidean distance. c Top processes normally upregulated by HSF-1 during HS. The genes found in the dark blue section of the Venn diagram in (a) were classified by Gene Ontology terms that were determined using DAVID
Fig. 2
Fig. 2
Genes that are normally downregulated by HSF-1 in response to HS. a The Venn diagram shows the overlap among genes that were found to be significantly downregulated (q-value < 0.05) for each of the indicated comparisons between samples. The dark purple shaded area includes genes that are normally downregulated by HSF-1 upon HS. The q-value is the FDR-adjusted p-value of the test statistic, as determined by the Benjamini-Hochberg correction for multiple testing. b Hierarchical clustering of the genes normally downregulated by HSF-1 upon HS. Lane 1 corresponds to the fold change of the 288 genes found in the dark purple section of the Venn diagram in (a) in the hsf-1(+);+HS vs. control samples. As a comparison, lane 2 corresponds to the fold change of the same genes found in lane 1, but in the hsf-1(-);+HS vs control samples, as determined by RNA-seq. The heat map was organized using Cluster 3 by k-means and Euclidean distance. c Top processes normally downregulated by HSF-1 during HS. The genes found in the dark purple section of the Venn diagram in (a) were classified by Gene Ontology terms that were determined using DAVID
Fig. 3
Fig. 3
Genes that are normally upregulated by HSF-1 independently of HS. a The Venn diagram shows the overlap among genes that were found to be significantly downregulated (q-value < 0.05) for each of the indicated comparisons between samples. The light purple shaded area includes genes that are downregulated upon treatment with hsf-1 RNAi, and are likely normally induced by HSF-1 independently of heat shock, therefore are referred to as upregulated genes. The q-value is the FDR-adjusted p-value of the test statistic, as determined by the Benjamini-Hochberg correction for multiple testing. b Hierarchical clustering of the genes normally upregulated by HSF-1 independently of HS. The fold change of genes found in the light purple section of the Venn diagram in (a) were determined by RNA-seq to be downregulated in response to hsf-1 RNAi, and would thus normally be upregulated by HSF-1. Lane 1 corresponds to the fold change of these genes in the control vs. hsf-1(-);-HS samples, and as a comparison, lane 2 corresponds to each the fold change of the same genes found in lane 1 but in the control vs. hsf-1(-);+HS samples. The heat map was organized using Cluster 3 by k-means and Euclidean distance. c Top processes normally upregulated by HSF-1 independently of HS. The genes found in the light purple section of the Venn diagram were classified by Gene Ontology terms that were determined using DAVID
Fig. 4
Fig. 4
Genes that are normally downregulated by HSF-1 independently of HS. a The Venn diagram shows the overlap among genes that were found to be significantly upregulated (q-value < 0.05) for each of the indicated comparisons between samples. The light blue shaded area includes genes that are upregulated upon treatment with hsf-1 RNAi, and are likely normally suppressed by HSF-1 independently of heat shock, therefore are referred to as downregulated genes. The q-value is the FDR-adjusted p-value of the test statistic, as determined by the Benjamini-Hochberg correction for multiple testing. b Hierarchical clustering comparing the genes normally suppressed by HSF-1 independently of HS. The fold change of genes found in the light blue section of the Venn diagram in (a) were determined by RNA-seq to be upregulated in response to hsf-1 RNAi, and would thus normally be suppressed by HSF-1. Lane 1 corresponds to the fold change of these genes in the control vs. hsf-1(-);-HS samples, and as a comparison, lane 2 corresponds to each the fold change of the same genes found in lane 1 but in the control vs. hsf-1(-);+HS samples. The heat map was organized using Cluster 3 by k-means and Euclidean distance. c Top processes normally downregulated by HSF-1 independently of HS. The genes found in the light blue section of the Venn diagram were classified by Gene Ontology terms that were determined using DAVID
Fig. 5
Fig. 5
Network analyses of the top HSF-1-regulated processes. a Predicted network regulated by HSF-1 during HS. Genes associated with the top 5 induced and suppressed processes in Figs. 1c and 2c were used for analysis. b Predicted network regulated by HSF-1 independently of HS. Genes associated with the top 5 induced and suppressed processes in Figs. 3c and 4c were used for analysis. For a and b, the color of each gene corresponds to the degree of HSF-1 regulation of the corresponding transcript. Network analysis was done with MiMI using the Cytoscape platform. The uncolored genes were not affected by HSF-1 during or independently of HS in our dataset, but are neighbors shared by at least two genes that were affected in our dataset
Fig. 6
Fig. 6
Age-regulated genes controlled by HSF-1. a The Venn diagram shows the overlap among genes that are differentially expressed during aging and regulated by HSF-1 during HS. The Venn diagram was made using genes previously found to be regulated during aging by Budovskaya et al. compared to genes we found to be regulated by HSF-1 during HS. b Cellular processes affected by aging and HSF-1 during HS. Genes shared between the aging dataset and HSF-1-regulated HS-dependent dataset from (a) were analyzed with DAVID and the Gene Ontology terms are listed in order of decreasing enrichment. c Network analysis of the genes regulated by aging and HSF-1 during HS. Network analysis was done with MiMI using the Cytoscape platform and the transcripts shared between data-sets (see Additional file 6: Table S5). The color of each transcript corresponds to the degree of HSF-1 regulation. Genes that are not colored were not affected by HSF-1 our dataset, but are neighbors shared by at least two genes that were affected in our dataset. d The Venn diagram shows the overlap among genes that are differentially expressed during aging and regulated by HSF-1 independently of HS. The Venn diagram was made using genes previously found to be regulated during aging by Budovskaya et al. compared to genes we found to be regulated by HSF-1 independently of HS. e Cellular processes affected by aging and HSF-1 independently of HS. Genes shared between the aging dataset and HSF-1-regulated HS-independent dataset from (c) were analyzed with DAVID and the Gene Ontology terms are listed in order of decreasing enrichment. f Network analysis of the genes regulated by aging and HSF-1 independently of HS. Network analysis was done with MiMI using the Cytoscape platform and the transcripts shared between data-sets (see Additional file 7: Table S6). The color of each transcript corresponds to the degree of HSF-1 regulation. Genes that are not colored were not affected by HSF-1 in our dataset, but are neighbors shared by at least two genes that were affected in our dataset

References

    1. Gidalevitz T, Prahlad V, Morimoto RI: The stress of protein misfolding: from single cells to multicellular organisms. Cold Spring Harb Perspect Biol 2011, 3(6). doi: 10.1101/cshperspect.a009704. - PMC - PubMed
    1. Anckar J, Sistonen L. Heat shock factor 1 as a coordinator of stress and developmental pathways. Adv Exp Med Biol. 2007;594:78–88. doi: 10.1007/978-0-387-39975-1_8. - DOI - PubMed
    1. Parsell DA, Lindquist S. The function of heat-shock proteins in stress tolerance: degradation and reactivation of damaged proteins. Annu Rev Genet. 1993;27:437–496. doi: 10.1146/annurev.ge.27.120193.002253. - DOI - PubMed
    1. Young JC, Agashe VR, Siegers K, Hartl FU. Pathways of chaperone-mediated protein folding in the cytosol. Nat Rev Mol Cell Biol. 2004;5(10):781–791. doi: 10.1038/nrm1492. - DOI - PubMed
    1. Hajdu-Cronin YM, Chen WJ, Sternberg PW. The L-type cyclin CYL-1 and the heat-shock-factor HSF-1 are required for heat-shock-induced protein expression in Caenorhabditis elegans. Genetics. 2004;168(4):1937–1949. doi: 10.1534/genetics.104.028423. - DOI - PMC - PubMed

Publication types

MeSH terms

Substances

LinkOut - more resources