. 2016 Aug 16;45(2):358-73.
doi: 10.1016/j.immuni.2016.07.008. Epub 2016 Aug 2.

Bioenergetic Insufficiencies Due to Metabolic Alterations Regulated by the Inhibitory Receptor PD-1 Are an Early Driver of CD8(+) T Cell Exhaustion

Affiliations

Bioenergetic Insufficiencies Due to Metabolic Alterations Regulated by the Inhibitory Receptor PD-1 Are an Early Driver of CD8(+) T Cell Exhaustion

Bertram Bengsch et al. Immunity. .

Abstract

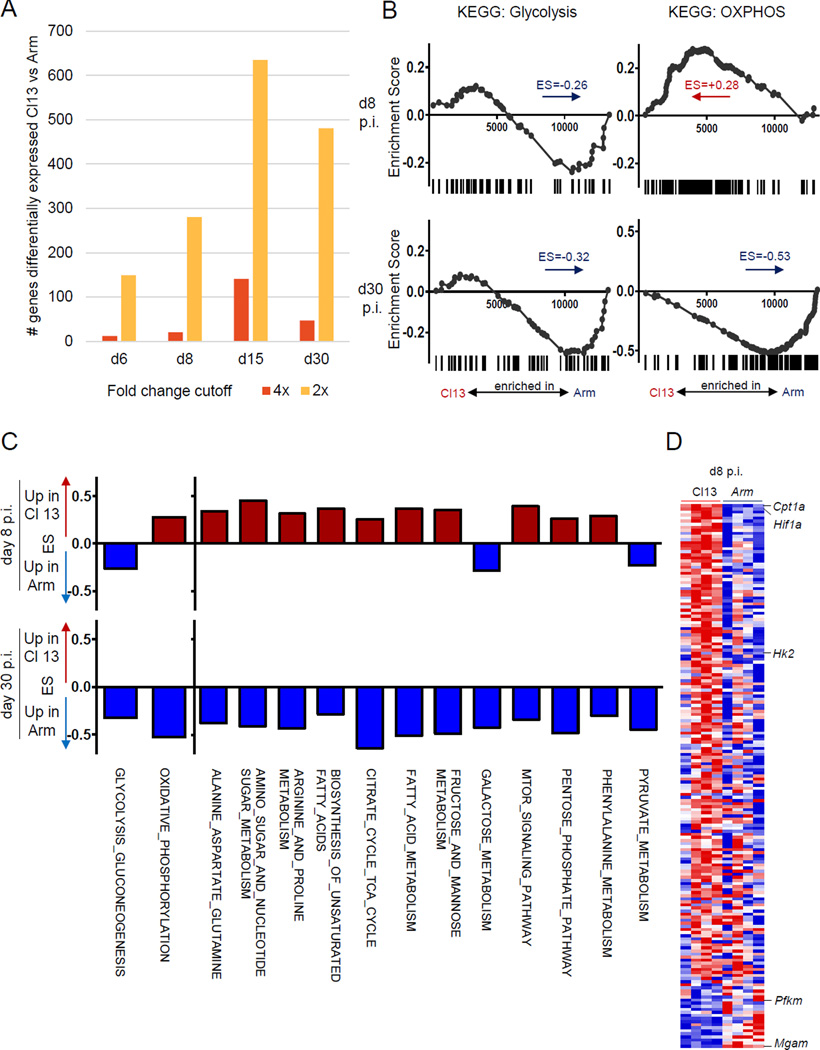
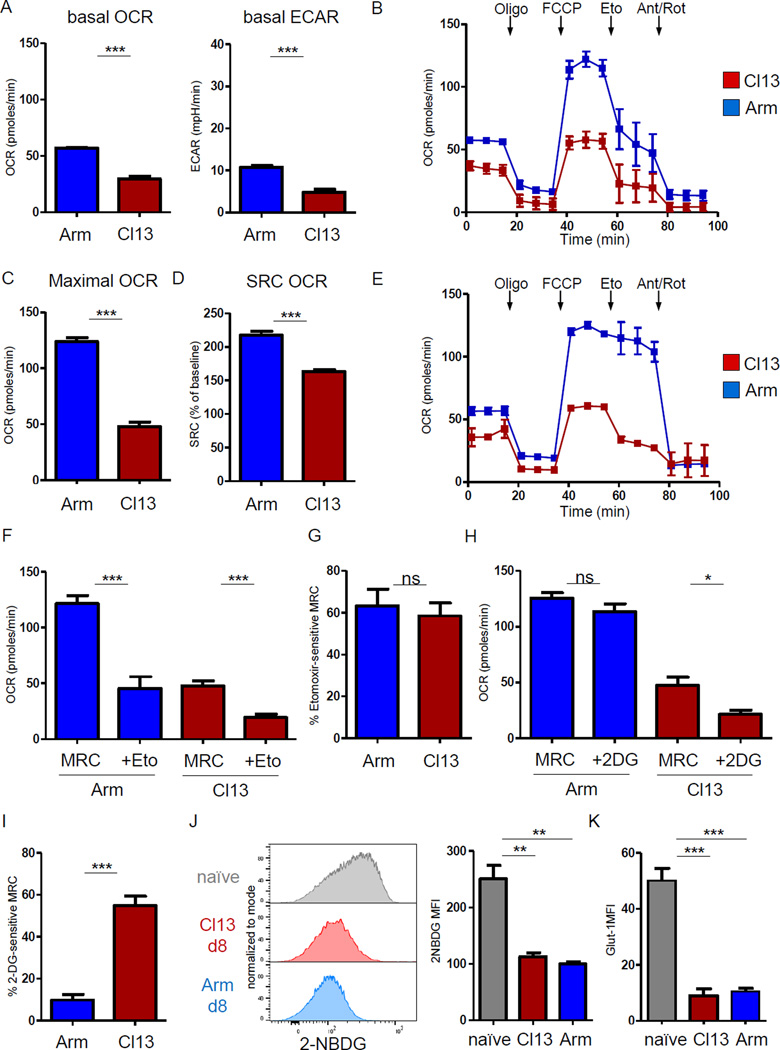
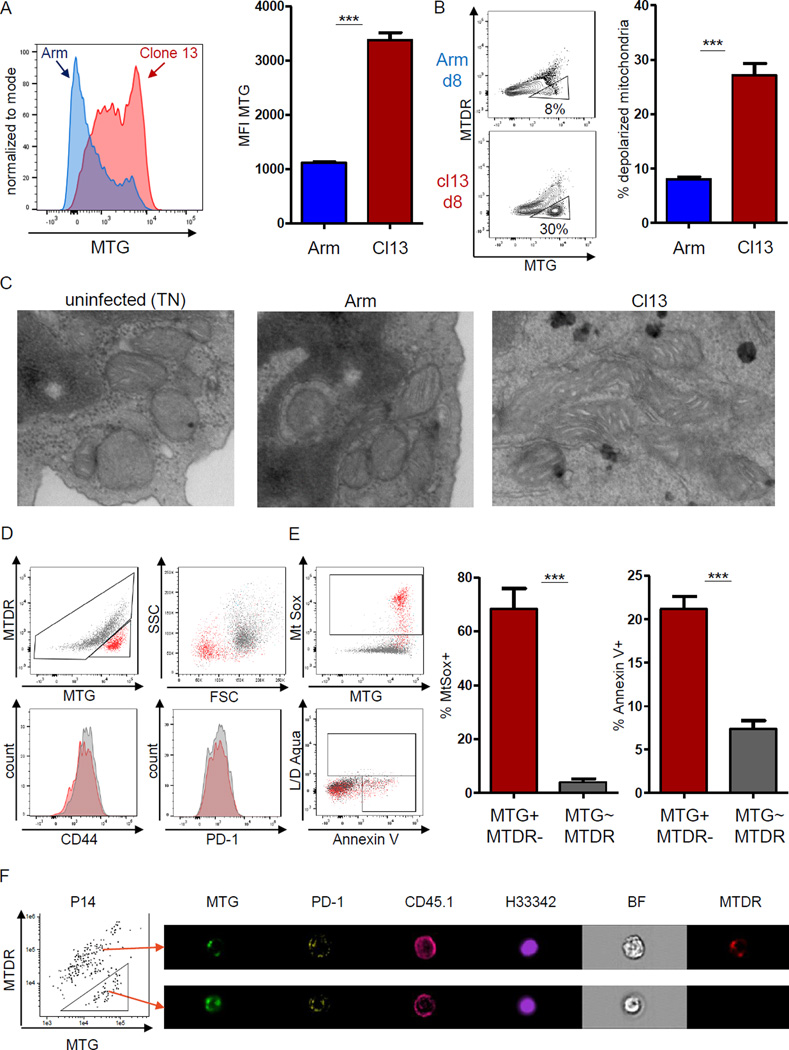
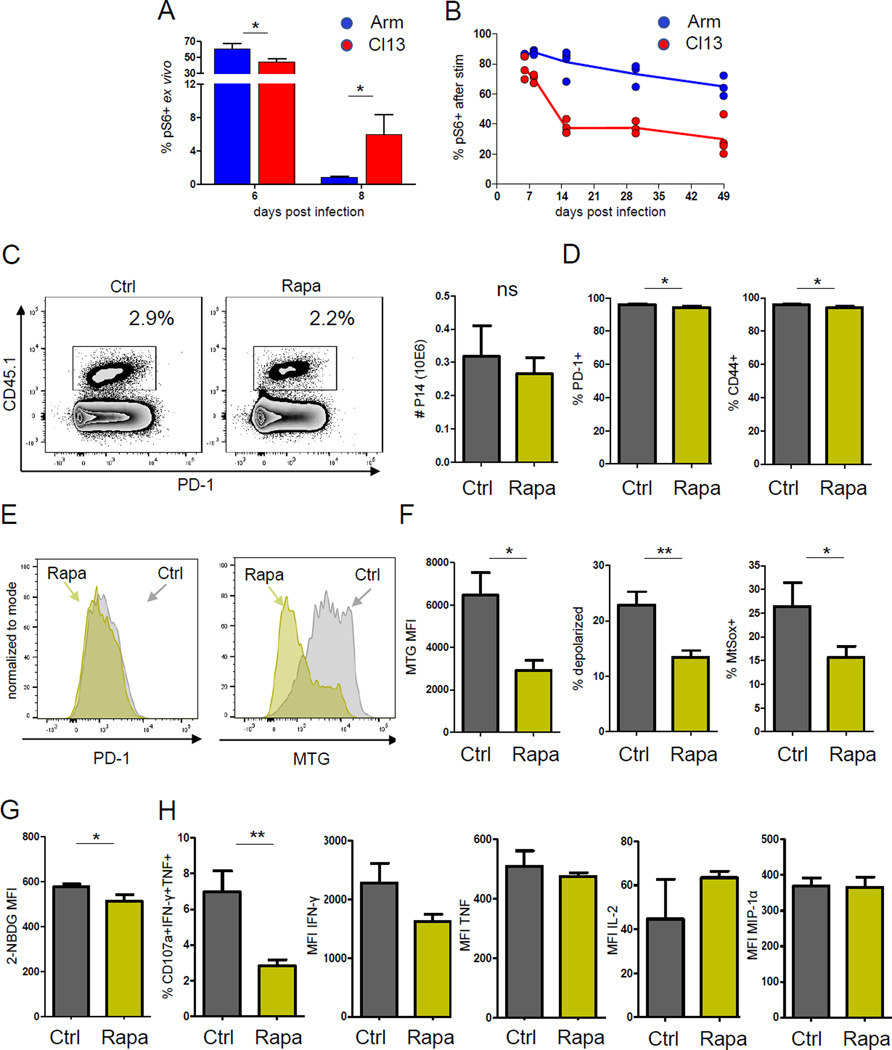
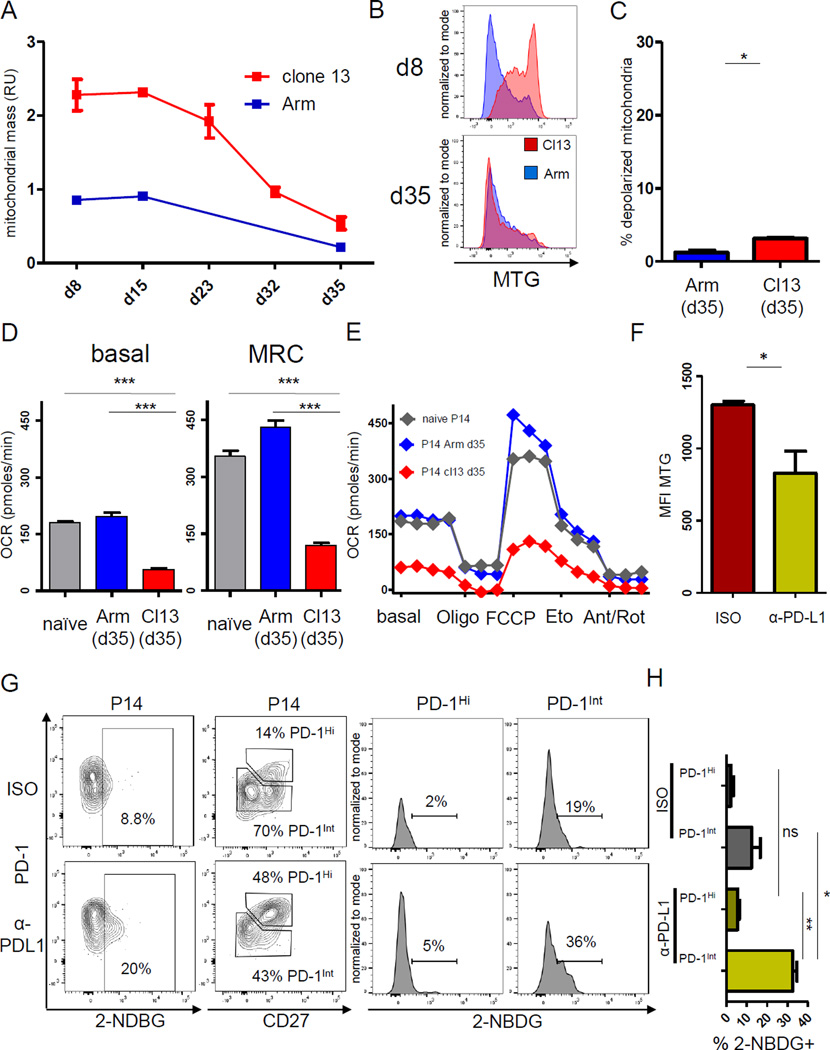
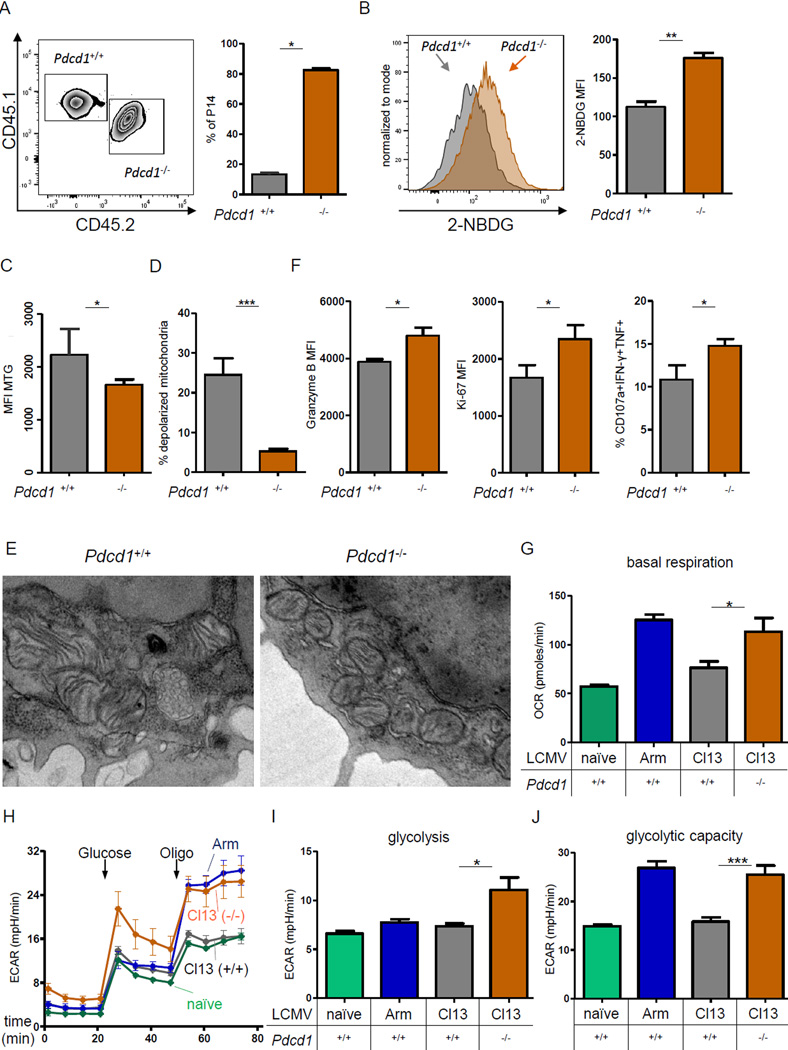
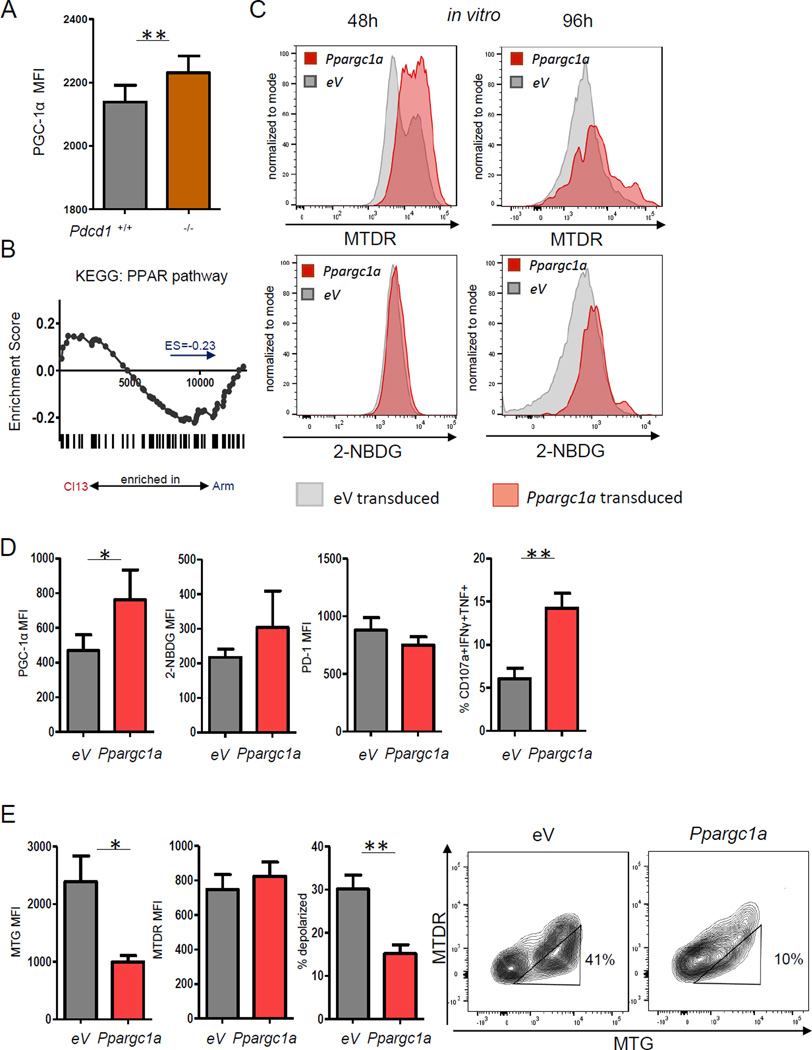
Dynamic reprogramming of metabolism is essential for T cell effector function and memory formation. However, the regulation of metabolism in exhausted CD8(+) T (Tex) cells is poorly understood. We found that during the first week of chronic lymphocytic choriomeningitis virus (LCMV) infection, before severe dysfunction develops, virus-specific CD8(+) T cells were already unable to match the bioenergetics of effector T cells generated during acute infection. Suppression of T cell bioenergetics involved restricted glucose uptake and use, despite persisting mechanistic target of rapamycin (mTOR) signaling and upregulation of many anabolic pathways. PD-1 regulated early glycolytic and mitochondrial alterations and repressed transcriptional coactivator PGC-1α. Improving bioenergetics by overexpression of PGC-1α enhanced function in developing Tex cells. Therapeutic reinvigoration by anti-PD-L1 reprogrammed metabolism in a subset of Tex cells. These data highlight a key metabolic control event early in exhaustion and suggest that manipulating glycolytic and mitochondrial metabolism might enhance checkpoint blockade outcomes.


Figures

Figure 1
Figure 1. Altered regulation of metabolic genes early and late during clone 13 infection
Microarray profiling of LCMV GP33-specific CD8+ T cells in LCMV Arm or clone 13 infection (GSE41867) analyzed for (A) number of differentially expressed genes (2-fold or 4-fold cutoff). (B) GSEA analysis for KEGG glycolysis and gluconeogenesis pathways and OXPHOS pathways at d8 or d30 p.i. Negative enrichment score (ES) indicates enrichment in Arm infection (C) GSEA of the indicated KEGG metabolic pathways at d8 and d30 p.i. (D) Heatmap of leading edge genes driving gene set enrichment of KEGG metabolic pathways at d8p.i. See also Fig. S1.
Figure 2
Figure 2. Suppression of CD8+ T cell mitochondrial respiration and glycolysis early in chronic infection
Metabolic flux profiling was performed on purified CD8+ T cells from mice d8 p.i. with LCMV Arm (blue) or clone 13 (red). (A) OCR and ECAR at baseline. (B) OCR obtained during mitochondrial stress test, performed by injection of Oligomycin (Oligo), mitochondrial decoupler FCCP, Cpt1a inhibitor Etomoxir (Eto) to interrogate FAO or ETC inhibitors Antimycin A/Rotenone (Ant/Rot). (C and D) MRC and SRC of CD8+ T cells from d8 p.i. was determined after FCCP injection. (E) Compared to (2B), 2-DG injection was used to assess glucose metabolism. (F) The effect of CPT1a inhibition on SRC and (G) the contribution of FA metabolism (i.e. Eto-sensitive SRC) is plotted for CD8+ T cells from Arm versus clone 13. (H) The effect of 2-DG injection on mitochondrial respiration and (I) the contribution of glucose (i.e. the 2-DG-sensitive SRC). (J) Glucose uptake measured by incorporation of glucose analogue 2-NBDG and Glut-1 expression (K) of naïve CD8+ T cells and LCMV-specific P14 T cells isolated on d8 p.i. of Arm versus clone 13 infection. Data are representative of 3 independent experiments (3–5 mice / experimental group). * indicates p<0.05, ** p<0.01, *** p<0.001 by unpaired Student’s T-test. Error bars are mean ± SEM. See also Fig. S2 and S3.
Figure 3
Figure 3. Depolarized mitochondria in virus-specific CD8+ T cells in early clone 13 infection
Mitochondrial profiling of virus-specific CD8+ T cells at d8 after Arm (blue) or clone 13 (red) infection. Live, singlet CD8+ CD45.1+ P14 cells were analyzed (A) Mitotracker Green (MTG) staining of P14 cells at d8 p.i. (B) Virus-specific CD8+ T cells with depolarized mitochondria identified as positive for MTG and negative for Mitotracker DeepRed (MTDR) (triangle gate). (C) Electron microscopy of sorted P14 cells from uninfected, Arm or clone 13 infected mice (d8 p.i.). Cells with representative mitochondrial morphology are shown. (D) Representative plots of virus-specific CD8+ T cells at d8 p.i. of clone 13 with depolarized (red) versus regularly polarized mitochondria (grey). (E) ROS in P14 CD8+ T cells measured using MtSox. Cells were costained for Annexin V and amine-reactive L/D reagent. Gated on live singlet CD8+ CD45.1+ P14 cells, gates for MtSox and ROS are indicated on the left. (F) Amnis Imagestream analysis (60× magnification). Cells were gated on congenic CD45.1+ P14 and MTG versus MTDR staining was used to identify cells with depolarized mitochondria. Arrows indicate a representative cell staining with regular mitochondrial polarization (upper) versus depolarized mitochondria (lower). Nuclear integrity assessed by Hoechst 33342. Data are representative of 3 experiments (Imagestream: one experiment) with 3–5 mice in each experimental group. *** indicates p<0.001 by unpaired Student’s T-test. Error bars are mean ± SEM. See also Fig. S4
Figure 4
Figure 4. MTOR inhibition improves the mitochondrial phenotype during early clone 13 infection
Role of mTOR in developing Tex cells. (A) Time course of ex vivo pS6 in P14 CD8+ T cells during LCMV Arm or clone 13 infection. (B) Time course of pS6 following 20min GP33 stimulation in vitro. Gated on live singlet CD8+ P14. (C) Clone 13 infected mice were treated daily from d5–8 p.i with 300µg/kg rapamycin (Rapa) or PBS (control) and analyzed on d8 p.i. Frequencies of CD45.1+ P14 cells are shown. Gated on live singlet CD8+ T cells (D) P14 CD8+ T cells analyzed for expression of PD-1 and CD44 (E) Representative histograms for PD-1 or MTG of P14 CD8+ T cells from control or Rapa treated mice. (F) Mitochondrial mass (MTG), depolarization (MTG+MTDR) and ROS production (MtSox+) following Rapa treatment. (G) Glucose uptake by 2-NBDG fluorescence. (H) Functional profile of virus-specific T cells after GP33 peptide stimulation. Degranulating (CD107a+) P14 cells producing IFN-γ, TNF, IL-2, MIP1α, and frequency of polyfunctional cells is shown. Data are gated on live singlet CD8+CD45.1+ P14 cells. Data indicate n=3–5 mice / experimental group and are representative of 2 independent experiments. * indicates p<0.05, ** p<0.01 by unpaired Student’s T-test. Error bars are mean ± SEM
Figure 5
Figure 5. Mitochondrial mass, mTOR signaling and low mitochondrial bioenergetics during LCMV clone 13 infection
Mitochondrial phenotype, respiratory function and mTOR signaling of P14 cells analyzed after d8 p.i. of LCMV Arm (blue) or clone 13 (Cl13) (red) infection. (A) Normalized mitochondrial mass indicated by relative units (RU) of MTG fluorescence, and (B) representative histograms of MTG on d8 and d35 p.i. are shown gated on live singlet P14 cells. (C) The fraction of depolarized mitochondria for P14 CD8+ T cells on d35 p.i. on similar scale as in Fig. 2. (D and E) LCMV-specific CD8+ T cells were sorted after d35 of Arm and clone 13 infection and mitochondrial stress test performed by injection of Oligo, FCCP, Eto, or Ant/Rot as in Fig 2. (F) C57Bl/6 mice were depleted of CD4+ T cells, P14 cells adoptively transferred and infected with clone 13. Mice were treated with PD-L1 blocking or isotype control antibody from d22–35 p.i. Mitochondrial mass was determined in P14 CD8+ T cells from control or treated mice by MTG. (G) Representative data for glucose uptake by P14 CD8+ T cells (left column) from isotype (upper) or anti-PDL1 (lower) treated mice by 2-NBDG fluorescence. Glucose uptake in PD-1Int and PD-1Hi subsets (gated by PD-1 versus CD27) of virus-specific CD8+ T cells (right panel). (H) Glucose uptake for the PD-1Int and PD-1Hi subsets in 5G is quantified. Kinetic data in 5A summarizes 5 experiments (3–5 mice / experimental group). Data in 5B is representative of 3 experiments (n=3 per group). Data in 5D–E represents pooled data from one experiment. Data in 5G-H represents an experiment with n=10 mice.* indicates p<0.05, *** p<0.001 by unpaired Student’s T-test. Error bars are mean ± SEM. See also Fig. S5
Figure 6
Figure 6. PD-1 controls metabolic dysregulation of Tex cells in early and established chronic LCMV infection
(A) Congenically distinct Pdcd1+/+ (CD45.1+CD45.2) and Pdcd1−/− (CD45.1+CD45.2+) P14 CD8+ T cells were cotransferred into naïve (CD45.1CD45.2+) mice, followed by infection with clone 13 (cl13). The frequency of Pdcd1+/+ versus Pdcd1−/− P14 cells at d8 p.i. is shown. (B–F) Cotransferred Pdcd1+/+ and Pdcd1−/− P14 CD8+ T cells analyzed for glucose uptake (B), mitochondrial mass (C), mitochondrial depolarization (D), and functional parameters (F) at d8 p.i. with cl13. (E) Representative electron microscopy on sorted cotransferred Pdcd1+/+ and Pdcd1−/− P14 cells. (G–J) Metabolic flux was performed on negatively selected, magnetic bead purified CD8+ T cells from naïve uninfected, Arm or cl13 infected WT or Pdcd1−/− mice at d8 p.i. (G) Basal respiration. (H) Glycolytic stress test measuring ECAR performed by injecting glucose to glucosestarved cells, followed by Oligo. (I) Basal glycolysis was calculated by the increase in ECAR post glucose injection for Pdcd1−/− clone 13 infection (J) Glycolytic capacity was determined after Oligo injection * indicates p<0.05, ** p<0.01, *** p<0.001 by unpaired (G–J) or paired (6A–F) Student’s T-test. Error bars are mean ± SEM. See also Fig. S5
Figure 7
Figure 7. PGC1α overexpression improves metabolism of Tex cells and restores function
Expression of PGC1α was analyzed in developing Tex cells. (A) Cotransferred Pdcd1+/+ and Pdcd1−/− P14 CD8+ T cells were analyzed for PGC1α expression at d8 p.i. with clone 13. (B) GSEA of genes in the KEGG PPAR pathway at d8 p.i. with Arm or clone 13. (C) WT P14 cells were transduced with Ppargc1a RV and potential-dependent mitochondrial MTDR staining and glucose uptake analyzed at 48h and 96h post T cell activation. (D) RV-transduced P14 cells were transferred into mice at d1 of clone 13 infection and transduced P14 cells analyzed at d8 for PGC1α expression, glucose uptake, PD-1 expression and polyfunctionality. (F) Mitochondrial polarization analysis was performed at d8 p.i. with clone 13. Data indicate 3 independent experiments (n=3–5 mice/ group / experiment) * indicates p<0.05, ** p<0.01, by paired (A) or unpaired (D, E) Student’s T-test. Error bars are mean ± SEM.

Comment in

References

    1. Angelosanto JM, Blackburn SD, Crawford A, Wherry EJ. Progressive loss of memory T cell potential and commitment to exhaustion during chronic viral infection. J Virol. 2012;86:8161–8170. - PMC - PubMed
    1. Araki K, Turner AP, Shaffer VO, Gangappa S, Keller SA, Bachmann MF, Larsen CP, Ahmed R. mTOR regulates memory CD8 T-cell differentiation. Nature. 2009;460:108–112. - PMC - PubMed
    1. Austin S, St-Pierre J. PGC1alpha and mitochondrial metabolism--emerging concepts and relevance in ageing and neurodegenerative disorders. J Cell Sci. 2012;125:4963–4971. - PubMed
    1. Barber DL, Wherry EJ, Masopust D, Zhu B, Allison JP, Sharpe AH, Freeman GJ, Ahmed R. Restoring function in exhausted CD8 T cells during chronic viral infection. Nature. 2006;439:682–687. - PubMed
    1. Belikov AV, Schraven B, Simeoni L. T cells and reactive oxygen species. J Biomed Sci. 2015;22:85. - PMC - PubMed

MeSH terms

Substances