. 2016 Aug 16;45(2):374-88.
doi: 10.1016/j.immuni.2016.07.009. Epub 2016 Aug 2.

The Tumor Microenvironment Represses T Cell Mitochondrial Biogenesis to Drive Intratumoral T Cell Metabolic Insufficiency and Dysfunction

Affiliations

The Tumor Microenvironment Represses T Cell Mitochondrial Biogenesis to Drive Intratumoral T Cell Metabolic Insufficiency and Dysfunction

Nicole E Scharping et al. Immunity. .

Erratum in

Abstract

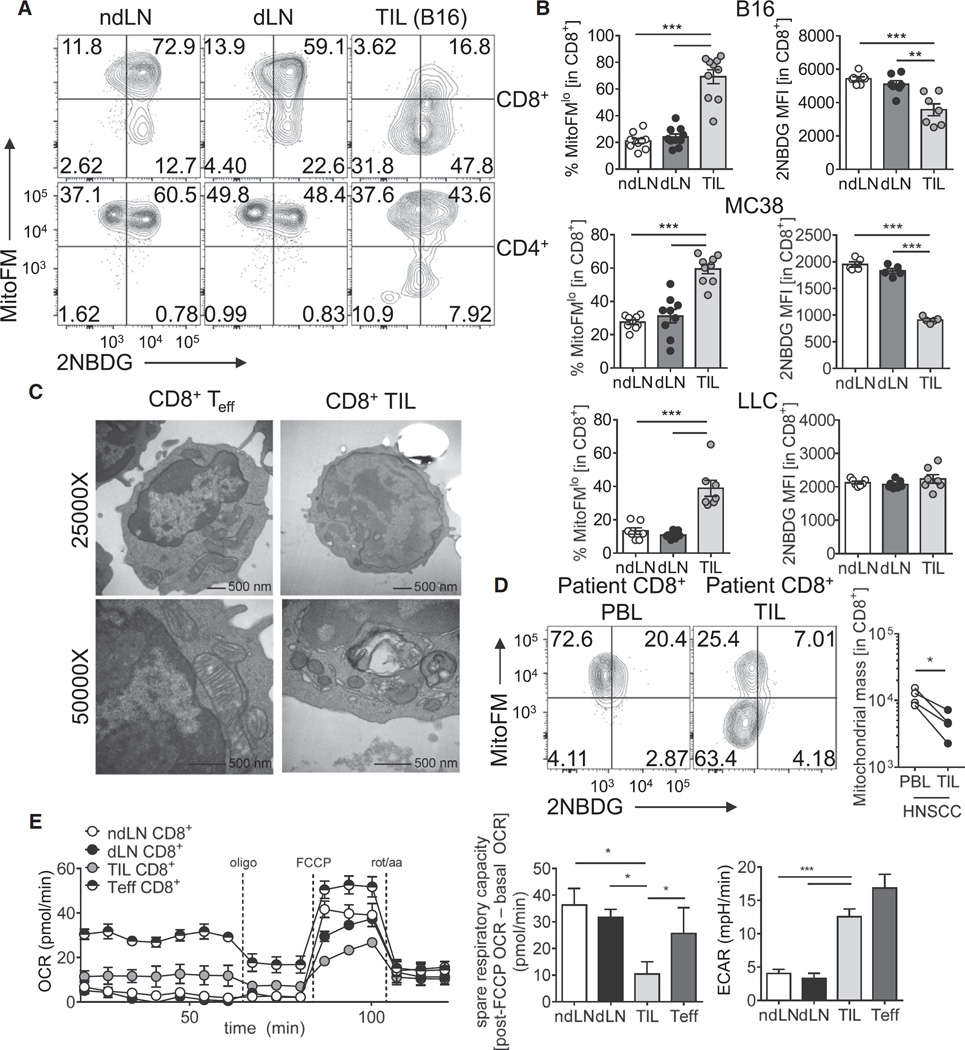
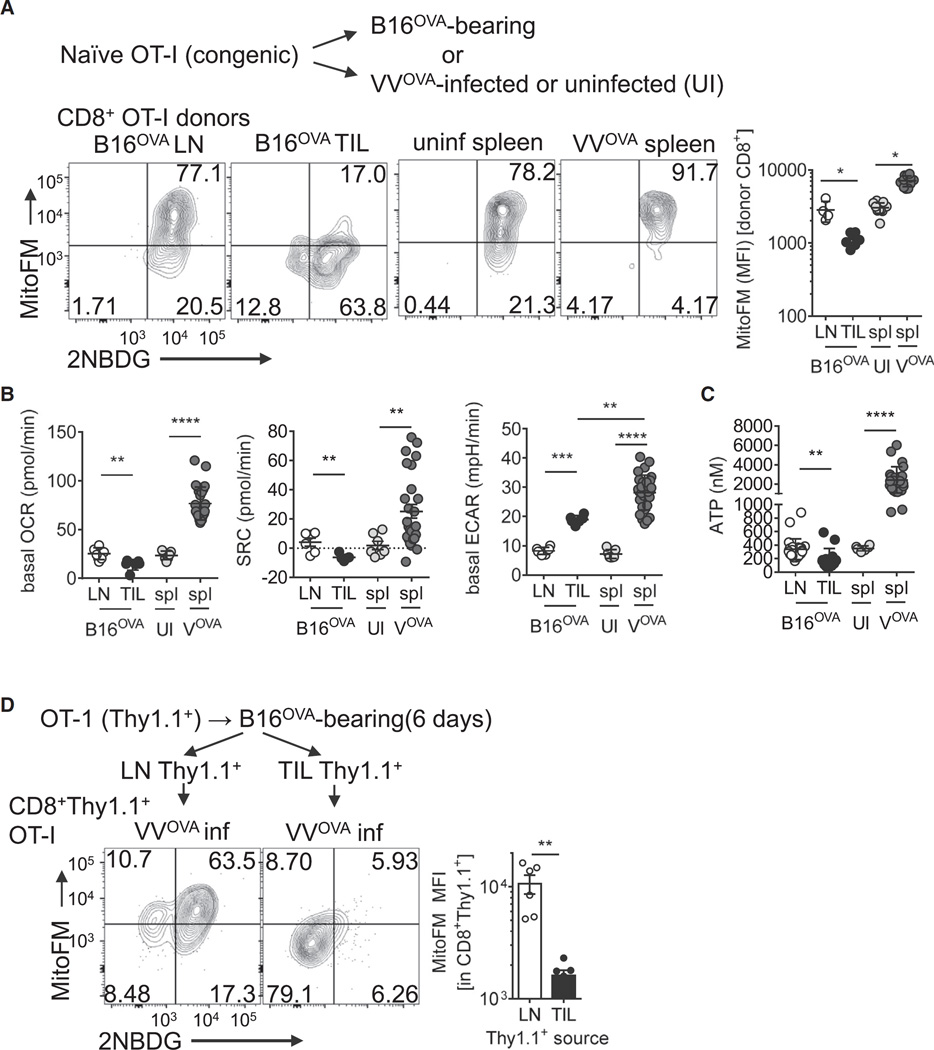
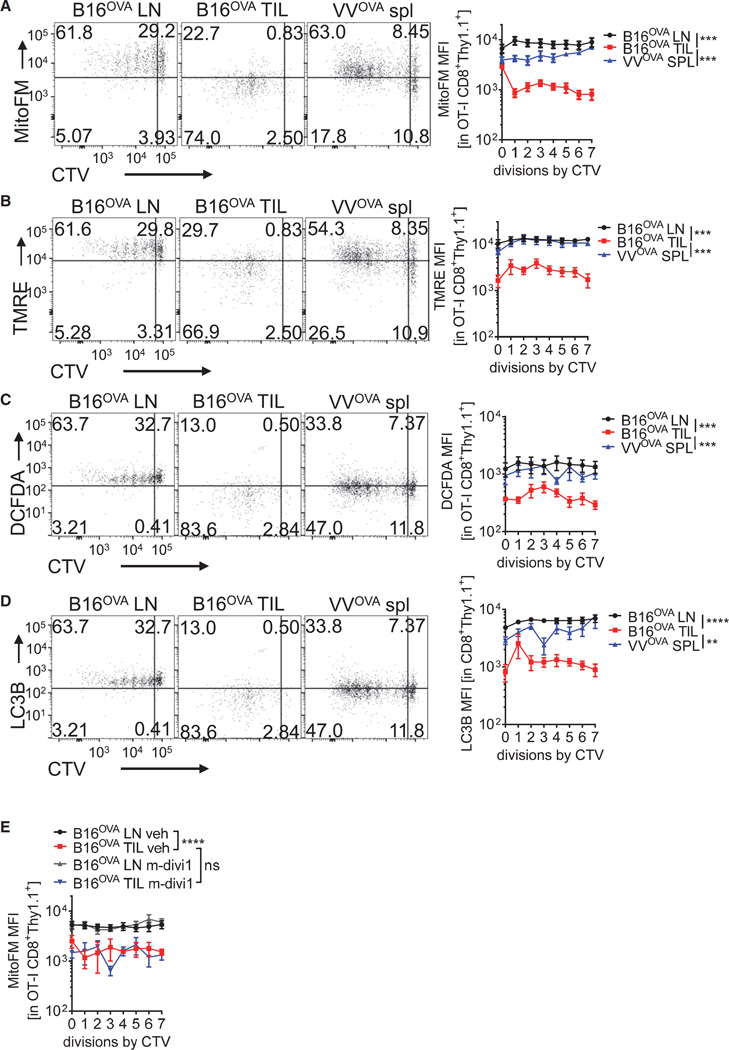
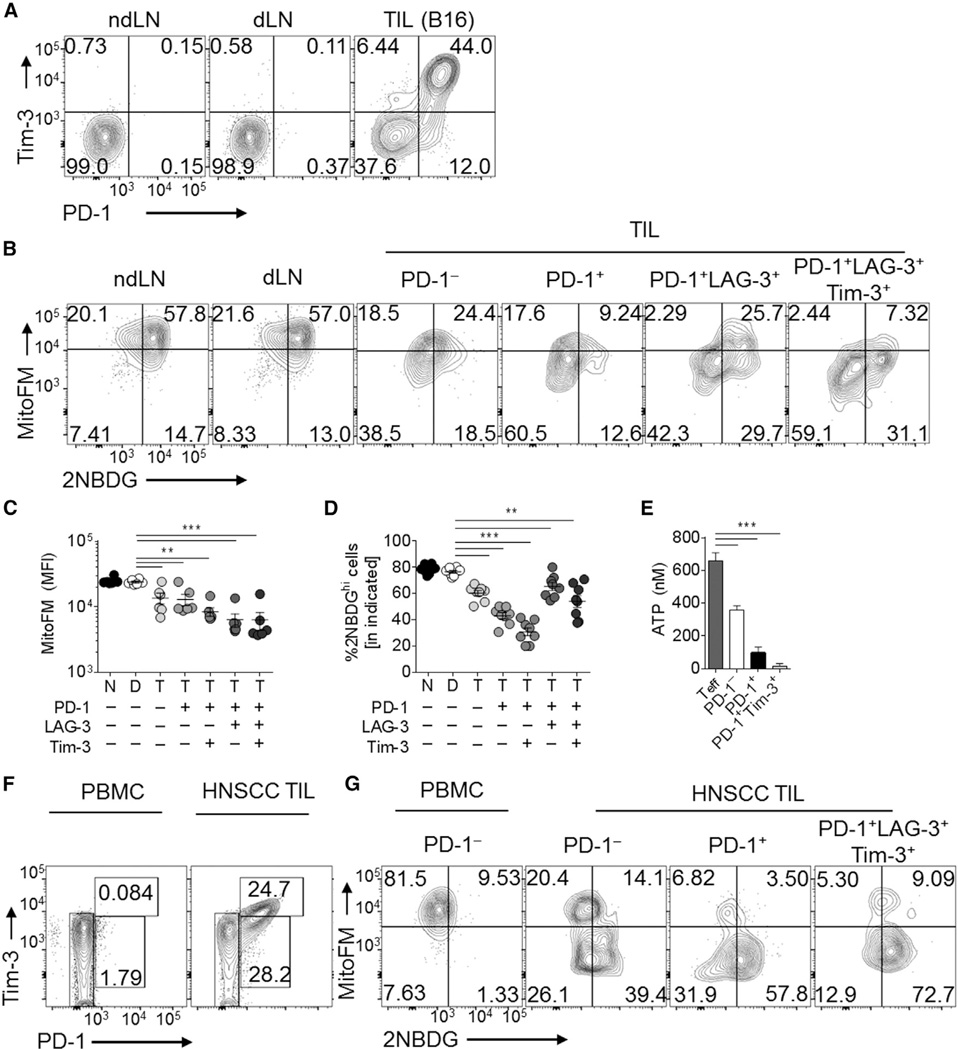
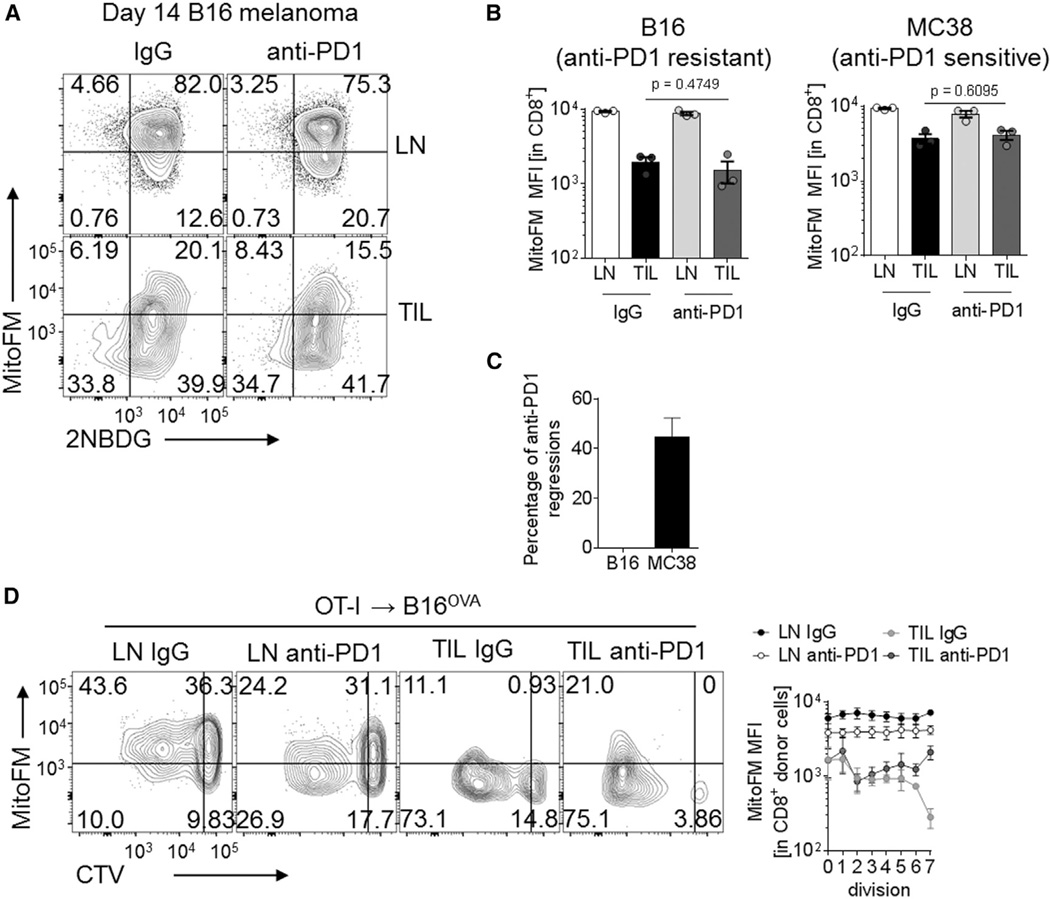
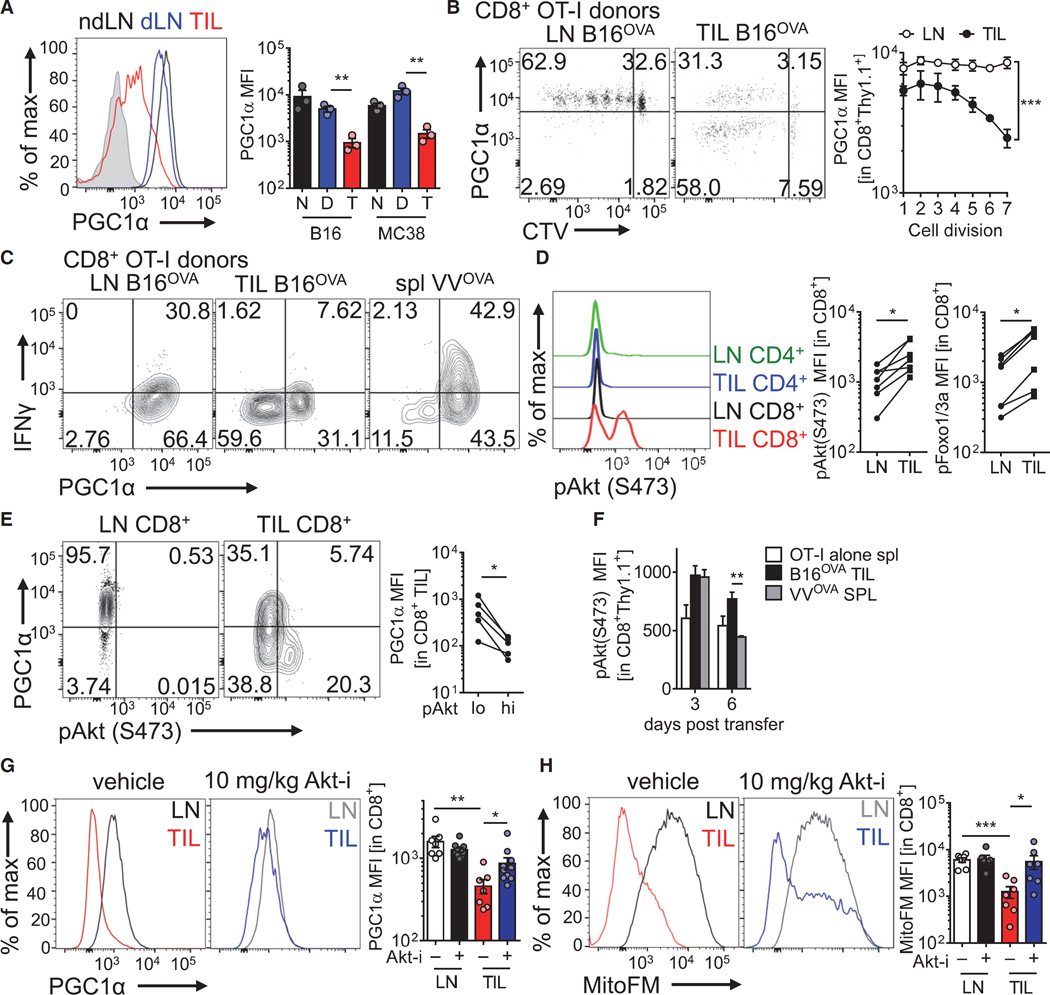
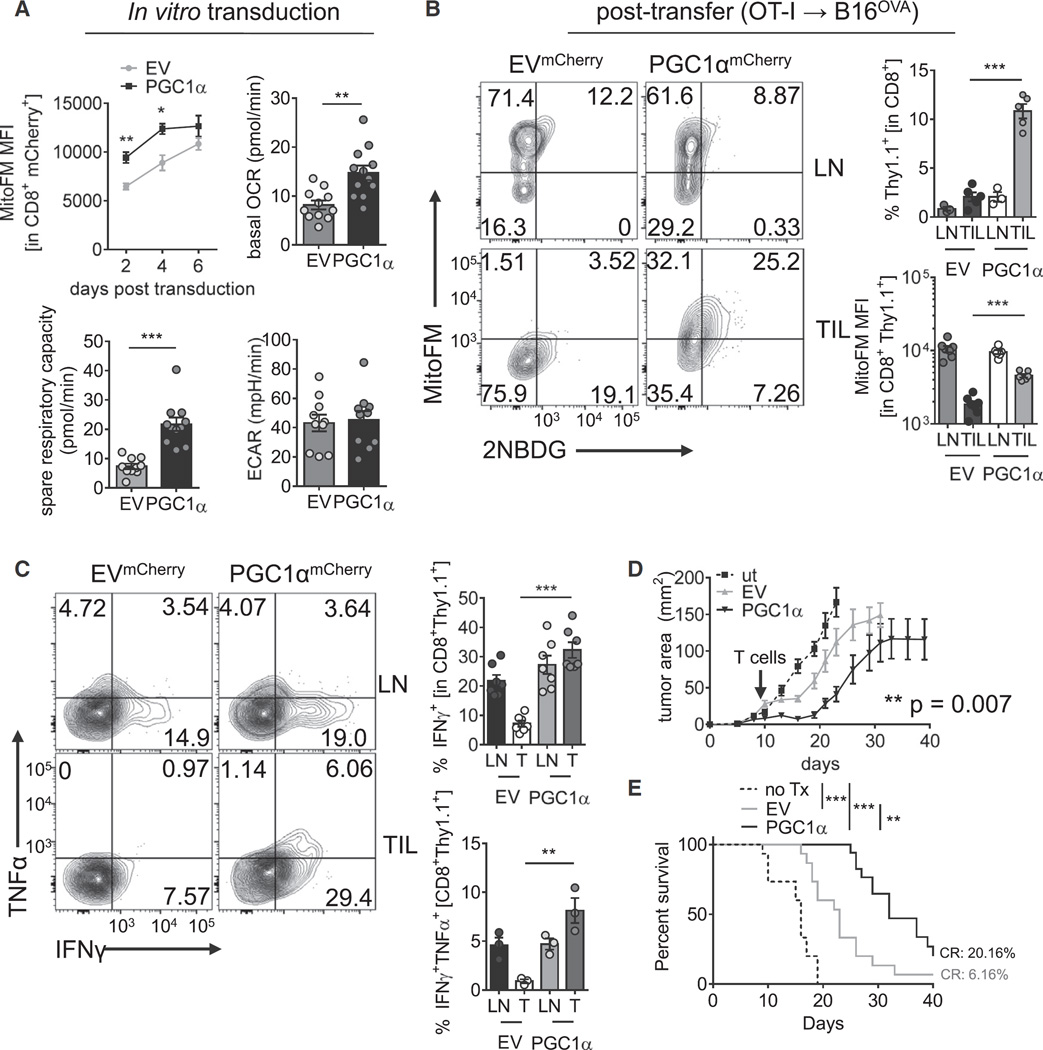
Although tumor-specific T cells recognize cancer cells, they are often rendered dysfunctional due to an immunosuppressive microenvironment. Here we showed that T cells demonstrated persistent loss of mitochondrial function and mass when infiltrating murine and human tumors, an effect specific to the tumor microenvironment and not merely caused by activation. Tumor-infiltrating T cells showed a progressive loss of PPAR-gamma coactivator 1α (PGC1α), which programs mitochondrial biogenesis, induced by chronic Akt signaling in tumor-specific T cells. Reprogramming tumor-specific T cells through enforced expression of PGC1α resulted in superior intratumoral metabolic and effector function. Our data support a model in which signals in the tumor microenvironment repress T cell oxidative metabolism, resulting in effector cells with metabolic needs that cannot be met. Our studies also suggest that modulation or reprogramming of the altered metabolism of tumor-infiltrating T cells might represent a potential strategy to reinvigorate dysfunctional T cells for cancer treatment.


Figures

Figure 1
Figure 1. Tumor-Infiltrating CD8+ T Cells Display Suppressed Mitochondrial Function and Mass
(A) Representative flow cytogram of nondraining (ndLN), draining (dLN) lymph node, or tumor-infiltrating lymphocyte (TIL) preparations from C57BL/6 mice inoculated with B16 melanoma cells 12 days prior, gated on CD8 or CD4 as indicated. (B) Tabulated flow cytometric data from CD8+ T cells isolated from mice bearing the indicated tumor types. Each circle represents an individual animal. (C) Transmission electron microscopy of activated or tumor-infiltrating CD8+ T cells. (D) MitoTracker FM staining of CD8+ T cells from peripheral blood lymphocyte (PBL) or TIL of HNSCC patients. (E) Oxygen consumption rate (OCR) trace (left) and metabolic analysis panels (middle, right) from CD8+ T cells isolated from the indicated sites from B16-bearing animals. T cells activated 24 hr with anti-CD3/anti-CD28 (Teff) are included as a control. Spare respiratory capacity (SRC) is calculated as the difference between initial, basal OCR values, and the maximal OCR values achieved after FCCP uncoupling. Data represent the mean or are representative of 3–5 independent experiments. *p < 0.05, **p < 0.01, ***p < 0.001 by unpaired t test. Error bars indicate SEM. See also Figure S1.
Figure 2
Figure 2. Loss of Mitochondrial Function and Mass Is Not Simply a Phenotype of Robust Activation In Vivo
(A) Representative flow cytogram and tabulated results of 2NBDG uptake and MitoTracker FM measurements of OT-I T cells injected into B16OVA-bearing or VVOVA-infected, or uninfected congenically mismatched hosts for 6 days. Plots are gated on CD8+ T cells and the congenic allele marker (Thy1). (B) Seahorse measurements (OCR, SRC, and ECAR) from cells in (A). (C) ATP measurements from purified donor cells from (A). (D) Flow cytogram of glucose uptake and mitochondrial mass of OT-I (Thy1.1+) T cells adoptively transferred into B16OVA bearing mice for 6 days, isolated from either LN or tumor, then transferred into VVOVA-infected mice for 6 days. Flow cytogram depicts splenic CD8+Thy1.1+ cells. *p < 0.05, **p < 0.01, ***p < 0.001 by unpaired ttest. Results represent four (A–C)or three (D) experiments. Circles represent individual animals. UI = uninfected VOVA= VVOVA-infected (1×10⁶ PFU IP), spl = spleen. Error bars indicate SEM. See also Figure S2.
Figure 3
Figure 3. T Cell Mitochondrial Dysfunction Is Induced upon Entry into the Tumor Microenvironment
(A) Representative flow cytogram and tabulated data of LN and TIL of naive, CellTrace Violet (CTV)-labeled, OT-I (Thy1.1+) CD8+ T cells transferred into B16OVA-bearing mice (5–7 mm tumors), or the spleens of the same progenitor cells transferred into B6 mice infected with 1 × 10⁶ PFU VVOVA for 72 hr. Cells were stained with MitoTracker Deep Red FM. (B) As in (A), but with the mitochondrial membrane potential dye TMRE. (C) As in (A), but with the cellular ROS indicator DCFDA. (D) As in (A), but cells were permeabilized and stained intracellularly for LC3B. (E) Representative data from experiments as in (A), but some mice received mitophagy inhibitor m-divi-1. Results represent the mean of three or four independent experiments, with n = 7–9 mice per group. **p < 0.01, ***p < 0.001, ***p < 0.0001 by two-way ANOVA. Error bars indicate SEM. See also Figure S3.
Figure 4
Figure 4. Mitochondrial Dysfunction in Intratumoral T Cells Is Progressive and Correlates with Coinhibitory Molecule Expression in Mouse and Human Tumors
(A) Representative flow cytogram of CD8+ T cells isolated from day 14 B16-bearing C57/BL6 mice. (B) Flow cytogram showing mitochondrial mass and glucose competency of CD8+ T cell subsets. (C and D) Tabulated data from (B). (E) ATP measurements from CD8+ T cells sorted directly ex vivo from tumors based on the indicated expression. Results are compared to LN CD8+CD44hi cells (Teff). (F) Cytogram of coinhibitory molecules and (G) mitochondria/glucose status of CD8+ cells from PBL or TIL from HNSCC patients. Data represent the mean or are representative of 3–5 independent experiments. *p < 0.05, **p < 0.01, ***p < 0.001 by unpaired t test. Error bars indicate SEM. See also Figure S4.
Figure 5
Figure 5. PD-1 Blockade Does Not Rescue Metabolic Dysfunction in Intratumoral T Cells
(A) Representative flow cytogram of CD8+ T cells from LN and TIL preparations in B16-bearing mice receiving thrice-weekly injections of 200 µg anti-PD1 or its isotype control. (B) Tabulated results from (A) as well as MC38-bearing mice. Each dot represents a mouse in this experiment. (C) Percentage of mice experiencing tumor regression in several experiments conducted as in (B). (D) Flow cytogram and tabulated values of MitoTracker FM staining during cell division of OT-I T cells transferred into established B16OVA tumors under the cover of anti-PD1 or its isotype control. Data are representative of five (A and B) or represent the mean of three (C and D) independent experiments. Error bars indicate SEM. See also Figure S5.
Figure 6
Figure 6. Intratumoral T Cell Mitochondrial Biogenesis Is Repressed by Chronic Akt-Mediated Repression of PGC1α
(A) Flow cytogram (left) and tabulated data (right) of PGC1α intracellular staining in CD8+ T cells isolated from nondraining or draining LNs or TIL preparations from B16 or MC38 bearing mice. Shaded histogram indicates isotype control. (B) Flow cytogram of PGC1α expression in CTV-labeled, naive OT-I T cells adoptively transferred into B16OVA bearing mice for 72 hr. Tabulation for multiple experiments is to the right. (C) Flow cytogram of cytokine production of congenically mismitached WT OT-I T cells transferred into B16OVA-bearing or VVOVA-infected mice for 96 hr, then restimulated with SIINFEKL peptide. (D) Representative and tabulated phospho-Akt (S473) and phospho-Foxo1(T24)/3a(T32) staining of the indicated cell populations in mice bearing 14-day B16 tumors. MFI is reported. (E) Representative flow cytogram and tabulated data indicating PGC1α staining in pAkt low or high cells. (F) MFI of pAkt staining in naive OT-I T cells, or OT-I T cells transferred for 3 or 6 days into a B16OVA-bearing or VVOVA infected mouse. (G) PGC1α levels and (H) mitochondrial mass of CD8+ T cells from LN and TIL of 14-day B16-bearing mice treated for 60 hr with Akt inhibitor VIII or its vehicle. Results are representative of five (A, B, and D), three (C, E, G, and H), ortwo (F) independent experiments.*p< 0.05, **p <0.01, ***p < 0.001 by unpaired t test (A, F, G, and H) or paired t test (D, E, G, and H). ***p < 0.001 by two-way ANOVA. Error bars indicate SEM. See also Figure S6.
Figure 7
Figure 7. Bolstering Mitochondrial Biogenesis Improves Intratumoral T Cell Function
(A) Metabolic analysis of OT-I T cells retrovirally transduced with an empty mCherry vector (EV) or one encoding PGC1α. MitoTracker FM staining at various time points post transduction is indicated. OCR, SRC, and ECAR values are from day 5–7 post transduction. (B) Representative flow cytogram of LN- and TIL-resident OT-I T cells transduced as in (A) and transferred into B16OVA bearing C57/BL6 mice. Proportion of the transferred cells in LN and TIL and tabulated MitoTracker FM staining is reported. (C) Flow cytogram depicting cytokine synthesis in OT-I T cells transferred as in (B) and restimulated directly ex vivo with cognate peptide. Results are tabulated to the right. (D) Tumor growth plot of B16OVA bearing mice treated therapeutically upon detection of palpable tumors on day 7 with 250,000 (< 4mm2) or 500,000 (> 4mm2) of PGC1α or control-expressing cells. (E) Survival plot from e.n = 15–17 mice per group. Results represent six (A and B), four (C), or three (D and E) independent experiments. **p < 0.01, ***p < 0.001 by unpaired t test (A–C), two-way ANOVA with repeated-measures (D), or log-rank test (E). Error bars indicate SEM. See also Figure S7.

Comment in

References

    1. Alvarez-Guardia D, Palomer X, Coll T, Davidson MM, Chan TO, Feldman AM, Laguna JC, Vázquez-Carrera M. The p65 subunit of NF-kappaB binds to PGC-1alpha, linking inflammation and metabolic disturbances in cardiac cells. Cardiovasc. Res. 2010;87:449–458. - PubMed
    1. Borniquel S, García-Quintáns N, Valle I, Olmos Y, Wild B, Martínez-Granero F, Soria E, Lamas S, Monsalve M. Inactivation of Foxo3a and subsequent downregulation of PGC-1 alpha mediate nitric oxide-induced endothelial cell migration. Mol. Cell. Biol. 2010;30:4035–4044. - PMC - PubMed
    1. Chang CH, Qiu J, O’Sullivan D, Buck MD, Noguchi T, Curtis JD, Chen Q, Gindin M, Gubin MM, van der Windt GJ, et al. Metabolic Competition in the Tumor Microenvironment Is a Driver of Cancer Progression. Cell. 2015;162:1229–1241. - PMC - PubMed
    1. Cottet-Rousselle C, Ronot X, Leverve X, Mayol J-F. Cytometric assessment of mitochondria using fluorescent probes. Cytometry A. 2011;79:405–425. - PubMed
    1. Crespo J, Sun H, Welling TH, Tian Z, Zou W. T cell anergy, exhaustion, senescence, and stemness in the tumor microenvironment. Curr. Opin. Immunol. 2013;25:214–221. - PMC - PubMed

Publication types

MeSH terms

Substances