Review
. 2016:578:273-97.
doi: 10.1016/bs.mie.2016.05.023. Epub 2016 Jul 9.

Conformational Sub-states and Populations in Enzyme Catalysis

Affiliations
Review

Conformational Sub-states and Populations in Enzyme Catalysis

P K Agarwal et al. Methods Enzymol. 2016.

Abstract

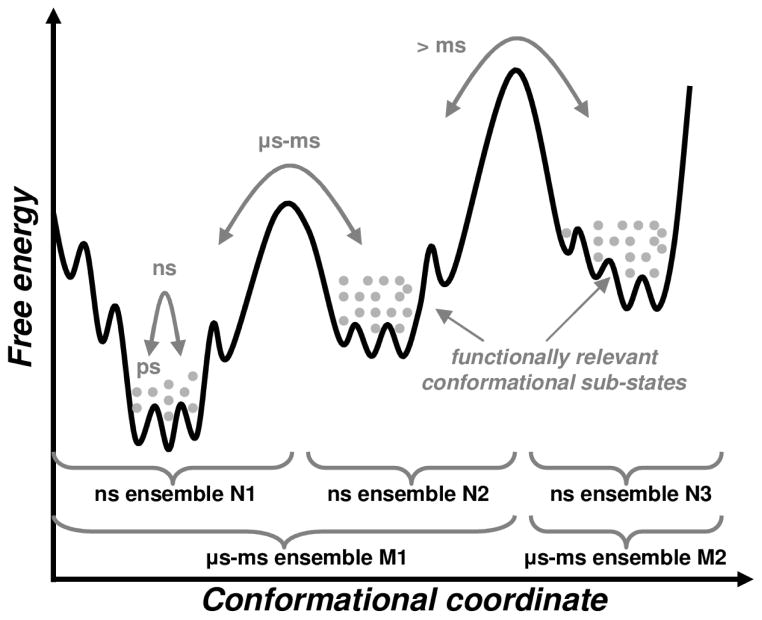
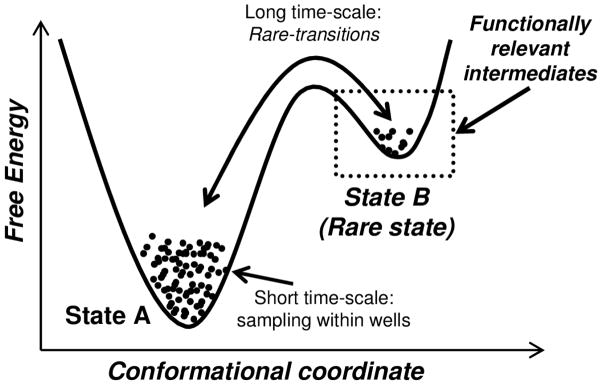
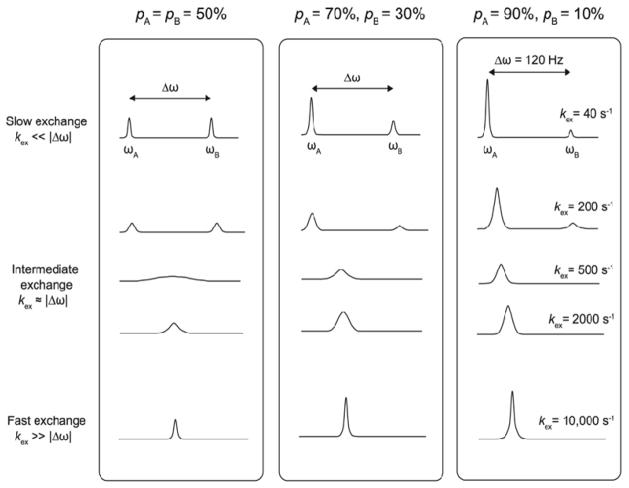
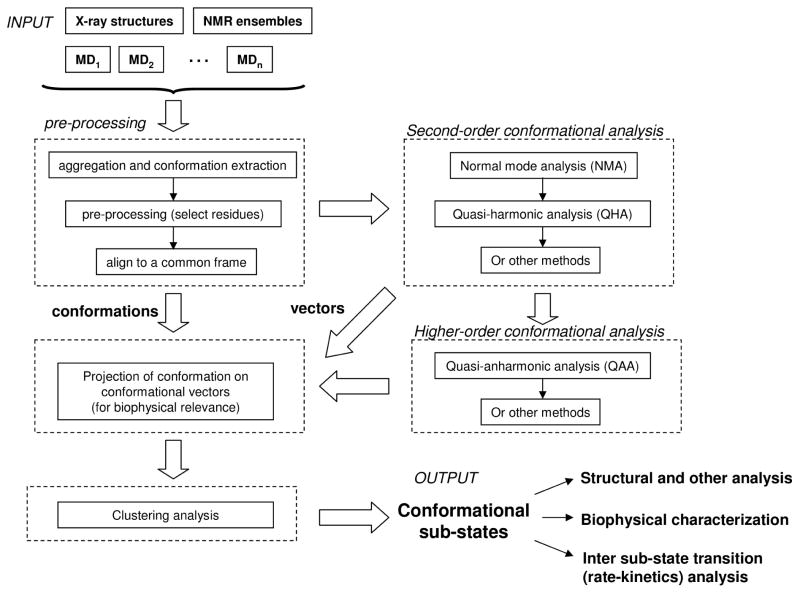
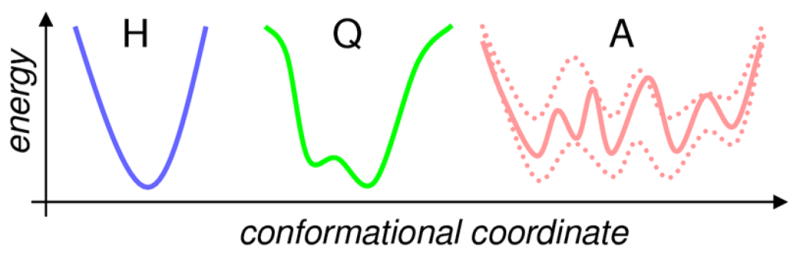
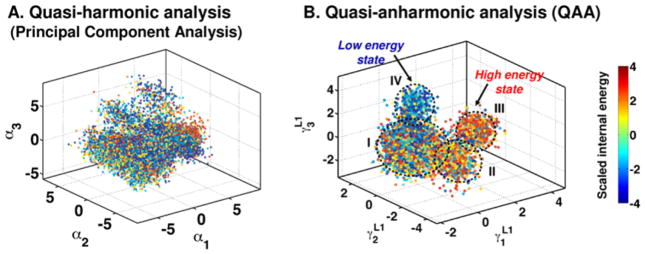
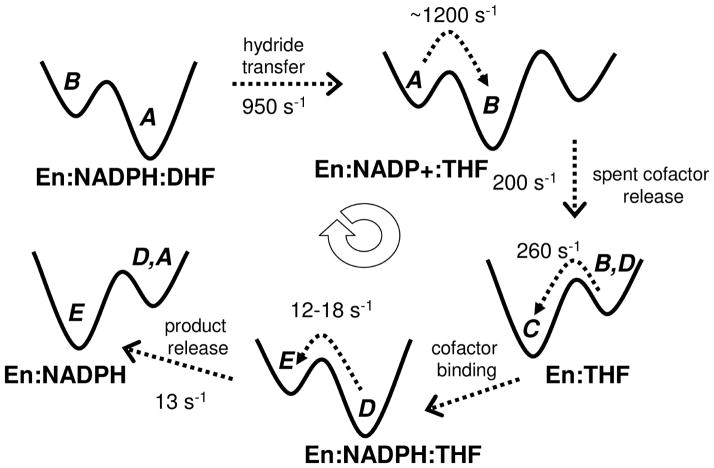
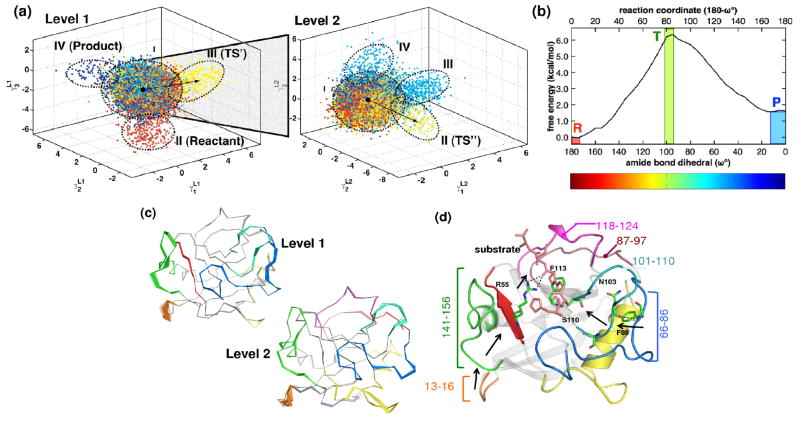
Enzyme function involves substrate and cofactor binding, precise positioning of reactants in the active site, chemical turnover, and release of products. In addition to formation of crucial structural interactions between enzyme and substrate(s), coordinated motions within the enzyme-substrate complex allow reaction to proceed at a much faster rate, compared to the reaction in solution and in the absence of enzyme. An increasing number of enzyme systems show the presence of conserved protein motions that are important for function. A wide variety of motions are naturally sampled (over femtosecond to millisecond time-scales) as the enzyme complex moves along the energetic landscape, driven by temperature and dynamical events from the surrounding environment. Areas of low energy along the landscape form conformational sub-states, which show higher conformational populations than surrounding areas. A small number of these protein conformational sub-states contain functionally important structural and dynamical features, which assist the enzyme mechanism along the catalytic cycle. Identification and characterization of these higher-energy (also called excited) sub-states and the associated populations are challenging, as these sub-states are very short-lived and therefore rarely populated. Specialized techniques based on computer simulations, theoretical modeling, and nuclear magnetic resonance have been developed for quantitative characterization of these sub-states and populations. This chapter discusses these techniques and provides examples of their applications to enzyme systems.

Keywords: Computational modeling; Conformational dynamics; Conformational population; Conformational substates; Enzyme dynamics; Nuclear magnetic resonance; Protein relaxation.


Figures

Figure 1
Figure 1. Conformational sub-states in enzyme landscape
Protein motions allow an enzyme to sample a variety of conformational sub-states. Motions within sub-states occur on fast time-scales (ps-ns) and conformational fluctuations at longer time-scales (μs-ms and >ms) allow overcoming large barriers, enabling access to other sub-states in the conformation hierarchy. Gray dots indicate unique conformations. The conformations within each well (sub-state) form ns ensembles (N1, N2 and N3), while μs-ms ensembles would correspond to wider areas (M1 and M2). This figure is partially is based on information from ref. (Kleckner & Foster, 2011).
Figure 2
Figure 2. Conformational transitions enable enzymes to sample higher energy sub-states
In a hypothetical case where enzyme samples two states A and B. State A is in lower energy and has higher population and state B is higher in energy and has lower population. State B contains conformations that are functionally relevant; therefore, in this case the sampling of conformation transitions at long time-scale (and its rate) that enable access to state B will be important for function as well.
Figure 3
Figure 3. Two-site conformational exchange experienced by a 1H-15N amide vector sampling distinct weighted populations of states A and B on various NMR time-scales
All three columns report on simulated two-state chemical exchange where the populations of each state (pA and pB) are skewed, with Δω = 120 Hz and kex = 40, 200, 500, 2000 or 10,000 s−1. For clarity, values of Δω and kex are only labeled in the right column. Slow exchanging populations sampling states A and B give rise to two distinct line shapes corresponding to magnetically distinct conformers of equal weight (column 1, ωA and ωB), separated by chemical shift difference Δω. Resonance signal broadening results from increased rates of chemical exchange between each state (local dynamics) on the intermediate and fast time-scale regimes, where a single weighted-average chemical shift population is observed (kex > 500 s−1 in this particular example). A single, sharper signal with distinct intensity and line width is observed on faster time-scales. A similar behavior is observed when the pA and pB population ratio is significantly skewed in favor of ground state A (columns 2 and 3). While excited state B is invisible on intermediate and fast time-scales, the shape and chemical shift of the resulting NMR signal is proportional to each population state. Relaxation-dispersion NMR experiments such as the rcCPMG and R methods provide the theoretical means to extract, analyze and quantify these hidden, low-populated states experiencing conformational exchange on the millisecond time-scale, which often overlaps with the rate of catalysis (kcat) in many enzyme systems. Adapted from ref. (Kempf & Loria, 2004).
Figure 4
Figure 4. Protocol for extraction of conformational sub-states and populations
The input to the method is a set of structures or conformations (from X-ray, NMR or MD simulations), which after preprocessing are used to obtain second-order conformational vectors. For more accurate characterization higher-order methods are used. The obtained vectors are used for projecting the conformations from initial set of conformations. The results are analyzed by clustering method to classify the conformations into sub-states.
Figure 5
Figure 5. Protein energy landscape
(along individual conformational coordinates) can be classified as harmonic (H), quasi-harmonic (Q) or anharmonic (A). Harmonic landscapes with a single sub-state (well) can be well described by second-order methods. Quasi-harmonic landscapes can be approximated by second-order methods depending on how well a harmonic function is able to fit into the multiple sub-states. Anharmonic landscapes with multiple substates are poorly approximated by second-order methods and require higher-order methods for accurate characterization.
Figure 6
Figure 6. The benefit of using a higher-order statistical method allows identification of conformational sub-states with homogeneous properties
Conformational sub-states identification for protein ubiquitin was performed using two different methods. (A) The conformational sub-states identified by second-order methods such as quasi-harmonic analysis and principal component analysis do not achieve clear of separation and the population of the conformation show mixed properties. (B) Using a higher-order method such as quasi-anharmonic analysis (QAA) allows identification of sub-states that are clearly separated and conformations have homogeneous properties. In both panels, each dot corresponds to a single conformation and the coloring is by scaled internal conformational energy.
Figure 7
Figure 7. Conformational sub-states associated with the catalytic activity of enzyme E. coli DHFR
The enzyme DHFR (En) catalytic cycle consists of 5 intermediate states associated with binding and release of cofactor NAPDH, substrate DHF, spent substrate NADP+ and product THF. Each of these intermediate sample multiple enzyme conformations sub-states (A, B, C, D, or E). The available rates of conversion between the intermediates and the conformational exchange between sub-states are labeled. Note that for each of these intermediate states the lower energy well will have higher population and the higher energy wells will have much lower conformational populations. Adapted from (Boehr, McElheny, et al., 2006).
Figure 8
Figure 8. Computational method QAA allows identification of multi-scale hierarchy associated with catalysis by enzyme CypA
(a) Multi-level (2 levels shown) hierarchy of conformational sub-states, each dot is a conformations. Each colored dot represents a single sampled conformation; ellipses indicate sub-states; TS′, TS″, and T indicate transition state area. (b) the free energy profile and conformations in (a) are colored according to reaction coordinate, (c) conformational change between sub-states corresponding to black arrow in (a), and (d) impact of identified motions on CypA’s mechanism. Adapted from (Ramanathan et al., 2011).

References

    1. Agarwal PK. Cis/trans isomerization in HIV-1 capsid protein catalyzed by cyclophilin A: Insights from computational and theoretical studies. Proteins-Structure Function and Bioinformatics. 2004;56(3):449–463. - PubMed
    1. Agarwal PK. Role of protein dynamics in reaction rate enhancement by enzymes. Journal of the American Chemical Society. 2005;127(43):15248–15256. - PubMed
    1. Agarwal PK. Enzymes: An integrated view of structure, dynamics and function. Microbial Cell Factories. 2006;5:2. - PMC - PubMed
    1. Agarwal PK, Geist A, Gorin A. Protein dynamics and enzymatic catalysis: Investigating the peptidyl-prolyl cis-trans isomerization activity of cyclophilin A. Biochemistry. 2004;43(33):10605–10618. - PubMed
    1. Benkovic SJ. Catalytic Antibodies. Annual Review of Biochemistry. 1992;61:29–54. - PubMed

LinkOut - more resources