. 2016 Oct:127:74-83.
doi: 10.1016/j.visres.2016.07.006. Epub 2016 Aug 9.

A touchscreen based global motion perception task for mice

Affiliations

A touchscreen based global motion perception task for mice

Jeffrey Stirman et al. Vision Res. 2016 Oct.

Abstract

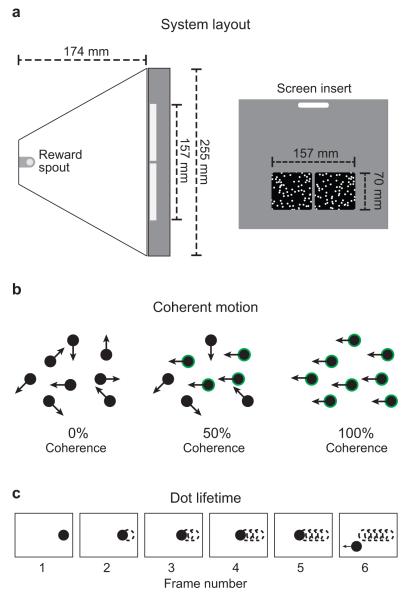
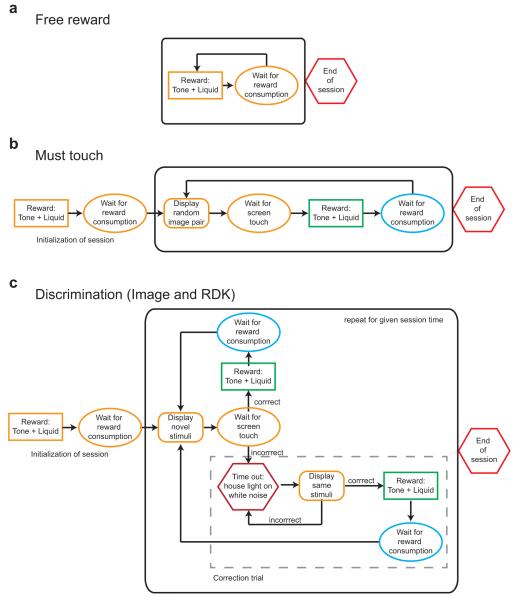
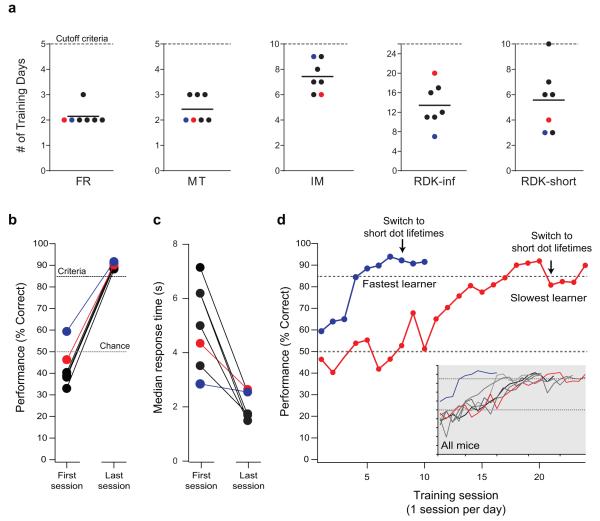
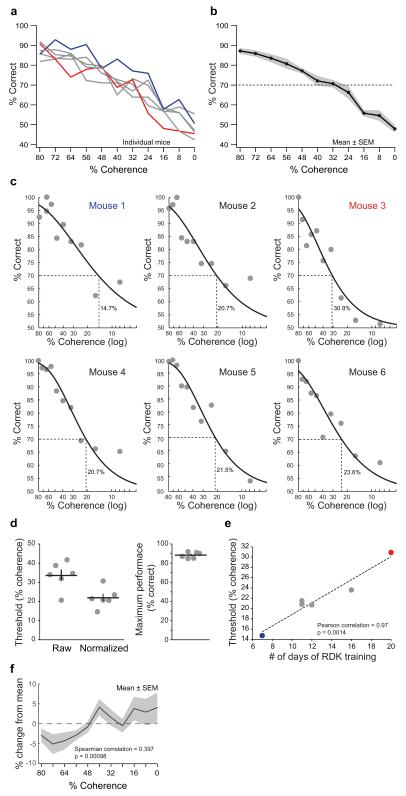
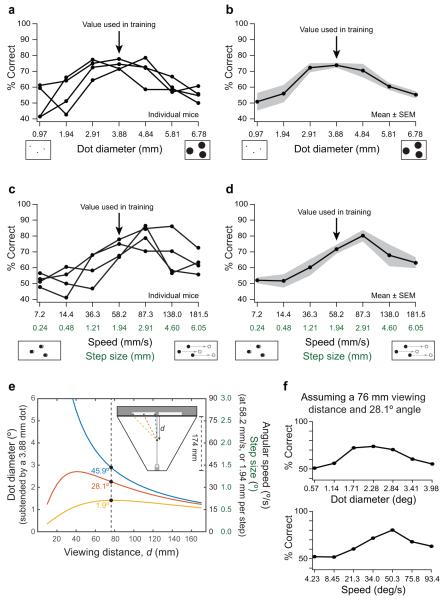
Global motion perception is a function of higher, or extrastriate, visual system circuitry. These circuits can be engaged in visually driven navigation, a behavior at which mice are adept. However, the properties of global motion perception in mice are unclear. Therefore, we developed a touchscreen-based, two-alternative forced choice (2AFC) task to explore global motion detection in mice using random dot kinematograms (RDK). Performance data was used to compute coherence thresholds for global motion perception. The touchscreen-based task allowed for parallel training and testing with multiple chambers and minimal experimenter intervention with mice performing hundreds of trials per session. Parameters of the random dot kinematograms, including dot size, lifetime, and speed, were tested. Mice learned to discriminate kinematograms whose median motion direction differed by 90 degrees in 7-24days after a 10-14day pre-training period. The average coherence threshold (measured at 70% correct) in mice for this task was 22±5%, with a dot diameter of 3.88mm and speed of 58.2mm/s. Our results confirm the ability of mice to perform global motion discriminations, and the touchscreen assay provides a flexible, automated, and relatively high throughput method with which to probe complex visual function in mice.

Keywords: Global motion processing; Higher visual areas; Psychophysics; Random dot kinematograms; Touchscreen chamber.


Figures

Figure 1
Figure 1. System layout and random dot kinematogram (RDK) visual stimuli
(a) Dimensions of the touchscreen based behavioral apparatus are given. On the left is the trapezoidal enclosure utilized and on the right is the screen insert used to delineate the two sides of the stimuli. (b) Examples for three coherence levels for the RDK are shown. Circles with the green outline belong to the coherent group and travel in the same direction. (c) Each subsequent frame the dot travels a given step size. After a given number of frames (dot lifetime) the dot disappears and appears in a new location. The example given is for a dot lifetime of 5 frames.
Figure 2
Figure 2. Training flowcharts
(a) In the Free Reward (FR) stage, the mouse associates the tone with a reward and learns the location of the reward. (b) In the Must Touch stage, the mouse learns to associate touching the screen with reward delivery. In this stage, touching either side of the screen results in a reward. (c) In the Image Discrimination (IM) stage of training, the mouse is only rewarded for touching the side of the screen presenting the target static image stimulus. In Random Dot Kinematogram (RDK) training, the task is identical to IM except both stimuli are moving dot kinematograms.
Figure 3
Figure 3. RDK discrimination learning
(a) The number of training days for each mouse until performance criteria were met for progression to the next stage (solid line indicates the population mean). The “cutoff criteria” (dotted line) is the maximum number of training days allowed for a stage. (b) Initial and final performance during training on the RDK task. On the first day of training the mice were close to chance level (dotted line at 50%). After 10-24 days of training, all mice had acquired the task to the criteria level (dotted line at 85%). (c) The median response time (time from the presentation of the stimulus until the selection of a stimulus) for each animal on both the initial and final days of RDK training indicates that there is a significant decrease (p = 0.004, paired t-test) the in response time after the mice learned the task. (d) RDK training curves of the fastest (blue) and slowest (red) mice to reach the criteria. Acquisition of the RDK task occurred over 10-24 days of training (one training session per day). The arrow indicates the switch from infinite dot lifetime to finite dot lifetime. Due to the decrease in coherence level created by the change in dot lifetime, the performance of the mice decreased. In the inset, the RDK training curves for all mice showing performance across training sessions are shown. Criteria level (85%) and chance level (50%) are indicated. The tick marks on the inset plot have the same values as those shown on the larger plot.
Figure 4
Figure 4. Psychometric curves
(a) Coherence curves were obtained for six mice by interleaving testing and training blocks. During testing blocks, mice were presented stimulus pairs of coherence levels between 80% and 0% in random order, allowing us to sample the full range of coherence values for each animal. Feedback was not given on trial performance during testing blocks as all answers were rewarded as if correct. Training blocks with performance feedback using stimuli at 80% coherence were given after a testing block and served as an internal control. The fastest (blue) and slowest (red) learners are labeled. (b) The average (black line) and s.e.m. (gray shading) for the six mice tested in (a). The threshold for performance was considered 70% correct and is plotted as a dotted line. (c) Weibull curves were fit to the data normalized to maximum performance for each animal. The coherence threshold for each mouse is labeled in the corresponding graph and denoted with a dotted line. The fastest (blue) and slowest (red) learners are labeled. (d) Parameters from the Weibull curve fits yielded the coherence threshold (percent coherence at 70% accuracy) for both the raw and data normalized (left) and the maximum performance (right). The horizontal bar indicates the mean and the vertical bar is the S.E.M. (e) The number of days of training a mouse required on the infinite dot lifetime RDK task correlated with the psychophysical measure of coherence threshold. The fastest (blue) and slowest (red) learners are labeled. (f) Mean of the fastest 50% of response times (measured from the start of the stimulus presentation until the selection occurred) for each coherence level for each mouse was normalized to their mean and was then averaged. The mean of the six mice show a positive Spearman correlation (Spearman correlation = 0.397; p = 0.00098).
Figure 5
Figure 5. Comparing stimulus parameters and performance
After training and coherence testing were successfully completed, a separate testing day was used to examine mouse performance with changes in either dot diameter (a, b) or speed (step size) (c, d). Both dot diameter and speed were tested under a constant coherence of 48% to avoid a ceiling effect. (a) Individual mouse performance as dot size was varied. (b) The mean (black) and S.E.M. (gray) of the 4 mice from (a). (c) Individual mouse performance as the speed (resulting in changes in the step size) was varied. (d) The mean (black) and S.E.M. (gray) of the 4 mice from (c). The arrows in a-d indicate the values used for training. (e) Apparent size and speed of a dot (in degrees of visual field) changes as a function of viewing distance along the normal to the screen and along the perpendicular direction. As the animal approaches the screen along the midline, the relative dot size and speed increases for the dots closest to the midline (blue), and increases until a maximum is reached before decreasing again for the dots further from the midline (red, yellow). Viewing angles for the three screen location for a 76 mm viewing distance (along the central axis of the chamber) are indicated. (f) Panels (b) and (d) have been plotted with the x-axis converted to mm and mm/s assuming a viewing distance of 76 mm and angle of 28.1°.

References

    1. Orger MB, Smear MC, Anstis SM, Baier H. Perception of Fourier and non-Fourier motion by larval zebrafish. Nat Neurosci. 2000;3(11):1128–33. - PubMed
    1. Fisher YE, Silies M, Clandinin TR. Orientation Selectivity Sharpens Motion Detection in Drosophila. Neuron. 2015;88(2):390–402. - PMC - PubMed
    1. Goodale MA, Milner AD. Separate visual pathways for perception and action. Trends Neurosci. 1992;15(1):20–5. - PubMed
    1. Newsome WT, Pare EB. A selective impairment of motion perception following lesions of the middle temporal visual area (MT) J Neurosci. 1988;8(6):2201–11. - PMC - PubMed
    1. Newsome WT, Wurtz RH, Dursteler MR, Mikami A. Deficits in visual motion processing following ibotenic acid lesions of the middle temporal visual area of the macaque monkey. J Neurosci. 1985;5(3):825–40. - PMC - PubMed

Publication types