Dimerization Controls Marburg Virus VP24-dependent Modulation of Host Antioxidative Stress Responses
- PMID: 27497688
- PMCID: PMC5010500
- DOI: 10.1016/j.jmb.2016.07.020
Dimerization Controls Marburg Virus VP24-dependent Modulation of Host Antioxidative Stress Responses
Abstract
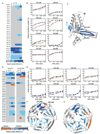
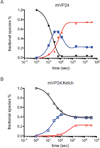
Marburg virus (MARV), a member of the Filoviridae family that also includes Ebola virus (EBOV), causes lethal hemorrhagic fever with case fatality rates that have exceeded 50% in some outbreaks. Within an infected cell, there are numerous host-viral interactions that contribute to the outcome of infection. Recent studies identified MARV protein 24 (mVP24) as a modulator of the host antioxidative responses, but the molecular mechanism remains unclear. Using a combination of biochemical and mass spectrometry studies, we show that mVP24 is a dimer in solution that directly binds to the Kelch domain of Kelch-like ECH-associated protein 1 (Keap1) to regulate nuclear factor (erythroid-derived 2)-like 2 (Nrf2). This interaction between Keap1 and mVP24 occurs through the Kelch interaction loop (K-Loop) of mVP24 leading to upregulation of antioxidant response element transcription, which is distinct from other Kelch binders that regulate Nrf2 activity. N-terminal truncations disrupt mVP24 dimerization, allowing monomeric mVP24 to bind Kelch with higher affinity and stimulate higher antioxidative stress response element (ARE) reporter activity. Mass spectrometry-based mapping of the interface revealed overlapping binding sites on Kelch for mVP24 and the Nrf2 proteins. Substitution of conserved cysteines, C209 and C210, to alanine in the mVP24 K-Loop abrogates Kelch binding and ARE activation. Our studies identify a shift in the monomer-dimer equilibrium of MARV VP24, driven by its interaction with Keap1 Kelch domain, as a critical determinant that modulates host responses to pathogenic Marburg viral infections.
Keywords: Marburg virus; VP24; antioxidative stress; hydrogen deuterium exchange mass spectrometry; viral subversion.
Copyright © 2016 Elsevier Ltd. All rights reserved.
Figures


Similar articles
-
Impact of Měnglà Virus Proteins on Human and Bat Innate Immune Pathways.J Virol. 2020 Jun 16;94(13):e00191-20. doi: 10.1128/JVI.00191-20. Print 2020 Jun 16. J Virol. 2020. PMID: 32295912 Free PMC article.
-
The Marburg virus VP24 protein interacts with Keap1 to activate the cytoprotective antioxidant response pathway.Cell Rep. 2014 Mar 27;6(6):1017-1025. doi: 10.1016/j.celrep.2014.01.043. Epub 2014 Mar 13. Cell Rep. 2014. PMID: 24630991 Free PMC article.
-
Marburg Virus VP24 Protein Relieves Suppression of the NF-κB Pathway Through Interaction With Kelch-like ECH-Associated Protein 1.J Infect Dis. 2015 Oct 1;212 Suppl 2(Suppl 2):S154-9. doi: 10.1093/infdis/jiv050. Epub 2015 Apr 29. J Infect Dis. 2015. PMID: 25926686 Free PMC article.
-
Nuclear factor (erythroid-derived 2)-like 2 (NRF2) drug discovery: Biochemical toolbox to develop NRF2 activators by reversible binding of Kelch-like ECH-associated protein 1 (KEAP1).Arch Biochem Biophys. 2017 Oct 1;631:31-41. doi: 10.1016/j.abb.2017.08.003. Epub 2017 Aug 8. Arch Biochem Biophys. 2017. PMID: 28801166 Review.
-
Filoviral immune evasion mechanisms.Viruses. 2011 Sep;3(9):1634-49. doi: 10.3390/v3091634. Epub 2011 Sep 7. Viruses. 2011. PMID: 21994800 Free PMC article. Review.
Cited by
-
Small Molecule Compounds That Inhibit Antioxidant Response Gene Expression in an Inducer-Dependent Manner.ACS Infect Dis. 2020 Mar 13;6(3):489-502. doi: 10.1021/acsinfecdis.9b00416. Epub 2020 Jan 15. ACS Infect Dis. 2020. PMID: 31899866 Free PMC article.
-
Filovirus Strategies to Escape Antiviral Responses.Curr Top Microbiol Immunol. 2017;411:293-322. doi: 10.1007/82_2017_13. Curr Top Microbiol Immunol. 2017. PMID: 28685291 Free PMC article. Review.
-
Mass Spectrometry-Based Structural Virology.Anal Chem. 2021 Jan 12;93(1):620-640. doi: 10.1021/acs.analchem.0c04339. Epub 2020 Dec 4. Anal Chem. 2021. PMID: 33275424 Free PMC article. Review. No abstract available.
-
The entropic force generated by intrinsically disordered segments tunes protein function.Nature. 2018 Nov;563(7732):584-588. doi: 10.1038/s41586-018-0699-5. Epub 2018 Nov 12. Nature. 2018. PMID: 30420606 Free PMC article.
-
Impact of Měnglà Virus Proteins on Human and Bat Innate Immune Pathways.J Virol. 2020 Jun 16;94(13):e00191-20. doi: 10.1128/JVI.00191-20. Print 2020 Jun 16. J Virol. 2020. PMID: 32295912 Free PMC article.
References
Publication types
MeSH terms
Substances
Grants and funding
LinkOut - more resources
Full Text Sources
Other Literature Sources
Research Materials

