

Evaluating electronic health record data sources and algorithmic approaches to identify hypertensive individuals
- PMID: 27497800
- PMCID: PMC5201185
- DOI: 10.1093/jamia/ocw071
Evaluating electronic health record data sources and algorithmic approaches to identify hypertensive individuals
Abstract
Objective: Phenotyping algorithms applied to electronic health record (EHR) data enable investigators to identify large cohorts for clinical and genomic research. Algorithm development is often iterative, depends on fallible investigator intuition, and is time- and labor-intensive. We developed and evaluated 4 types of phenotyping algorithms and categories of EHR information to identify hypertensive individuals and controls and provide a portable module for implementation at other sites.
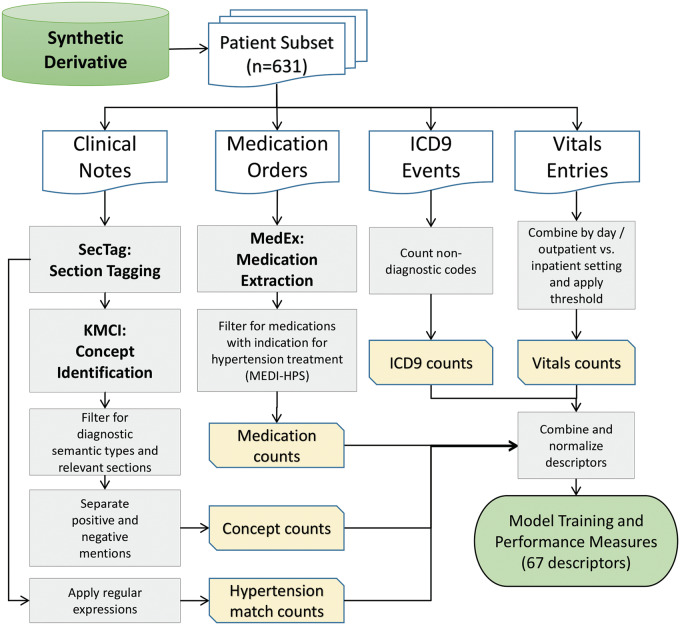
Materials and methods: We reviewed the EHRs of 631 individuals followed at Vanderbilt for hypertension status. We developed features and phenotyping algorithms of increasing complexity. Input categories included International Classification of Diseases, Ninth Revision (ICD9) codes, medications, vital signs, narrative-text search results, and Unified Medical Language System (UMLS) concepts extracted using natural language processing (NLP). We developed a module and tested portability by replicating 10 of the best-performing algorithms at the Marshfield Clinic.
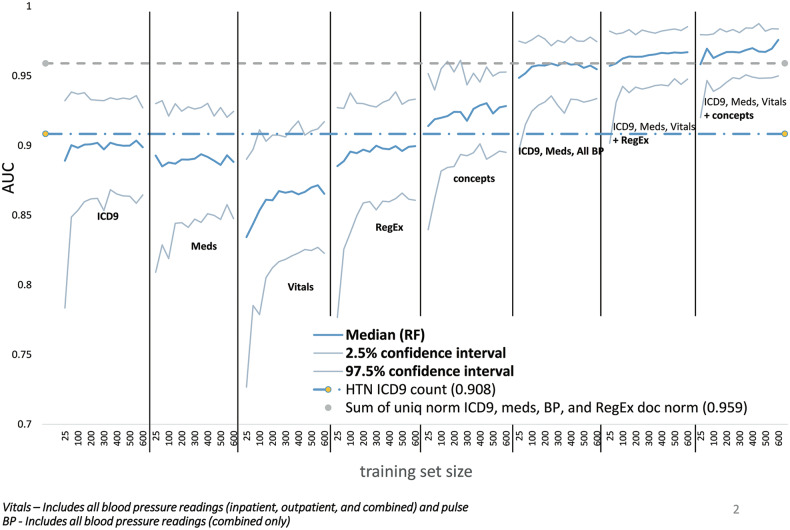
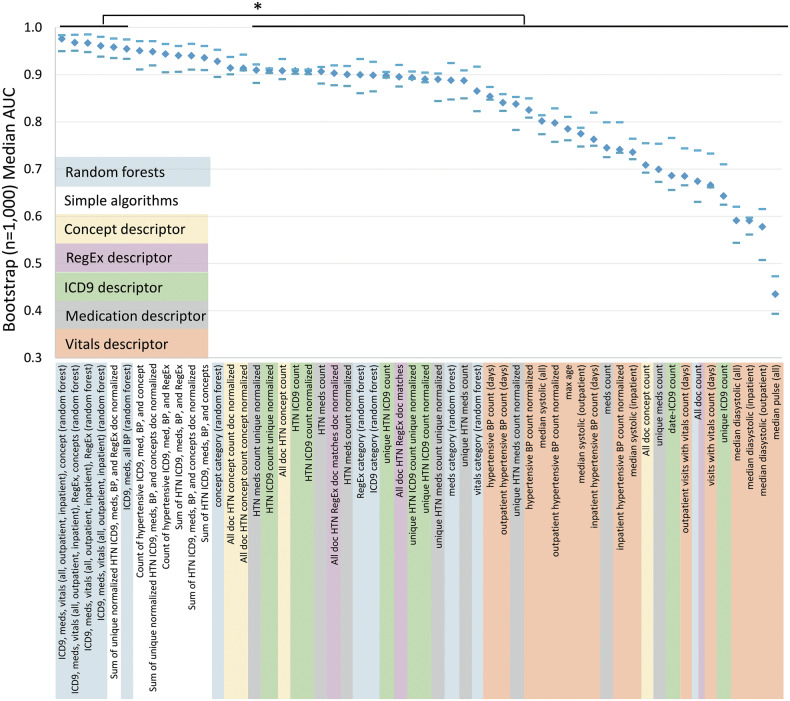
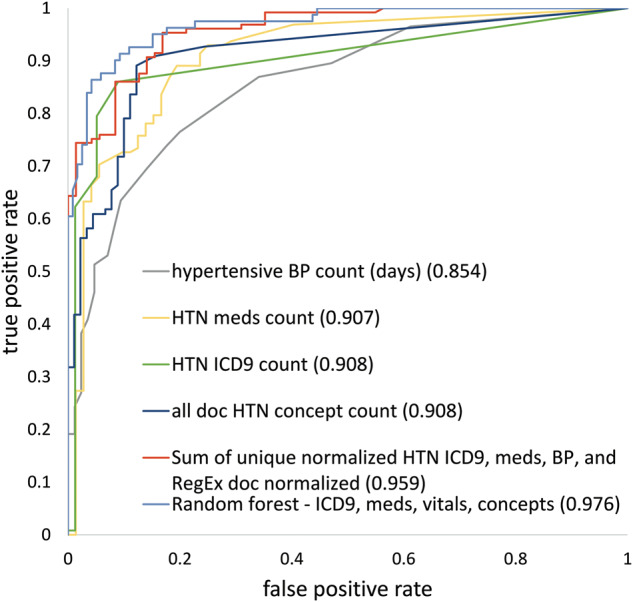
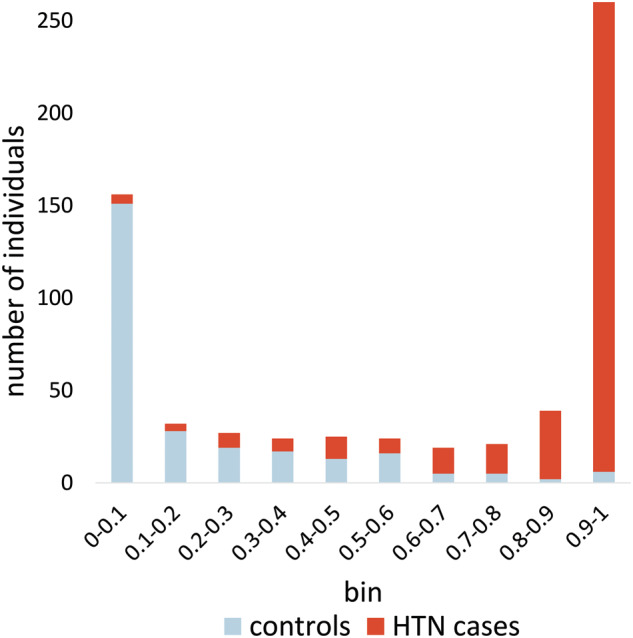
Results: Random forests using billing codes, medications, vitals, and concepts had the best performance with a median area under the receiver operator characteristic curve (AUC) of 0.976. Normalized sums of all 4 categories also performed well (0.959 AUC). The best non-NLP algorithm combined normalized ICD9 codes, medications, and blood pressure readings with a median AUC of 0.948. Blood pressure cutoffs or ICD9 code counts alone had AUCs of 0.854 and 0.908, respectively. Marshfield Clinic results were similar.
Conclusion: This work shows that billing codes or blood pressure readings alone yield good hypertension classification performance. However, even simple combinations of input categories improve performance. The most complex algorithms classified hypertension with excellent recall and precision.
Keywords: electronic health records; hypertension; machine learning; natural language processing; phenotyping algorithms; random forests.
© The Author 2016. Published by Oxford University Press on behalf of the American Medical Informatics Association. All rights reserved. For Permissions, please email: journals.permissions@oup.com.
Figures
References
-
- Yoon SS, Gu Q, Nwankwo T, Wright JD, Hong Y, Burt V. Trends in blood pressure among adults with hypertension: United States, 2003 to 2012. Hypertension. 2015;65(1):54–61. http://hyper.ahajournals.org.proxy.library.vanderbilt.edu/content/65/1/54. Accessed July 8, 2015. - PMC - PubMed
-
- Mozaffarian D, Benjamin EJ, Go AS, et al. Heart disease and stroke statistics-2015 update: a report from the American Heart Association. Circulation. 2014;131(4):e29–e322. http://www.ncbi.nlm.nih.gov/pubmed/25520374. Accessed December 19, 2014. - PubMed
-
- Cutler JA, Sorlie PD, Wolz M, Thom T, Fields LE, Roccella EJ. Trends in hypertension prevalence, awareness, treatment, and control rates in United States adults between 1988-1994 and 1999-2004. Hypertension. 2008;52(5):818–827. http://www.ncbi.nlm.nih.gov/pubmed/18852389. Accessed October 1, 2013. - PubMed
-
- WHO ISH Writing Group. 2003. World Health Organization (WHO) and Internal Society of Hypertension (ISH) statemnt on management of hypertension - WHO, ISH Writing Group 2003.pdf. 2003.
-
- Myers MG. A proposed algorithm for diagnosing hypertension using automated office blood pressure measurement. J Hypertens. 2010;28(4): 703–708. - PubMed
Publication types
MeSH terms
Grants and funding
LinkOut - more resources
Full Text Sources
Other Literature Sources
Medical
